Estimated zip code population in 2022: 1,291 Zip code population in 2010: 1,245 Zip code population in 2000: 1,457
Houses and condos: 1,017 Renter-occupied apartments: 112
% of renters here:
17%
State:
27%
March 2022 cost of living index in zip code 48469: 82.0 (low, U.S. average is 100)
Land area: 7.9 sq. mi. Water area: 1.1 sq. mi.
Population density: 164 people per square mile
(very low).
OSM Map
General Map
Google Map
MSN Map
OSM Map
General Map
Google Map
MSN Map
OSM Map
General Map
Google Map
MSN Map
OSM Map
General Map
Google Map
MSN Map
Please wait while loading the map...
Real estate property taxes paid for housing units in 2022:
This zip code:
1.1% ($2,188)
Michigan:
1.2% ($2,746)
Median real estate property taxes paid for housing units with mortgages in 2022: $2,294 (1.4%) Median real estate property taxes paid for housing units with no mortgage in 2022: $2,021 (0.9%)
Business Search- 14 Million verified businesses
Males: 649
(50.2%)
Females: 642
(49.8%)
For population 25 years and over in 48469:
High school or higher: 92.9%
Bachelor's degree or higher: 20.9%
Graduate or professional degree: 5.5%
Unemployed: 2.0%
Mean travel time to work (commute): 36.1 minutes
For population 15 years and over in 48469:
Never married: 23.3%
Now married: 55.3%
Separated: 1.5%
Widowed: 8.6%
Divorced: 11.2%
Zip code 48469 compared to state average:
Unemployed percentage below state average.
Black race population percentage significantly below state average.
Hispanic race population percentage below state average.
Median age significantly above state average.
Foreign-born population percentage significantly below state average.
Renting percentage below state average.
Length of stay since moving in above state average.
Number of college students significantly below state average.
Averages for the 2020 tax year for zip code 48469, filed in 2021:
Average Adjusted Gross Income (AGI) in 2020: $60,169 (Individual Income Tax Returns)
Here:
$60,169
State:
$68,945
Salary/wage: $49,593 (reported on 65.7% of returns)
Here:
$49,593
State:
$57,142
(% of AGI for various income ranges: 848.1% for AGIs below $25k, 2655.5% for AGIs $25k-50k, 5340.0% for AGIs $50k-75k, 7032.5% for AGIs $75k-100k, 10145.0% for AGIs $100k-200k)
Taxable interest for individuals: $1,335 (reported on 44.3% of returns)
This zip code:
$1,335
Michigan:
$1,630
(% of AGI for various income ranges: 14.4% for AGIs below $25k, 23.6% for AGIs $25k-50k, 20.0% for AGIs $50k-75k, 22.5% for AGIs $75k-100k, 251.7% for AGIs $100k-200k)
Ordinary dividends: $4,883 (reported on 25.7% of returns)
Here:
$4,883
State:
$6,972
(% of AGI for various income ranges: 56.2% for AGIs below $25k, 114.5% for AGIs $25k-50k, 23.3% for AGIs $50k-75k, 122.5% for AGIs $75k-100k, 1000.0% for AGIs $100k-200k)
Net capital gain/loss in AGI: +$5,100 (reported on 21.4% of returns)
Here:
+$5,100
State:
+$20,064
(% of AGI for various income ranges: 12.5% for AGIs below $25k, 69.1% for AGIs $25k-50k, 343.3% for AGIs $50k-75k, 771.7% for AGIs $100k-200k)
Profit/loss from business: +$3,783 (reported on 17.1% of returns)
Here:
+$3,783
State:
+$11,172
(% of AGI for various income ranges: 90.0% for AGIs below $25k, 44.5% for AGIs $25k-50k, 505.0% for AGIs $100k-200k)
Taxable individual retirement arrangement distribution: $20,909 (reported on 15.7% of returns)
48469:
$20,909
Michigan:
$19,803
(% of AGI for various income ranges: 221.9% for AGIs below $25k, 858.3% for AGIs $50k-75k, 2383.3% for AGIs $100k-200k)
Total itemized deductions: $30,967 (reported on 4.3% of returns)
Here:
$30,967
State:
$34,117
(% of AGI for various income ranges: 1548.3% for AGIs $100k-200k)
Charity contributions: $7,950 (reported on 2.9% of returns)
Here:
$7,950
State:
$13,548
(% of AGI for various income ranges: 265.0% for AGIs $50k-75k)
Taxes paid: $8,567 (reported on 4.3% of returns)
48469:
$8,567
State:
$7,972
(% of AGI for various income ranges: 428.3% for AGIs $100k-200k)
Earned income credit: $2,000 (reported on 10.0% of returns)
Here:
$2,000
State:
$2,251
(% of AGI for various income ranges: 56.2% for AGIs below $25k, 45.5% for AGIs $25k-50k)
Percentage of individuals using paid preparers for their 2020 taxes: 92.9%
Here:
93%
State:
93%
(% for various income ranges: 92.6% for AGIs below $25k, 93.3% for AGIs $25k-50k, 88.9% for AGIs $50k-75k, 100.0% for AGIs $75k-100k, 90.0% for AGIs $100k-200k, 100.0% for AGIs over 200k)
Averages for the 2012 tax year for zip code 48469, filed in 2013:
Average Adjusted Gross Income (AGI) in 2012: $48,511 (Individual Income Tax Returns)
Here:
$48,511
State:
$55,609
Salary/wage: $38,579 (reported on 68.9% of returns)
Here:
$38,579
State:
$46,782
(% of AGI for various income ranges: 54.9% for AGIs below $25k, 61.0% for AGIs $25k-50k, 58.3% for AGIs $50k-75k, 48.7% for AGIs $75k-100k, 52.1% for AGIs $100k-200k)
Taxable interest for individuals: $1,260 (reported on 41.0% of returns)
This zip code:
$1,260
Michigan:
$1,491
(% of AGI for various income ranges: 4.4% for AGIs below $25k, 0.8% for AGIs $25k-50k, 0.7% for AGIs $50k-75k, 0.5% for AGIs $75k-100k, 0.8% for AGIs $100k-200k)
Ordinary dividends: $3,424 (reported on 27.9% of returns)
Here:
$3,424
State:
$6,225
(% of AGI for various income ranges: 2.0% for AGIs below $25k, 1.8% for AGIs $25k-50k, 2.7% for AGIs $50k-75k, 2.0% for AGIs $75k-100k, 1.7% for AGIs $100k-200k)
Net capital gain/loss in AGI: +$231 (reported on 21.3% of returns)
Here:
+$231
State:
+$9,326
(% of AGI for various income ranges: 0.1% for AGIs $50k-75k, 0.7% for AGIs $100k-200k)
Profit/loss from business: +$7,118 (reported on 18.0% of returns)
Here:
+$7,118
State:
+$11,523
(% of AGI for various income ranges: 10.3% for AGIs below $25k, 6.5% for AGIs $25k-50k, 2.7% for AGIs $75k-100k)
Taxable individual retirement arrangement distribution: $13,117 (reported on 19.7% of returns)
48469:
$13,117
Michigan:
$15,298
(% of AGI for various income ranges: 5.0% for AGIs below $25k, 5.8% for AGIs $25k-50k, 4.9% for AGIs $50k-75k, 17.5% for AGIs $75k-100k)
Total itemized deductions: $19,353 (23% of AGI, reported on 27.9% of returns)
Here:
$19,353
State:
$21,628
Here:
22.6% of AGI
State:
18.4% of AGI
(% of AGI for various income ranges: 11.6% for AGIs below $25k, 9.1% for AGIs $25k-50k, 11.7% for AGIs $50k-75k, 9.8% for AGIs $75k-100k, 12.4% for AGIs $100k-200k)
Charity contributions: $3,293 (reported on 23.0% of returns)
Here:
$3,293
State:
$4,225
(% of AGI for various income ranges: 1.3% for AGIs $25k-50k, 1.1% for AGIs $50k-75k, 1.6% for AGIs $75k-100k, 2.3% for AGIs $100k-200k)
Taxes paid: $7,250 (reported on 26.2% of returns)
48469:
$7,250
State:
$8,327
(% of AGI for various income ranges: 2.5% for AGIs below $25k, 2.6% for AGIs $25k-50k, 3.0% for AGIs $50k-75k, 3.6% for AGIs $75k-100k, 5.6% for AGIs $100k-200k)
Earned income credit: $2,233 (reported on 14.8% of returns)
Here:
$2,233
State:
$2,306
(% of AGI for various income ranges: 5.0% for AGIs below $25k, 1.1% for AGIs $25k-50k)
Percentage of individuals using paid preparers for their 2012 taxes: 70.5%
Here:
70%
State:
57%
(% for various income ranges: 66.7% for AGIs below $25k, 75.0% for AGIs $25k-50k, 77.8% for AGIs $50k-75k, 60.0% for AGIs $75k-100k, 71.4% for AGIs $100k-200k)
Averages for the 2004 tax year for zip code 48469, filed in 2005:
Average Adjusted Gross Income (AGI) in 2004: $37,329 (Individual Income Tax Returns)
Here:
$37,329
State:
$48,204
Salary/wage: $31,926 (reported on 67.9% of returns)
Here:
$31,926
State:
$42,791
(% of AGI for various income ranges: 72.5% for AGIs below $10k, 44.2% for AGIs $10k-25k, 55.5% for AGIs $25k-50k, 67.5% for AGIs $50k-75k, 56.9% for AGIs $75k-100k, 59.8% for AGIs over 100k)
Taxable interest for individuals: $1,632 (reported on 60.7% of returns)
This zip code:
$1,632
Michigan:
$1,725
(% of AGI for various income ranges: 10.6% for AGIs below $10k, 5.9% for AGIs $10k-25k, 3.1% for AGIs $25k-50k, 0.9% for AGIs $50k-75k, 2.6% for AGIs $75k-100k, 1.4% for AGIs over 100k)
Taxable dividends: $2,135 (reported on 34.0% of returns)
Here:
$2,135
State:
$3,420
(% of AGI for various income ranges: 4.9% for AGIs below $10k, 3.5% for AGIs $10k-25k, 2.2% for AGIs $25k-50k, 2.2% for AGIs $50k-75k, 0.4% for AGIs $75k-100k, 1.6% for AGIs over 100k)
Net capital gain/loss: +$2,919 (reported on 24.0% of returns)
Here:
+$2,919
State:
+$8,532
(% of AGI for various income ranges: 3.4% for AGIs below $10k, 1.6% for AGIs $10k-25k, 0.5% for AGIs $25k-50k, -0.2% for AGIs $50k-75k, 1.2% for AGIs $75k-100k, 5.1% for AGIs over 100k)
Profit/loss from business: +$4,729 (reported on 18.5% of returns)
Here:
+$4,729
State:
+$9,547
(% of AGI for various income ranges: 1.8% for AGIs below $10k, 6.0% for AGIs $10k-25k, 2.6% for AGIs $25k-50k, 1.8% for AGIs $50k-75k, 2.3% for AGIs $75k-100k, 0.7% for AGIs over 100k)
IRA payment deduction: $2,650 (reported on 2.8% of returns)
48469:
$2,650
Michigan:
$2,875
Total itemized deductions: $18,173 (25% of AGI, reported on 25.8% of returns)
Here:
$18,173
State:
$18,509
Here:
25.1% of AGI
State:
20.7% of AGI
(% of AGI for various income ranges: 12.1% for AGIs $10k-25k, 10.8% for AGIs $25k-50k, 12.4% for AGIs $50k-75k, 13.6% for AGIs $75k-100k, 14.8% for AGIs over 100k)
Charity contributions deductions: $2,573 (3% of AGI, reported on 22.9% of returns)
Here:
$2,573
State:
$3,365
Here:
3.4% of AGI
State:
3.6% of AGI
(% of AGI for various income ranges: 1.2% for AGIs $10k-25k, 1.2% for AGIs $25k-50k, 1.2% for AGIs $50k-75k, 2.0% for AGIs $75k-100k, 2.2% for AGIs over 100k)
Total tax: $5,032 (reported on 74.3% of returns)
48469:
$5,032
State:
$7,691
(% of AGI for various income ranges: 2.0% for AGIs below $10k, 3.9% for AGIs $10k-25k, 6.4% for AGIs $25k-50k, 9.1% for AGIs $50k-75k, 11.1% for AGIs $75k-100k, 16.9% for AGIs over 100k)
Earned income credit: $1,877 (reported on 11.3% of returns)
Here:
$1,877
State:
$1,737
Percentage of individuals using paid preparers for their 2004 taxes: 71.3%
Here:
71%
State:
60%
(% for various income ranges: 67.5% for AGIs below $10k, 70.6% for AGIs $10k-25k, 73.1% for AGIs $25k-50k, 70.2% for AGIs $50k-75k, 76.4% for AGIs $75k-100k, 76.7% for AGIs over 100k)
Household received Food Stamps/SNAP in the past 12 months: 79 Household did not receive Food Stamps/SNAP in the past 12 months: 570
Women who had a birth in the past 12 months: 11 (0 now married, 10 unmarried) Women who did not have a birth in the past 12 months: 189 (64 now married, 125 unmarried)
Housing units in zip code 48469 with a mortgage: 276 (12 second mortgage, 12 both second mortgage and home equity loan) Median monthly owner costs for units with a mortgage: $1,211 Median monthly owner costs for units without a mortgage: $495
Residents with income below the poverty level in 2022:
This zip code:
15.3%
Whole state:
13.4%
Residents with income below 50% of the poverty level in 2022:
This zip code:
6.9%
Whole state:
6.9%
Median number of rooms in houses and condos:
Here:
6.0
State:
6.5
Median number of rooms in apartments:
Here:
4.7
State:
4.3
Notable locations in this zip code not listed on our city pages
Notable locations in zip code 48469: Port Sanilac Light (A), Sanilac Marina (B), NWS Signal Station (C), Sanilac Township Hall (D), Huron Shores Golf Club (E), Port Sanilac Fire Department (F), Sanilac District Library (G), Port Sanilac Police Department (H). Display/hide their locations on the map
Creeks: Twin Hill Creek (A), Herron Creek (B), Forester Creek (C), Liens Creek (D), Crawford Creek (E), Miller Creek (F). Display/hide their locations on the map
Parks in zip code 48469 include: Masonic and Town Hall Historical Marker (1), Loop-Harrison House Historical Marker (2), Great Storm of 1913 Historical Marker (3). Display/hide their locations on the map
In group quarters: 12 (-1 institutionalized population)
Size of family households: 223 2-persons, 58 3-persons, 32 4-persons, 53 5-persons
Size of nonfamily households: 267 1-person, 6 2-persons, 11 3-persons
123 married couples with children.
94 single-parent households (45 men, 49 women).
99.2% of residents of 48469 zip code speak English at home.
0.9% of residents speak Spanish at home (100% very well).
0.6% of residents speak other Indo-European language at home (100% very well).
Foreign born population: 29 (2.3%) (31.1% of them are naturalized citizens)
This zip code:
2.3%
Whole state:
6.9%
33%Denmark
27%El Salvador
29%German
16%English
13%Polish
7%Irish
5%American
5%Italian
4%European
Year of entry for the foreign-born population
162010 or later
02000 to 2009
41990 to 1999
16Before 1990
Facilities with environmental interests located in this zip code:
BINDICATOR CO (205 N RIDGE RD in PORT SANILAC, MI)
GREAT LAKES LIMOUSINE REPAIR (1993 N LAKESHORE RD in PORT SANILAC, MI)
Conditionally Exempt Small Quantity Generators, less than 100 kg/month of hazardous waste (Resource Conservation and Recovery Act (tracking hazardous waste)) Organizations: RICK WATSON (CONTACT/OWNER)
Housing units lacking complete plumbing facilities: 1.1% Housing units lacking complete kitchen facilities: 0.4%
79.1%Utility gas
10.4%Bottled, tank, or LP gas
7.1%Electricity
1.6%Wood
1.6%Other fuel
0.6%No fuel used
Population in 1990: 254. Population change in the 1990s: +1,203 (+473.6%).
Place of birth for U.S.-born residents:
This state: 1,101
Northeast: 62
Midwest: 36
South: 26
West: 26
61% of the 48469 zip code residents lived in the same house 5 years ago. Out of people who lived in different houses, 54% lived in this county. Out of people who lived in different counties, 50% lived in Michigan.
86% of the 48469 zip code residents lived in the same house 1 year ago. Out of people who lived in different houses, 52% moved from this county. Out of people who lived in different houses, 38% moved from different county within same state. Out of people who lived in different houses, 6% moved from different state.
Private vs. public school enrollment:
Students in private schools in grades 1 to 8 (elementary and middle school):
Here:
0.0%
Michigan:
12.4%
Students in private schools in grades 9 to 12 (high school):
Here:
0.0%
Michigan:
9.8%
Students in private undergraduate colleges:
Here:
0.0%
Michigan:
14.9%
Occupation by median earnings in the past 12 months ($)
118,076Health diagnosing and treating practitioners and other technical occupations
88,498Architecture and engineering occupations
50,390Installation, maintenance, and repair occupations
43,286Management occupations
40,122Production occupations
31,373Construction and extraction occupations
Top industries in this zip code by the number of employees in 2005:
Other Services (except Public Administration): Automotive Body, Paint, and Interior Repair and Maintenance (20-49 employees: 1 establishment, 1-4 employees: 1 establishment)
Wholesale Trade: Plastics Materials and Basic Forms and Shapes Merchant Wholesalers (20-49: 1)
Construction: New Single-Family Housing Construction (except Operative Builders) (20-49: 1)
Health Care and Social Assistance: Residential Mental Retardation Facilities (20-49: 1)
Accommodation and Food Services: Full-Service Restaurants (10-19: 2)
Health Care and Social Assistance: Offices of Physicians (except Mental Health Specialists) (10-19: 1, 1-4: 1)
Accommodation and Food Services: Limited-Service Restaurants (10-19: 1, 1-4: 1)
Health Care and Social Assistance: Offices of Dentists (10-19: 1)
Arts, Entertainment, and Recreation: Golf Courses and Country Clubs (10-19: 1)
People in group quarters in 2010:
18 people in group homes intended for adults
People in group quarters in 2000:
6 people in homes for the mentally ill
5 people in other group homes
4 people in agriculture workers' dormitories on farms
Most common first names in zip code 48469 among deceased individuals
Name
Count
Lived (average)
John
22
75.3 years
William
18
76.3 years
Mary
17
77.9 years
Robert
15
76.9 years
Joseph
15
74.7 years
Margaret
13
79.8 years
George
13
77.2 years
Charles
13
74.0 years
Edward
11
74.4 years
Frank
11
72.3 years
Most common last names in zip code 48469 among deceased individuals
Last name
Count
Lived (average)
Smith
8
75.4 years
Johnson
5
85.2 years
Platts
5
83.2 years
Falls
4
75.5 years
Foley
4
66.8 years
Albrecht
4
75.8 years
Murray
4
66.7 years
Thomas
4
73.3 years
Griffin
3
80.3 years
Brady
3
72.3 years
Businesses in zip code 48469
True Value: 1
Discuss Port Sanilac, Michigan (MI) on our hugely popular Michigan forum.

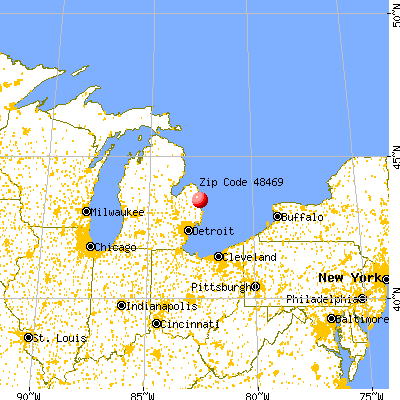


 Nearest zip codes: 48419, 48401, 48450, 48427, 48422, 48465.


