Estimated zip code population in 2022: 5,990 Zip code population in 2010: 6,400 Zip code population in 2000: 6,346
Houses and condos: 2,807 Renter-occupied apartments: 488
% of renters here:
19%
State:
27%
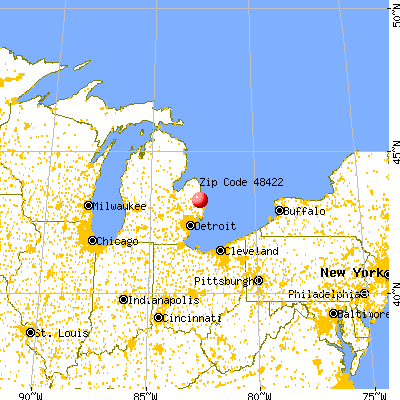
March 2022 cost of living index in zip code 48422: 81.1 (low, U.S. average is 100)
Land area: 95.9 sq. mi. Water area: 0.4 sq. mi.
Population density: 62 people per square mile
(very low).
OSM Map
General Map
Google Map
MSN Map
OSM Map
General Map
Google Map
MSN Map
OSM Map
General Map
Google Map
MSN Map
OSM Map
General Map
Google Map
MSN Map
Please wait while loading the map...
Real estate property taxes paid for housing units in 2022:
This zip code:
0.8% ($1,374)
Michigan:
1.2% ($2,746)
Median real estate property taxes paid for housing units with mortgages in 2022: $1,433 (0.8%) Median real estate property taxes paid for housing units with no mortgage in 2022: $1,285 (1.0%)
Estimated median house/condo value in 2022: $163,362
48422:
$163,362
Michigan:
$224,400
According to our research of Michigan and other state lists, there were 15 registered sex offenders living in 48422 zip code as of May 23, 2024. The ratio of all residents to sex offenders in zip code 48422 is 435 to 1. The ratio of registered sex offenders to all residents in this zip code is lower than the state average.
Median resident age:
This zip code:
46.3 years
Michigan median age:
40.3 years
Average household size:
This zip code:
2.4 people
Michigan:
2.4 people
Averages for the 2020 tax year for zip code 48422, filed in 2021:
Average Adjusted Gross Income (AGI) in 2020: $47,744 (Individual Income Tax Returns)
Here:
$47,744
State:
$68,945
Salary/wage: $43,214 (reported on 77.1% of returns)
Here:
$43,214
State:
$57,142
(% of AGI for various income ranges: 917.5% for AGIs below $25k, 3031.9% for AGIs $25k-50k, 5993.7% for AGIs $50k-75k, 9280.0% for AGIs $75k-100k, 15435.8% for AGIs $100k-200k)
Taxable interest for individuals: $1,331 (reported on 26.3% of returns)
This zip code:
$1,331
Michigan:
$1,630
(% of AGI for various income ranges: 21.0% for AGIs below $25k, 27.3% for AGIs $25k-50k, 36.0% for AGIs $50k-75k, 48.0% for AGIs $75k-100k, 258.9% for AGIs $100k-200k)
Ordinary dividends: $2,952 (reported on 14.1% of returns)
Here:
$2,952
State:
$6,972
(% of AGI for various income ranges: 14.6% for AGIs below $25k, 17.1% for AGIs $25k-50k, 60.7% for AGIs $50k-75k, 77.0% for AGIs $75k-100k, 357.4% for AGIs $100k-200k)
Net capital gain/loss in AGI: +$6,505 (reported on 13.8% of returns)
Here:
+$6,505
State:
+$20,064
(% of AGI for various income ranges: 8.1% for AGIs below $25k, 31.1% for AGIs $25k-50k, 69.0% for AGIs $50k-75k, 130.0% for AGIs $75k-100k, 1012.6% for AGIs $100k-200k)
Profit/loss from business: +$8,285 (reported on 13.1% of returns)
Here:
+$8,285
State:
+$11,172
(% of AGI for various income ranges: 87.9% for AGIs below $25k, 112.6% for AGIs $25k-50k, 201.3% for AGIs $50k-75k, 161.5% for AGIs $75k-100k, 464.7% for AGIs $100k-200k)
Taxable individual retirement arrangement distribution: $12,836 (reported on 9.4% of returns)
48422:
$12,836
Michigan:
$19,803
(% of AGI for various income ranges: 70.0% for AGIs below $25k, 97.4% for AGIs $25k-50k, 197.0% for AGIs $50k-75k, 362.5% for AGIs $75k-100k, 574.7% for AGIs $100k-200k)
Total itemized deductions: $25,300 (reported on 1.3% of returns)
Here:
$25,300
State:
$34,117
(% of AGI for various income ranges: 506.0% for AGIs $75k-100k)
Charity contributions: $7,267 (reported on 1.0% of returns)
Here:
$7,267
State:
$13,548
(% of AGI for various income ranges: 109.0% for AGIs $75k-100k)
Taxes paid: $6,425 (reported on 1.3% of returns)
48422:
$6,425
State:
$7,972
(% of AGI for various income ranges: 128.5% for AGIs $75k-100k)
Earned income credit: $2,287 (reported on 15.5% of returns)
Here:
$2,287
State:
$2,251
(% of AGI for various income ranges: 77.6% for AGIs below $25k, 70.4% for AGIs $25k-50k)
Percentage of individuals using paid preparers for their 2020 taxes: 93.9%
Here:
94%
State:
93%
(% for various income ranges: 93.6% for AGIs below $25k, 94.1% for AGIs $25k-50k, 95.1% for AGIs $50k-75k, 93.1% for AGIs $75k-100k, 93.3% for AGIs $100k-200k, 100.0% for AGIs over 200k)
Averages for the 2012 tax year for zip code 48422, filed in 2013:
Average Adjusted Gross Income (AGI) in 2012: $40,756 (Individual Income Tax Returns)
Here:
$40,756
State:
$55,609
Salary/wage: $37,293 (reported on 79.9% of returns)
Here:
$37,293
State:
$46,782
(% of AGI for various income ranges: 65.4% for AGIs below $25k, 73.7% for AGIs $25k-50k, 81.7% for AGIs $50k-75k, 77.1% for AGIs $75k-100k, 66.7% for AGIs $100k-200k)
Taxable interest for individuals: $1,118 (reported on 29.7% of returns)
This zip code:
$1,118
Michigan:
$1,491
(% of AGI for various income ranges: 1.3% for AGIs below $25k, 0.9% for AGIs $25k-50k, 0.4% for AGIs $50k-75k, 0.6% for AGIs $75k-100k, 1.0% for AGIs $100k-200k)
Ordinary dividends: $2,068 (reported on 16.8% of returns)
Here:
$2,068
State:
$6,225
(% of AGI for various income ranges: 0.9% for AGIs below $25k, 0.8% for AGIs $25k-50k, 0.5% for AGIs $50k-75k, 0.4% for AGIs $75k-100k, 1.4% for AGIs $100k-200k)
Net capital gain/loss in AGI: +$2,729 (reported on 12.5% of returns)
Here:
+$2,729
State:
+$9,326
(% of AGI for various income ranges: 0.2% for AGIs below $25k, 0.6% for AGIs $25k-50k, 0.8% for AGIs $50k-75k, 0.6% for AGIs $75k-100k, 1.6% for AGIs $100k-200k)
Profit/loss from business: +$6,122 (reported on 14.3% of returns)
Here:
+$6,122
State:
+$11,523
(% of AGI for various income ranges: 7.9% for AGIs below $25k, 2.4% for AGIs $25k-50k, 0.3% for AGIs $50k-75k, 1.0% for AGIs $75k-100k, 1.5% for AGIs $100k-200k)
Taxable individual retirement arrangement distribution: $9,394 (reported on 11.5% of returns)
48422:
$9,394
Michigan:
$15,298
(% of AGI for various income ranges: 3.9% for AGIs below $25k, 3.8% for AGIs $25k-50k, 1.6% for AGIs $50k-75k, 2.7% for AGIs $75k-100k, 2.1% for AGIs $100k-200k)
Total itemized deductions: $17,332 (21% of AGI, reported on 17.9% of returns)
Here:
$17,332
State:
$21,628
Here:
20.6% of AGI
State:
18.4% of AGI
(% of AGI for various income ranges: 5.4% for AGIs below $25k, 5.7% for AGIs $25k-50k, 7.6% for AGIs $50k-75k, 8.7% for AGIs $75k-100k, 9.5% for AGIs $100k-200k)
Charity contributions: $2,214 (reported on 13.3% of returns)
Here:
$2,214
State:
$4,225
(% of AGI for various income ranges: 0.2% for AGIs below $25k, 0.5% for AGIs $25k-50k, 0.5% for AGIs $50k-75k, 1.1% for AGIs $75k-100k, 1.1% for AGIs $100k-200k)
Taxes paid: $5,416 (reported on 17.9% of returns)
48422:
$5,416
State:
$8,327
(% of AGI for various income ranges: 0.9% for AGIs below $25k, 1.2% for AGIs $25k-50k, 2.1% for AGIs $50k-75k, 2.6% for AGIs $75k-100k, 4.1% for AGIs $100k-200k)
Earned income credit: $2,237 (reported on 21.1% of returns)
Here:
$2,237
State:
$2,306
(% of AGI for various income ranges: 7.0% for AGIs below $25k, 1.3% for AGIs $25k-50k)
Percentage of individuals using paid preparers for their 2012 taxes: 69.9%
Here:
70%
State:
57%
(% for various income ranges: 68.5% for AGIs below $25k, 70.8% for AGIs $25k-50k, 72.1% for AGIs $50k-75k, 63.6% for AGIs $75k-100k, 78.9% for AGIs $100k-200k)
Averages for the 2004 tax year for zip code 48422, filed in 2005:
Average Adjusted Gross Income (AGI) in 2004: $34,809 (Individual Income Tax Returns)
Here:
$34,809
State:
$48,204
Salary/wage: $33,363 (reported on 84.5% of returns)
Here:
$33,363
State:
$42,791
(% of AGI for various income ranges: 102.0% for AGIs below $10k, 73.2% for AGIs $10k-25k, 79.0% for AGIs $25k-50k, 86.0% for AGIs $50k-75k, 84.7% for AGIs $75k-100k, 74.2% for AGIs over 100k)
Taxable interest for individuals: $1,376 (reported on 45.6% of returns)
This zip code:
$1,376
Michigan:
$1,725
(% of AGI for various income ranges: 7.7% for AGIs below $10k, 2.2% for AGIs $10k-25k, 1.5% for AGIs $25k-50k, 1.4% for AGIs $50k-75k, 1.0% for AGIs $75k-100k, 2.7% for AGIs over 100k)
Taxable dividends: $1,609 (reported on 20.3% of returns)
Here:
$1,609
State:
$3,420
(% of AGI for various income ranges: 3.0% for AGIs below $10k, 1.2% for AGIs $10k-25k, 0.9% for AGIs $25k-50k, 0.4% for AGIs $50k-75k, 0.8% for AGIs $75k-100k, 1.5% for AGIs over 100k)
Net capital gain/loss: +$4,259 (reported on 13.4% of returns)
Here:
+$4,259
State:
+$8,532
(% of AGI for various income ranges: -0.7% for AGIs below $10k, 0.1% for AGIs $10k-25k, 0.5% for AGIs $25k-50k, 0.8% for AGIs $50k-75k, 2.7% for AGIs $75k-100k, 5.4% for AGIs over 100k)
Profit/loss from business: +$5,633 (reported on 16.0% of returns)
Here:
+$5,633
State:
+$9,547
(% of AGI for various income ranges: 4.1% for AGIs below $10k, 4.6% for AGIs $10k-25k, 2.6% for AGIs $25k-50k, 1.6% for AGIs $50k-75k, 2.3% for AGIs $75k-100k, 2.7% for AGIs over 100k)
IRA payment deduction: $2,563 (reported on 3.1% of returns)
48422:
$2,563
Michigan:
$2,875
(% of AGI for various income ranges: 0.3% for AGIs $10k-25k, 0.3% for AGIs $25k-50k, 0.2% for AGIs $50k-75k, 0.4% for AGIs $75k-100k)
Self-employed pension: $4,500 (reported on 0.4% of returns)
Here:
$4,500
Michigan:
$13,826
Total itemized deductions: $14,770 (24% of AGI, reported on 24.6% of returns)
Here:
$14,770
State:
$18,509
Here:
23.9% of AGI
State:
20.7% of AGI
(% of AGI for various income ranges: 8.7% for AGIs below $10k, 6.6% for AGIs $10k-25k, 10.6% for AGIs $25k-50k, 11.1% for AGIs $50k-75k, 12.2% for AGIs $75k-100k, 10.4% for AGIs over 100k)
Charity contributions deductions: $1,822 (3% of AGI, reported on 20.9% of returns)
Here:
$1,822
State:
$3,365
Here:
2.8% of AGI
State:
3.6% of AGI
(% of AGI for various income ranges: 0.6% for AGIs below $10k, 0.5% for AGIs $10k-25k, 0.9% for AGIs $25k-50k, 1.1% for AGIs $50k-75k, 1.3% for AGIs $75k-100k, 1.8% for AGIs over 100k)
Total tax: $4,231 (reported on 70.4% of returns)
48422:
$4,231
State:
$7,691
(% of AGI for various income ranges: 3.2% for AGIs below $10k, 4.0% for AGIs $10k-25k, 5.9% for AGIs $25k-50k, 7.8% for AGIs $50k-75k, 10.1% for AGIs $75k-100k, 17.0% for AGIs over 100k)
Earned income credit: $1,733 (reported on 16.5% of returns)
Here:
$1,733
State:
$1,737
Percentage of individuals using paid preparers for their 2004 taxes: 68.5%
Here:
68%
State:
60%
(% for various income ranges: 63.8% for AGIs below $10k, 66.9% for AGIs $10k-25k, 71.0% for AGIs $25k-50k, 71.7% for AGIs $50k-75k, 71.8% for AGIs $75k-100k, 75.0% for AGIs over 100k)
Likely homosexual households (counted as self-reported same-sex unmarried-partner households)
Lesbian couples: 0.1% of all households
Gay men: 0.0% of all households
Household received Food Stamps/SNAP in the past 12 months: 305 Household did not receive Food Stamps/SNAP in the past 12 months: 2,242
Women who had a birth in the past 12 months: 44 (45 now married, 0 unmarried) Women who did not have a birth in the past 12 months: 1,211 (462 now married, 748 unmarried)
Housing units in zip code 48422 with a mortgage: 1,226 (112 second mortgage, 104 both second mortgage and home equity loan) Median monthly owner costs for units with a mortgage: $1,085 Median monthly owner costs for units without a mortgage: $390
Residents with income below the poverty level in 2022:
This zip code:
12.1%
Whole state:
13.4%
Residents with income below 50% of the poverty level in 2022:
This zip code:
5.0%
Whole state:
6.9%
Median number of rooms in houses and condos:
Here:
6.3
State:
6.5
Median number of rooms in apartments:
Here:
5.0
State:
4.3
Notable locations in this zip code not listed on our city pages
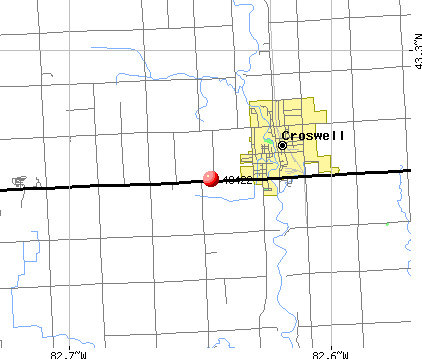
Notable locations in zip code 48422: Croswell Station (A), Croswell Emergency Medical Services (B), William Aitkin Memorial Library (C), Croswell Police Department (D), Croswell Fire Department (E). Display/hide their locations on the map
Churches in zip code 48422 include: Saint Patrick Parish (A), Croswell Community Church (B), Croswell Wesleyan Church (C), Croswell United Methodist Church (D), First Presbyterian Church (E), Bethel Church (F), Croswell Community Church (G), Buel Church (H). Display/hide their locations on the map
Cemeteries: Croswell Village Cemetery (1), Bardwell Cemetery (2), Long Cemetery (3), Lakeview Cemetery (4), Huckins Cemetery (5), Fremont Cemetery (6), Worth Township Cemetery (7). Display/hide their locations on the map
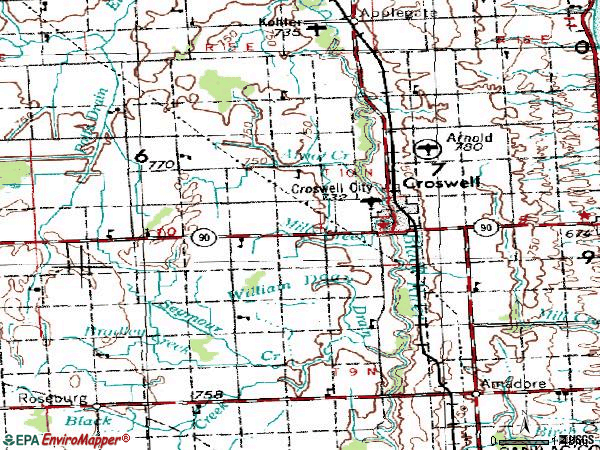
Streams, rivers, and creeks: Freeman Drain (A), Black Creek (B), Arnot Creek (C), Seymour Creek (D), Mills Creek (E). Display/hide their locations on the map
Parks in zip code 48422 include: Harrington Street Park (1), Truman Park (2), Riverbend Park (3), Matthews Farm Historical Marker (4), Buel Methodist Episcopal Church Historical Marker (5). Display/hide their locations on the map
In group quarters: 3 (-1 institutionalized population)
Size of family households: 859 2-persons, 333 3-persons, 391 4-persons, 129 5-persons, 44 6-persons, 1 7-or-more-persons
Size of nonfamily households: 619 1-person, 165 2-persons
613 married couples with children.
393 single-parent households (181 men, 212 women).
95.5% of residents of 48422 zip code speak English at home.
3.8% of residents speak Spanish at home (87% very well, 5% well, 8% not well).
0.3% of residents speak other Indo-European language at home (32% very well, 42% well, 26% not well).
0.2% of residents speak Asian or Pacific Island language at home (100% very well).
0.1% of residents speak other language at home (100% very well).
Foreign born population: 53 (0.9%) (49.4% of them are naturalized citizens)
This zip code:
0.9%
Whole state:
6.9%
26%Honduras
6%Poland
4%Sweden
4%United Kingdom, excluding England and Scotland
4%North Macedonia (Macedonia)
4%Georgia
25%German
14%Polish
10%English
10%American
9%Irish
3%Belgian
1%Canadian
Year of entry for the foreign-born population
142010 or later
02000 to 2009
151990 to 1999
56Before 1990
Major facilities with environmental interests located in this zip code:
FROSTICK SCHOOL (57 S. HOWARD AVENUE in CROSWELL, MI)
(National Center for Education Statistics) - STATE ID-01335 Organizations: CROSWELL-LEXINGTON COMMUNITY SCHOOLS (SCHOOL DISTRICT)
GEIGER ELEMENTARY SCHOOL (15 S. HOWARD AVENUE in CROSWELL, MI)
(National Center for Education Statistics) - STATE ID-00840 Organizations: CROSWELL-LEXINGTON COMMUNITY SCHOOLS (SCHOOL DISTRICT)
BEADEN SCREEN INC (305 MELVIN ST in CROSWELL, MI)
(Resource Conservation and Recovery Act (tracking hazardous waste))
MI DEPT/TRANSPORTATION BRIDGE (M-90 OVER WB MILLS CREEK in CROSWELL, MI)
(Resource Conservation and Recovery Act (tracking hazardous waste)) Organizations: MICH DEPT OF TRANSPORTATION (CONTACT/OPERATOR)
Alternative names: MIDOT BRIDGE M-90 OVER WB MILLS CRK
MI DEPT/TRANSPORTATION BRIDGE B04-74022 (M-90 OVER EB MILLS CREEK in CROSWELL, MI)
(Resource Conservation and Recovery Act (tracking hazardous waste)) Organizations: MICH DEPT OF TRANSPORTATION (CONTACT/OPERATOR)
Alternative names: MIDOT BRIDGE M-90 OVER MILLS CREEK
AMERITECH CORP (45 E HARRINGTON in CROSWELL, MI)
(Resource Conservation and Recovery Act (tracking hazardous waste))
Housing units lacking complete plumbing facilities: 3.4% Housing units lacking complete kitchen facilities: 1.8%
48.6%Utility gas
25.7%Bottled, tank, or LP gas
12.1%Electricity
7.3%Wood
3.4%No fuel used
2.4%Fuel oil, kerosene, etc.
0.6%Other fuel
Population in 1990: 5,931. Population change in the 1990s: +415 (+7.0%).
Place of birth for U.S.-born residents:
This state: 5,384
Northeast: 53
Midwest: 84
South: 205
West: 163
60% of the 48422 zip code residents lived in the same house 5 years ago. Out of people who lived in different houses, 53% lived in this county. Out of people who lived in different counties, 50% lived in Michigan.
94% of the 48422 zip code residents lived in the same house 1 year ago. Out of people who lived in different houses, 78% moved from this county. Out of people who lived in different houses, 16% moved from different county within same state. Out of people who lived in different houses, 6% moved from different state.
Private vs. public school enrollment:
Students in private schools in grades 1 to 8 (elementary and middle school): 12
Here:
2.5%
Michigan:
12.4%
Students in private schools in grades 9 to 12 (high school): 17
Here:
4.4%
Michigan:
9.8%
Students in private undergraduate colleges: 11
Here:
9.5%
Michigan:
14.9%
Occupation by median earnings in the past 12 months ($)
71,599Health diagnosing and treating practitioners and other technical occupations
71,122Management occupations
59,567Architecture and engineering occupations
49,847Health technologists and technicians
47,424Construction and extraction occupations
46,913Transportation occupations
Companies with federal contracts located in this zip code:
COTTERMAN COMPANY (130 SELTZER ROAD in CROSWELL, MI; small business) : $13,441 in 2 contractsin 2004
$10,104 with Navy for Knobs and Pointers. Signed on 2004-11-10. Completion date: 2004-12-01.
$3,337 with Army for Miscellaneous Maintenance and Repair Shop Specialized Equipment. Signed on 2004-08-24. Completion date: 2004-09-24.
Top industries in this zip code by the number of employees in 2005:
Accommodation and Food Services: Limited-Service Restaurants (20-49: 1, 10-19: 1)
Health Care and Social Assistance: Residential Mental Retardation Facilities (20-49: 1, 5-9: 1)
People in group quarters in 2010:
6 people in group homes intended for adults
6 people in residential treatment centers for adults
5 people in workers' group living quarters and job corps centers
People in group quarters in 2000:
21 people in homes for the mentally retarded
5 people in other group homes
Fatal accident statistics in 2014:
Fatal accident count: 4
Vehicles involved in fatal accidents: 6
Fatal accidents caused by drunken drivers: 3
Fatalities: 5
Persons involved in fatal accidents: 9
Pedestrians involved in fatal accidents: 0
Fatal accident statistics in 2011:
Fatal accident count: 1
Vehicles involved in fatal accidents: 1
Fatal accidents caused by drunken drivers: 0
Fatalities: 1
Persons involved in fatal accidents: 3
Pedestrians involved in fatal accidents: 1
2002 - 2018 National Fire Incident Reporting System (NFIRS) incidents
According to the data from the years 2002 - 2018 the average number of fires per year is 17. The highest number of fires - 36 took place in 2007, and the least - 4 in 2011. The data has a dropping trend.
When looking into fire subcategories, the most reports belonged to: Structure Fires (52.4%), and Outside Fires (26.9%).
Fire incident types reported to NFIRS in Zip Code 48422


 Nearest zip codes: 48401, 48450, 48032, 48466, 48454, 48419.


 According to the data from the years 2002 - 2018 the average number of fires per year is 17. The highest number of fires - 36 took place in 2007, and the least - 4 in 2011. The data has a dropping trend.
 When looking into fire subcategories, the most reports belonged to: Structure Fires (52.4%), and Outside Fires (26.9%).