Sanilac County, Michigan (MI)
County owner-occupied free and clear houses and condos in 2010: 5,820
County owner-occupied houses and condos in 2000: 13,812
Renter-occupied apartments: 3,393 (it was 3,059 in 2000)
| % of renters here: | 18% |
| State: | 28% |
Land area: 964 sq. mi.
Water area: 626.4 sq. mi.
Population density: 42 people per square mile (average).
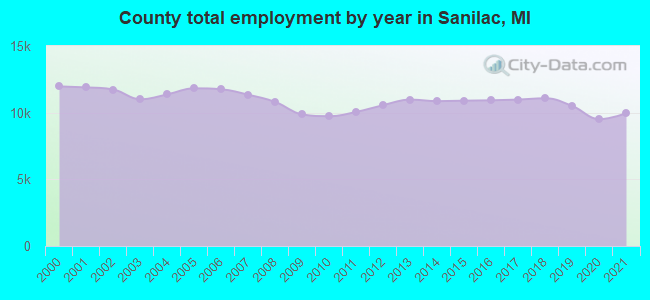
Industries providing employment: Manufacturing (22.3%), Educational, health and social services (18.6%), Retail trade (10.7%).
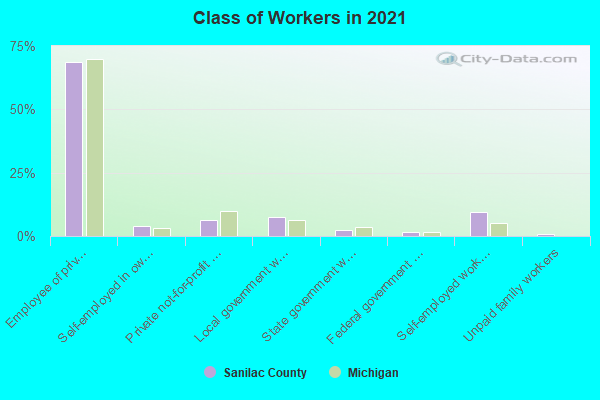
Type of workers:
- Private wage or salary: 78%
- Government: 12%
- Self-employed, not incorporated: 9%
- Unpaid family work: 0%
- OSM Map
- General Map
- Google Map
- MSN Map

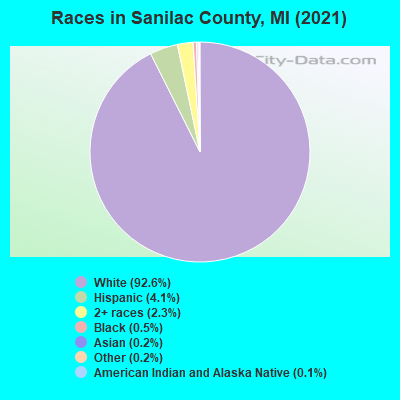
- 37,36492.3%White Non-Hispanic Alone
- 1,7194.2%Hispanic or Latino
- 1,0282.5%Two or more races
- 1680.4%Black Non-Hispanic Alone
- 830.2%Asian alone
- 770.2%Some other race alone
- 380.09%American Indian and Alaska Native alone
| Median resident age: | 45.7 years |
| Michigan median age: | 40.3 years |
| Males: 20,544 | |
| Females: 20,118 |

 | Michigan population changes: ups and downs (14 replies) |
| Michigan pop estimates by region 2015 (21 replies) |
| Detroit's 2010 population to be released this week. (80 replies) |
| Will MI make a come back in the next couple of years? (15 replies) |
| Searching for a good place to live? Try Michigan. (68 replies) |
| Im in need of info on living in a home on section 8 with mold.. (14 replies) |
| Sanilac County: | 2.0 people |
| Michigan: | 2 people |
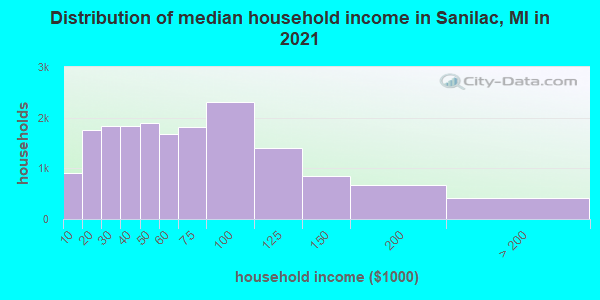
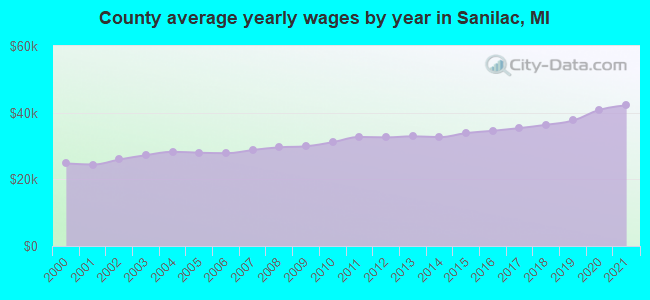
Estimated median household income in 2022: $54,504 ($36,870 in 1999)
| This county: | $54,504 |
| Michigan: | $66,986 |
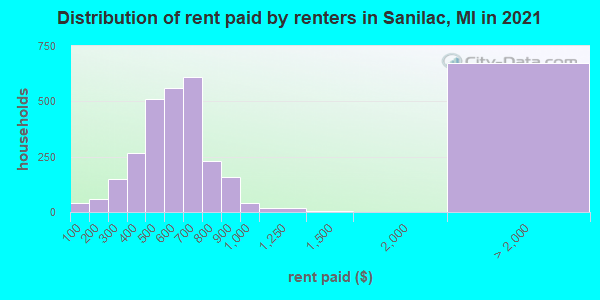
Median contract rent in 2022 for apartments: $589 (lower quartile is $476, upper quartile is $733)
| This county: | $589 |
| State: | $865 |
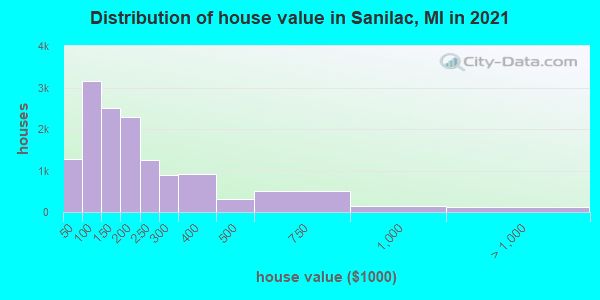
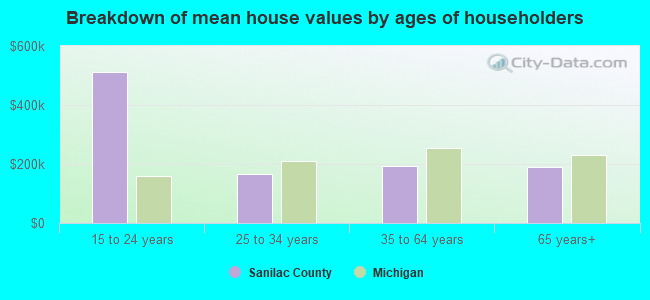
Estimated median house or condo value in 2022: $166,598 (it was $91,000 in 2000)
| Sanilac: | $166,598 |
| Michigan: | $224,400 |
Mean price in 2022:
Median monthly housing costs for homes and condos with a mortgage: $1,118Detached houses: $218,217
Here: $218,217 State: $280,038 Townhouses or other attached units: $163,518
Here: $163,518 State: $239,520 In 2-unit structures: $109,711
Here: $109,711 State: $219,481 In 3-to-4-unit structures: $228,644
Here: $228,644 State: $207,067 In 5-or-more-unit structures: $231,034
Here: $231,034 State: $192,733 Mobile homes: $119,827
Here: $119,827 State: $72,868 Occupied boats, RVs, vans, etc.: $35,033
Here: $35,033 State: $102,281
Median monthly housing costs for units without a mortgage: $453
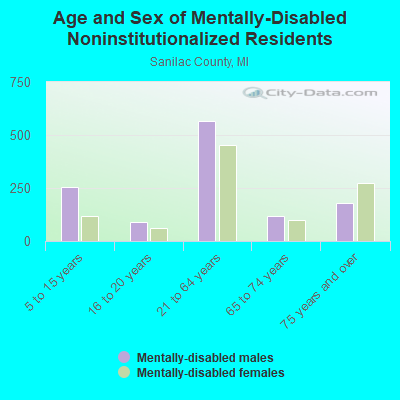
Institutionalized population: 311
Crime in 2021 (reported by the sheriff's office or county police, not the county total):
- Murders: 1
- Rapes: 13
- Robberies: 0
- Assaults: 11
- Burglaries: 16
- Thefts: 46
- Auto thefts: 14
Crime in 2020 (reported by the sheriff's office or county police, not the county total):
- Murders: 0
- Rapes: 13
- Robberies: 1
- Assaults: 23
- Burglaries: 23
- Thefts: 41
- Auto thefts: 9
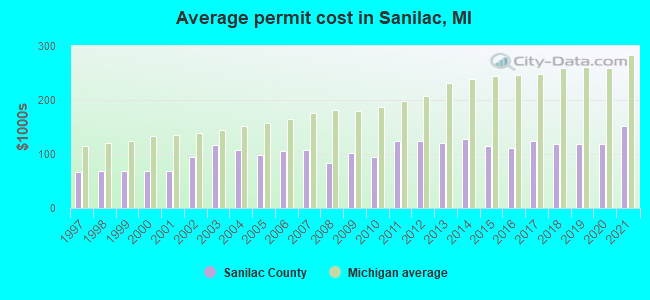
Single-family new house construction building permits:
- 2022: 81 buildings, average cost: $160,700
- 2021: 60 buildings, average cost: $150,500
- 2020: 37 buildings, average cost: $118,600
- 2019: 33 buildings, average cost: $118,600
- 2018: 42 buildings, average cost: $118,900
- 2017: 51 buildings, average cost: $123,600
- 2016: 39 buildings, average cost: $112,400
- 2015: 38 buildings, average cost: $114,900
- 2014: 39 buildings, average cost: $128,400
- 2013: 33 buildings, average cost: $120,000
- 2012: 16 buildings, average cost: $124,100
- 2011: 30 buildings, average cost: $124,700
- 2010: 23 buildings, average cost: $95,300
- 2009: 28 buildings, average cost: $100,500
- 2008: 29 buildings, average cost: $83,700
- 2007: 69 buildings, average cost: $108,100
- 2006: 93 buildings, average cost: $105,100
- 2005: 91 buildings, average cost: $98,300
- 2004: 115 buildings, average cost: $108,300
- 2003: 126 buildings, average cost: $117,300
- 2002: 103 buildings, average cost: $93,700
- 2001: 218 buildings, average cost: $67,500
- 2000: 226 buildings, average cost: $67,500
- 1999: 231 buildings, average cost: $67,500
- 1998: 229 buildings, average cost: $67,500
- 1997: 203 buildings, average cost: $67,400

Median real estate property taxes paid for housing units with mortgages in 2022: $1,529 (0.9%)
Median real estate property taxes paid for housing units with no mortgage in 2022: $1,402 (0.9%)
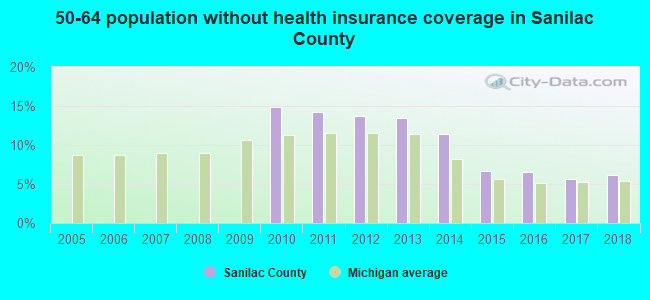
| Sanilac County: | 15.2% |
| Michigan: | 13.4% |
Median age of residents in 2022: 45.7 years old
(Males: 44.9 years old, Females: 46.5 years old)
(Median age for: White residents: 46.8 years old, Black residents: 44.1 years old, American Indian residents: 53.9 years old, Asian residents: 53.8 years old, Hispanic or Latino residents: 30.7 years old, Other race residents: 44.5 years old)
Fair market rent in 2006 for a 1-bedroom apartment in Sanilac County is $452 a month.
Fair market rent for a 2-bedroom apartment is $503 a month.
Fair market rent for a 3-bedroom apartment is $708 a month.
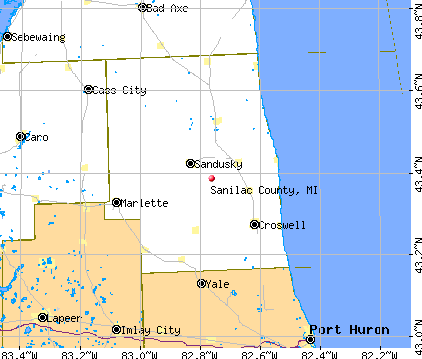
Cities in this county include: Sandusky, Croswell, Marlette, Brown City, Lexington, Deckerville, Port Sanilac, Peck, Carsonville, Snover.
| Here: | 4.3% |
| Michigan: | 3.5% |
Current college students: 1,231
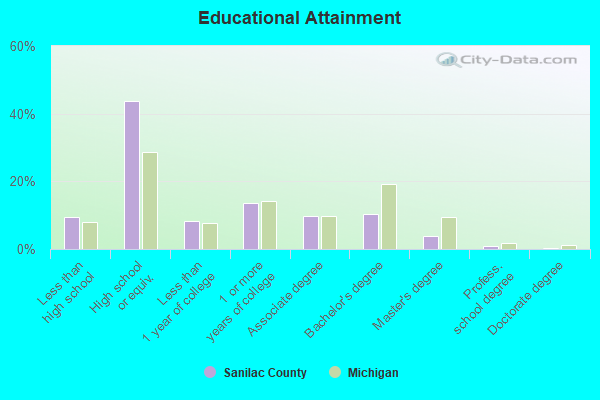
People 25 years of age or older with a high school degree or higher: 90.9%
People 25 years of age or older with a bachelor's degree or higher: 15.3%
Number of foreign born residents: 577 (48.6% naturalized citizens)
| Sanilac County: | 1.4% |
| Whole state: | 6.9% |
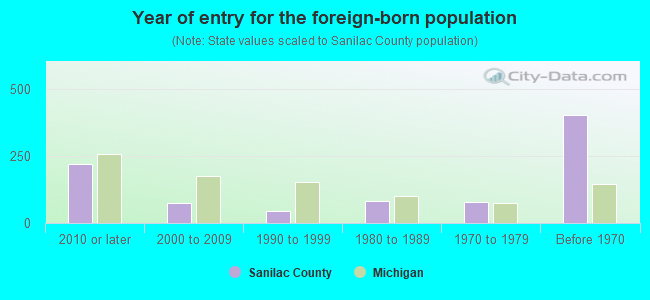
- Year of entry for the foreign-born population
- 2482010 or later
- 402000 to 2009
- 471990 to 1999
- 831980 to 1989
- 791970 to 1979
- 402Before 1970
Mean travel time to work (commute): minutes
Percentage of county residents living and working in this county: 99.9%
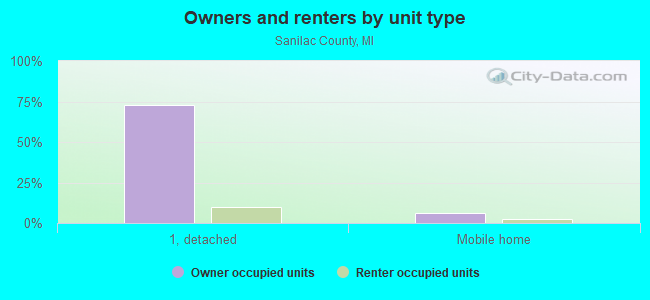
Housing units in structures:
- One, detached: 17,756
- One, attached: 261
- Two: 272
- 3 or 4: 248
- 5 to 9: 442
- 10 to 19: 313
- 20 to 49: 278
- 50 or more: 47
- Mobile homes: 2,217
- Boats, RVs, vans, etc.: 23
Housing units in Sanilac County with a mortgage: 6,968 (407 second mortgage, 13 home equity loan, 316 both second mortgage and home equity loan)
Houses without a mortgage: 148
| Here: | 3.9% with mortgage |
| State: | 96.7% with mortgage |
Religion statistics for Sanilac County
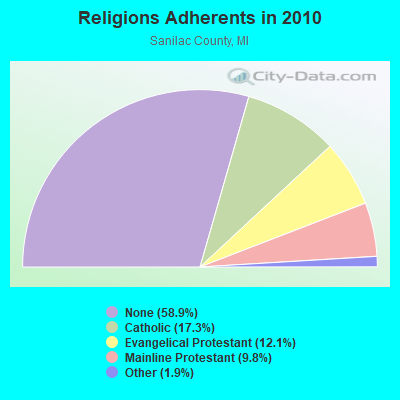
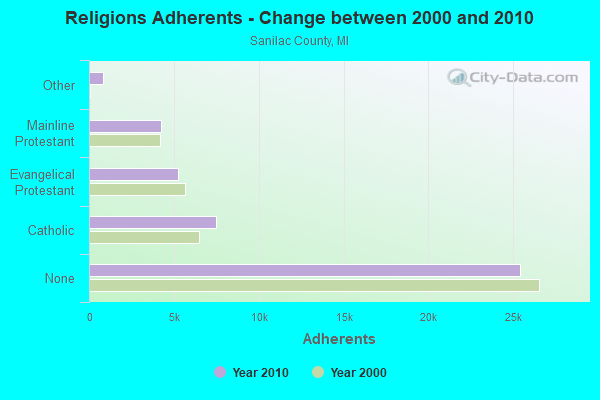
| Religion | Adherents | Congregations |
|---|---|---|
| Catholic | 7,460 | 10 |
| Evangelical Protestant | 5,233 | 40 |
| Mainline Protestant | 4,222 | 31 |
| Other | 813 | 7 |
| None | 25,386 | - |
Source: Clifford Grammich, Kirk Hadaway, Richard Houseal, Dale E.Jones, Alexei Krindatch, Richie Stanley and Richard H.Taylor. 2012. 2010 U.S.Religion Census: Religious Congregations & Membership Study. Association of Statisticians of American Religious Bodies. Jones, Dale E., et al. 2002. Congregations and Membership in the United States 2000. Nashville, TN: Glenmary Research Center.
Food Environment Statistics:
| Sanilac County: | 2.99 / 10,000 pop. |
| State: | 2.34 / 10,000 pop. |
| Here: | 0.23 / 10,000 pop. |
| Michigan: | 0.18 / 10,000 pop. |
| This county: | 2.76 / 10,000 pop. |
| Michigan: | 1.52 / 10,000 pop. |
| Sanilac County: | 4.37 / 10,000 pop. |
| Michigan: | 2.99 / 10,000 pop. |
| This county: | 6.20 / 10,000 pop. |
| State: | 6.80 / 10,000 pop. |
| Sanilac County: | 9.7% |
| Michigan: | 9.7% |
| Sanilac County: | 30.9% |
| State: | 29.7% |
| Here: | 10.5% |
| State: | 13.4% |
Agriculture in Sanilac County:
Average size of farms: 273 acresAverage value of agricultural products sold per farm: $85,826
Average value of crops sold per acre for harvested cropland: $225.73
The value of nursery, greenhouse, floriculture, and sod as a percentage of the total market value of agricultural products sold: 2.77%
The value of livestock, poultry, and their products as a percentage of the total market value of agricultural products sold: 43.83%
Average total farm production expenses per farm: $70,373
Harvested cropland as a percentage of land in farms: 78.36%
Irrigated harvested cropland as a percentage of land in farms: 0.34%
Average market value of all machinery and equipment per farm: $128,298
The percentage of farms operated by a family or individual: 90.53%
Average age of principal farm operators: 54 years
Average number of cattle and calves per 100 acres of all land in farms: 13.05
Milk cows as a percentage of all cattle and calves: 35.42%
Corn for grain: 78403 harvested acres
All wheat for grain: 34100 harvested acres
Soybeans for beans: 125267 harvested acres
Vegetables: 259 harvested acres
Land in orchards: 147 acres
Earthquake activity:
Sanilac County-area historical earthquake activity is significantly above Michigan state average. It is 61% smaller than the overall U.S. average.On 9/25/1998 at 19:52:52, a magnitude 5.2 (4.8 MB, 4.3 MS, 5.2 LG, 4.5 MW, Depth: 3.1 mi, Class: Moderate, Intensity: VI - VII) earthquake occurred 178.2 miles away from Sanilac County center
On 1/31/1986 at 16:46:43, a magnitude 5.0 (5.0 MB) earthquake occurred 147.9 miles away from the county center
On 7/12/1986 at 08:19:37, a magnitude 4.5 (4.5 MB, Class: Light, Intensity: IV - V) earthquake occurred 213.5 miles away from the county center
On 5/2/2015 at 16:23:07, a magnitude 4.2 (4.2 MW, Depth: 2.8 mi) earthquake occurred 156.7 miles away from the county center
On 6/10/2019 at 14:50:45, a magnitude 4.0 (4.0 MB, Depth: 1.2 mi) earthquake occurred 135.4 miles away from Sanilac County center
On 8/23/2011 at 17:51:04, a magnitude 5.8 (5.8 MW, Depth: 3.7 mi) earthquake occurred 455.4 miles away from the county center
Magnitude types: regional Lg-wave magnitude (LG), body-wave magnitude (MB), surface-wave magnitude (MS), moment magnitude (MW)
Most recent natural disasters:
- Michigan Covid-19 Pandemic, Incident Period: January 20, 2020, FEMA Id: 4494, Natural disaster type: Other
- Michigan Hurricane Katrina Evacuation, Incident Period: August 29, 2005 to October 01, 2005, Emergency Declared EM-3225: September 07, 2005, FEMA Id: 3225, Natural disaster type: Hurricane
- Michigan Severe Storms, Tornadoes and Flooding, Incident Period: May 20, 2004 to June 08, 2004, Major Disaster (Presidential) Declared DR-1527: June 30, 2004, FEMA Id: 1527, Natural disaster type: Storm, Tornado, Flood
- Michigan Severe Winter Storm, Incident Period: December 11, 2000 to December 31, 2000, Emergency Declared EM-3160: January 10, 2001, FEMA Id: 3160, Natural disaster type: Winter Storm
- Michigan Flooding, Incident Period: June 21, 1996 to July 01, 1996, Major Disaster (Presidential) Declared DR-1128: July 23, 1996, FEMA Id: 1128, Natural disaster type: Flood
- Michigan SEVERE STORMS, FLOODING, Incident Period: September 10, 1986 to October 10, 1986, Major Disaster (Presidential) Declared DR-774: September 18, 1986, FEMA Id: 774, Natural disaster type: Storm, Flood
- Michigan SEVERE STORMS AND FLOODING, Incident Period: September 05, 1985 to September 28, 1985, Major Disaster (Presidential) Declared DR-744: September 18, 1985, FEMA Id: 744, Natural disaster type: Storm, Flood
- Michigan Blizzards and Snowstorms, Incident Period: January 27, 1978, Emergency Declared EM-3057: January 27, 1978, FEMA Id: 3057, Natural disaster type: Snowstorm, Blizzard
- Michigan Snowstorms, Incident Period: February 05, 1977, Emergency Declared EM-3030: February 05, 1977, FEMA Id: 3030, Natural disaster type: Snowstorm
- Michigan Severe Storms, Tornadoes, Icing, Flooding, Incident Period: March 19, 1976, Major Disaster (Presidential) Declared DR-495: March 19, 1976, FEMA Id: 495, Natural disaster type: Storm, Tornado, Flood
- 1 other natural disasters have been reported since 1953.
The number of natural disasters in Sanilac County (11) is smaller than the US average (15).
Major Disasters (Presidential) Declared: 6
Emergencies Declared: 4
Causes of natural disasters: Floods: 6, Storms: 5, Snowstorms: 2, Tornadoes: 2, Blizzard: 1, Hurricane: 1, Winter Storm: 1, Other: 1 (Note: some incidents may be assigned to more than one category).
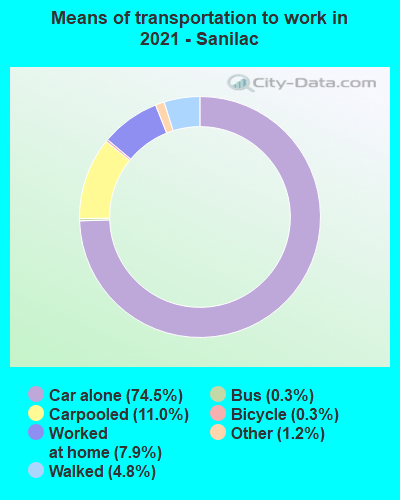
Means of transportation to work:
- Drove a car alone: 10,321 (71.1%)
- Carpooled: 1,539 (10.6%)
- Bus: 24 (0.2%)
- Subway or elevated rail: 1 (0.0%)
- Ferryboat: 6 (0.0%)
- Taxicab, motorcycle, or other means: 201 (1.4%)
- Bicycle: 37 (0.3%)
- Walked: 648 (4.5%)
- Worked at home: 1,686 (11.6%)

- Health care and social assistance (21%)
- Manufacturing (12%)
- Retail trade (10%)
- Accommodation and food services (8%)
- Educational services (7%)
- Public administration (5%)
- Finance and insurance (4%)
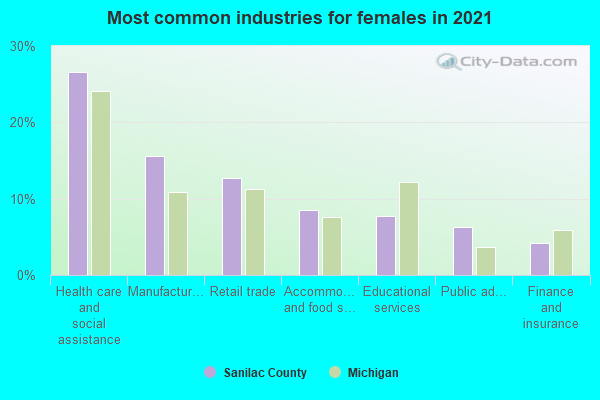
- Health care and social assistance (26%)
- Manufacturing (14%)
- Retail trade (13%)
- Accommodation and food services (10%)
- Educational services (8%)
- Public administration (7%)
- Finance and insurance (4%)
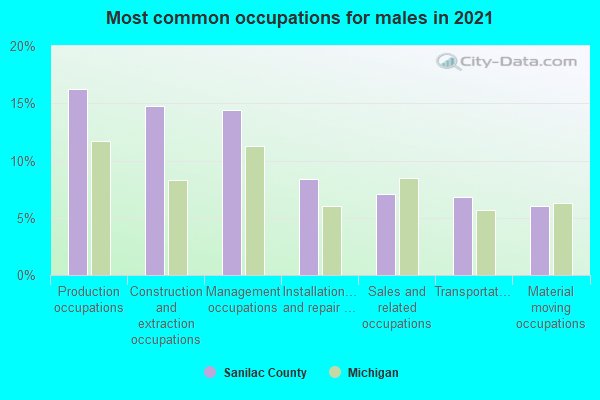
- Production occupations (18%)
- Management occupations (15%)
- Construction and extraction occupations (14%)
- Installation, maintenance, and repair occupations (8%)
- Sales and related occupations (7%)
- Transportation occupations (6%)
- Material moving occupations (5%)
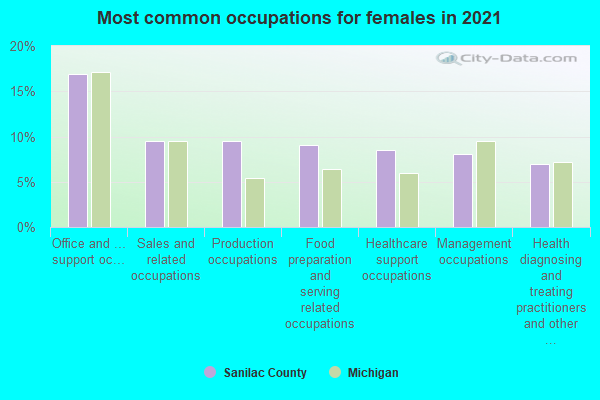
- Office and administrative support occupations (18%)
- Management occupations (10%)
- Sales and related occupations (10%)
- Food preparation and serving related occupations (9%)
- Production occupations (9%)
- Healthcare support occupations (8%)
- Educational instruction, and library occupations (6%)
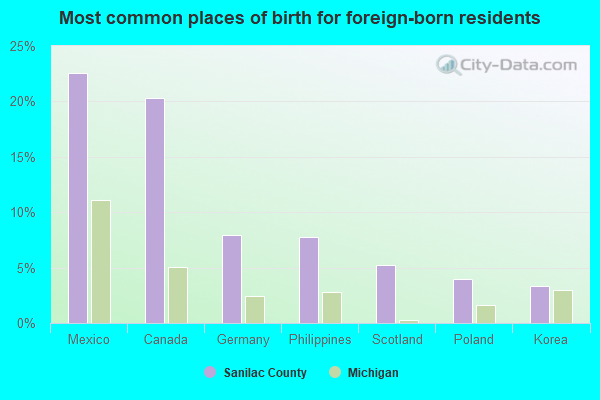
- Mexico (27%)
- Canada (20%)
- Scotland (6%)
- Philippines (5%)
- Iraq (3%)
- Korea (3%)
- Ireland (3%)
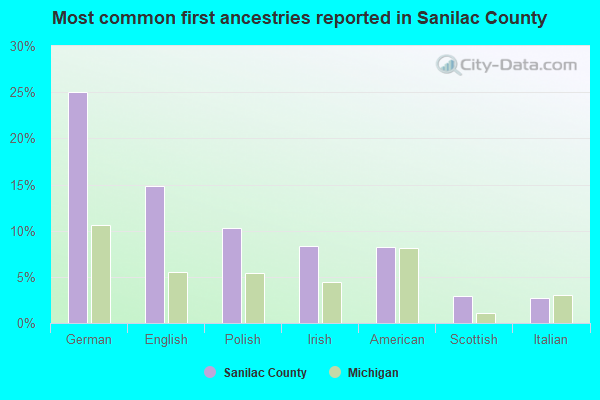
- German (25%)
- English (14%)
- Polish (10%)
- American (10%)
- Irish (9%)
- Italian (3%)
- Scottish (3%)
People in group quarters in Sanilac County, Michigan in 2010:
- 219 people in group homes intended for adults
- 169 people in nursing facilities/skilled-nursing facilities
- 94 people in local jails and other municipal confinement facilities
- 42 people in mental (psychiatric) hospitals and psychiatric units in other hospitals
- 26 people in workers' group living quarters and job corps centers
- 6 people in in-patient hospice facilities
- 6 people in residential treatment centers for adults
- 4 people in other noninstitutional facilities
People in group quarters in Sanilac County, Michigan in 2000:
- 241 people in nursing homes
- 124 people in unknown juvenile institutions
- 120 people in other group homes
- 90 people in local jails and other confinement facilities (including police lockups)
- 76 people in homes for the mentally retarded
- 69 people in other noninstitutional group quarters
- 24 people in agriculture workers' dormitories on farms
- 12 people in homes for the mentally ill
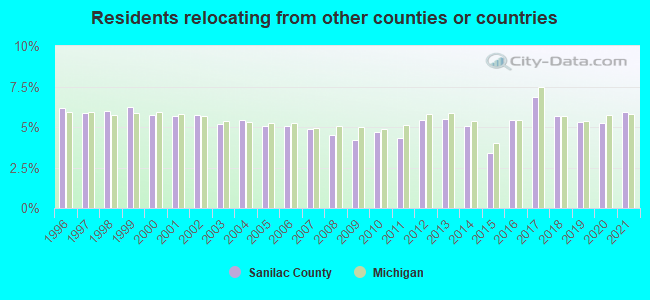
5.92% of this county's 2021 resident taxpayers lived in other counties in 2020 ($60,622 average adjusted gross income)
| Here: | 5.92% |
| Michigan average: | 5.83% |
10 or fewer of this county's residents moved from foreign countries.
5.04% relocated from other counties in Michigan ($54,132 average AGI)
0.88% relocated from other states ($6,491 average AGI)
Sanilac County: 0.88% Michigan average: 1.78%
Top counties from which taxpayers relocated into this county between 2020 and 2021:
| from St. Clair County, MI | |
| from Macomb County, MI | |
| from Lapeer County, MI | |
| from Tuscola County, MI | |
| from Oakland County, MI | |
| from Huron County, MI | |
| from Wayne County, MI |
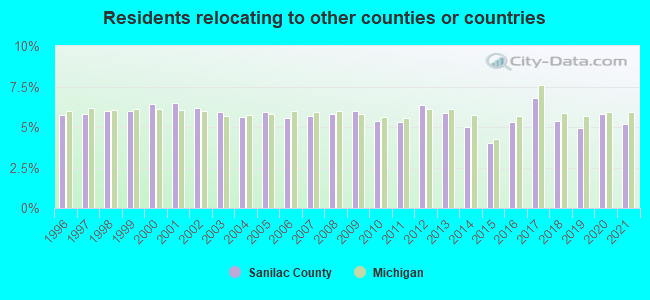
5.17% of this county's 2020 resident taxpayers moved to other counties in 2021 ($45,842 average adjusted gross income)
| Here: | 5.17% |
| Michigan average: | 5.95% |
10 or fewer of this county's residents moved to foreign countries.
4.16% relocated to other counties in Michigan ($34,967 average AGI)
1.01% relocated to other states ($10,876 average AGI)
Sanilac County: 1.01% Michigan average: 1.91%
Top counties to which taxpayers relocated from this county between 2020 and 2021:
| to St. Clair County, MI | |
| to Macomb County, MI | |
| to Tuscola County, MI | |
| to Lapeer County, MI | |
| to Huron County, MI | |
| to Oakland County, MI | |
| to Genesee County, MI |
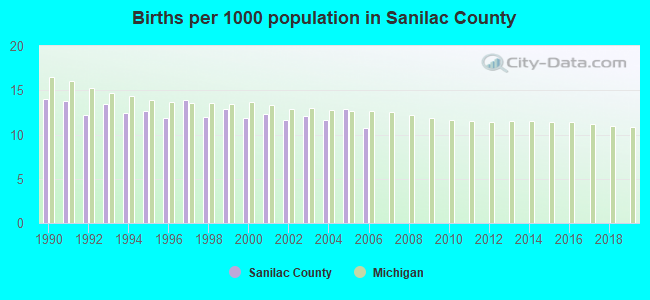
Births per 1000 population from 1990 to 1999: 12.9
Births per 1000 population from 2000 to 2006: 11.9
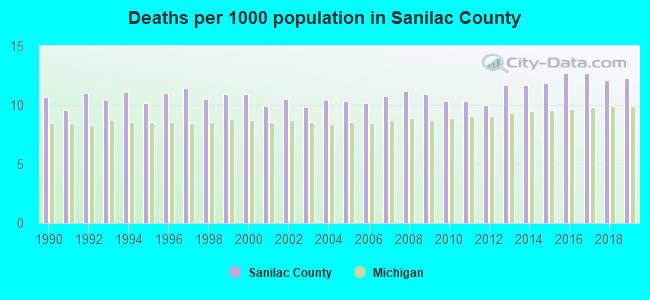
Deaths per 1000 population from 1990 to 1999: 10.7
Deaths per 1000 population from 2000 to 2009: 10.5
Deaths per 1000 population from 2010 to 2020: 11.8
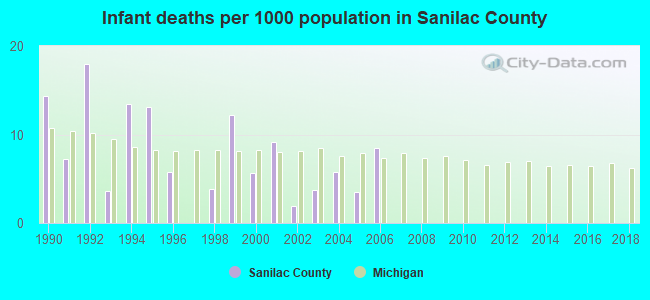
Infant deaths per 1000 live births from 1990 to 1999: 9.2
Infant deaths per 1000 live births from 2000 to 2006: 5.4
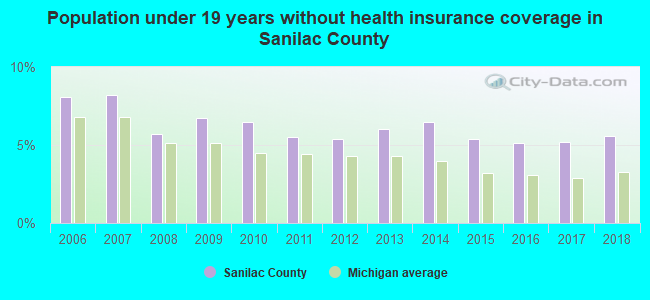
Persons under 19 years old without health insurance coverage in 2018: 5.6%
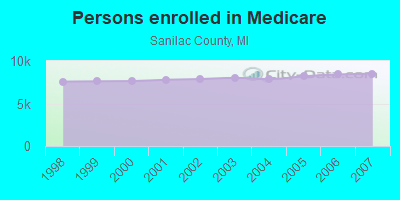
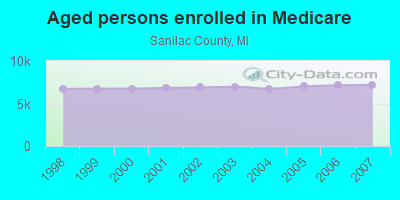
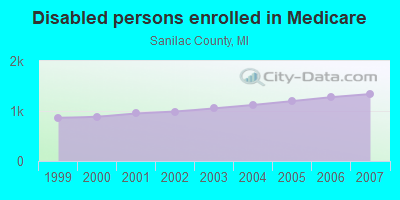
Persons enrolled in hospital insurance and/or supplemental medical insurance (Medicare) in July 1, 2007: 8,518 (7,179 aged, 1,339 disabled)
Children under 18 without health insurance coverage in 2007: 592 (6%)
Most common underlying causes of death in Sanilac County, Michigan in 1999 - 2019:
- Atherosclerotic heart disease (948)
- Acute myocardial infarction, unspecified (826)
- Bronchus or lung, unspecified - Malignant neoplasms (577)
- Chronic obstructive pulmonary disease, unspecified (469)
- Congestive heart failure (265)
- Stroke, not specified as haemorrhage or infarction (231)
- Alzheimer disease, unspecified (226)
- Atherosclerotic cardiovascular disease, so described (198)
- Unspecified diabetes mellitus, without complications (167)
- Unspecified dementia (158)
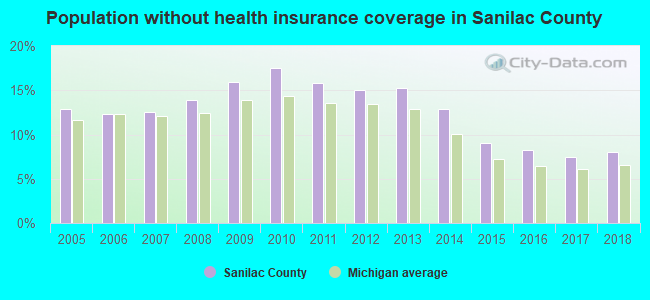
Population without health insurance coverage in 2000: 12%
Children under 18 without health insurance coverage in 2000: 9%
Short term general hospital admissions per 100,000 population in 2004: 4,687
Short term general hospital beds per 100,000 population in 2004: 292
Emergency room visits per 100,000 population in 2004: 32,040
General practice office based MDs per 100,000 population in 2005: 1,037
Medical specialist MDs per 100,000 population in 2005: 1,124
Dentists per 100,000 population in 1998: 9
Total births per 100,000 population, July 2005 - July 2006 : 33
Total deaths per 100,000 population, July 2005 - July 2006: 58
Limited-service eating places per 100,000 population in 2005 : 11
Suicides per 1,000,000 population from 2000 to 2006: 106.5. This is less than state average.
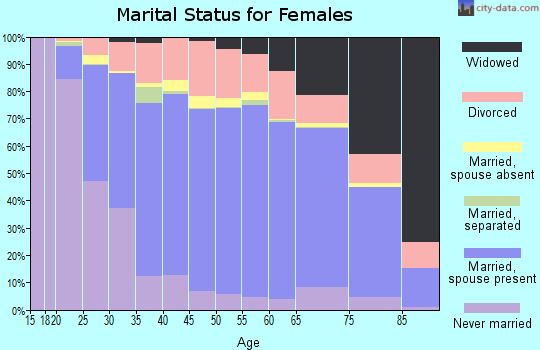
Household type by relationship:
Households: 40,662- Male householders: 9,068 (2,660 living alone), Female householders: 8,560 (2,633 living alone)
8,774 spouses (8,738 opposite-sex spouses), 1,580 unmarried partners, (1,566 opposite-sex unmarried partners), 10,163 children (9,587 natural, 152 adopted, 426 stepchildren), 689 grandchildren, 163 brothers or sisters, 184 parents, 22 foster children, 232 other relatives, 829 non-relatives
- In group quarters: 519
Size of family households: 5,926 2-persons, 2,112 3-persons, 1,969 4-persons, 694 5-persons, 373 6-persons, 266 7-or-more-persons.
Size of nonfamily households: 5,291 1-person, 863 2-persons, 112 3-persons, 20 4-persons, 8 5-persons, 9 6-persons.
5,113 married couples with children.
2,405 single-parent households (800 men, 1,605 women).
95.1% of residents of Sanilac speak English at home.
2.2% of residents speak Spanish at home (67% speak English very well, 14% speak English well, 16% speak English not well, 3% don't speak English at all).
2.4% of residents speak other Indo-European language at home (58% speak English very well, 35% speak English well, 6% speak English not well).
0.2% of residents speak Asian or Pacific Island language at home (88% speak English very well, 3% speak English well, 5% speak English not well, 4% don't speak English at all).
0.1% of residents speak other language at home (79% speak English very well, 21% speak English not well).
In fiscal year 2004:
Federal Government expenditure: $247,947,000 ($5,531 per capita)
Department of Defense expenditure: $11,583,000
Federal direct payments to individuals for retirement and disability: $111,919,000
Federal other direct payments to individuals: $60,659,000
Federal direct payments not to individuals: $13,406,000
Federal grants: $43,431,000
Federal procurement contracts: $11,196,000 ($9,416,000 Department of Defense)
Federal salaries and wages: $7,337,000 ($0,000 Department of Defense)
Federal Government direct loans: $6,685,000
Federal guaranteed/insured loans: $19,094,000
Federal Government insurance: $52,482,000
Population change from April 1, 2000 to July 1, 2005:
Births: 2,798| Here: | 63 per 1000 residents |
| State: | 68 per 1000 residents |
Deaths: 2,359
| Here: | 53 per 1000 residents |
| State: | 45 per 1000 residents |
Net international migration: +23
| Here: | +1 per 1000 residents |
| State: | +12 per 1000 residents |
Net internal migration: -185
| Here: | |
| State: |
Total withdrawal of fresh water for public supply: 1.79 millions of gallons per day (92% from ground, 8% from surface)
| Here: | 6.3 |
| State: | 6.5 |
| Here: | 4.6 |
| State: | 4.3 |
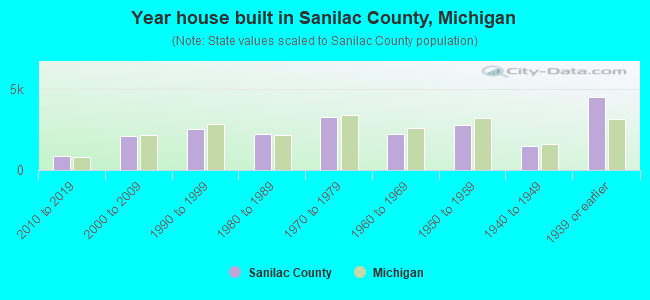
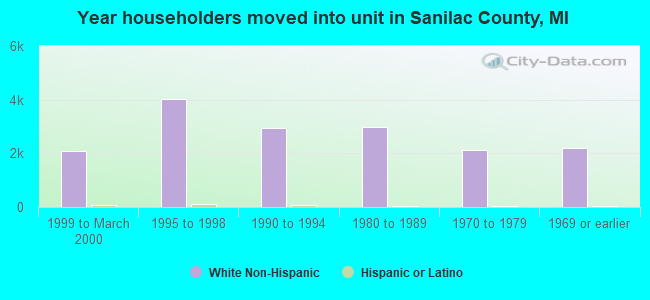
- Year house built in Sanilac County, Michigan
- 252020 or later
- 9452010 to 2019
- 1,9432000 to 2009
- 2,5151990 to 1999
- 2,2081980 to 1989
- 3,3141970 to 1979
- 2,0181960 to 1969
- 2,7511950 to 1959
- 1,5881940 to 1949
- 4,4141939 or earlier
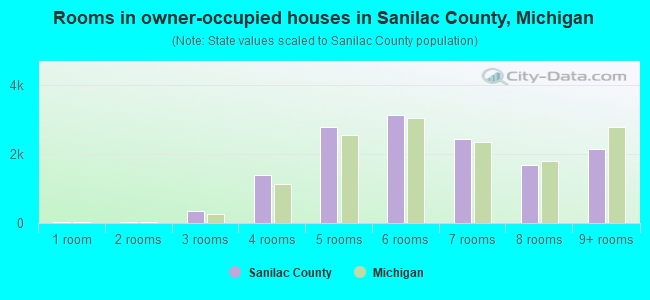
- Rooms in owner-occupied houses in Sanilac County, Michigan
- 251 room
- 332 rooms
- 3503 rooms
- 1,3954 rooms
- 2,8575 rooms
- 3,0776 rooms
- 2,4107 rooms
- 1,8008 rooms
- 2,2389+ rooms
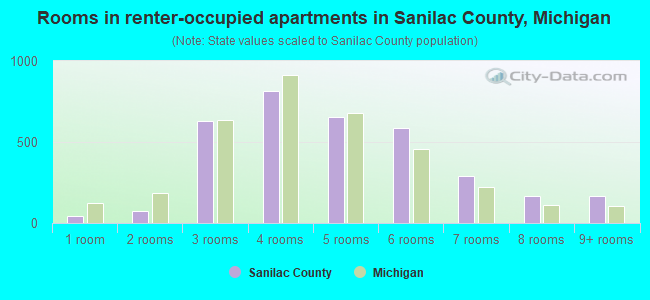
- Rooms in renter-occupied apartments in Sanilac County, Michigan
- 431 room
- 862 rooms
- 6733 rooms
- 8154 rooms
- 6495 rooms
- 5716 rooms
- 2797 rooms
- 1918 rooms
- 1849+ rooms
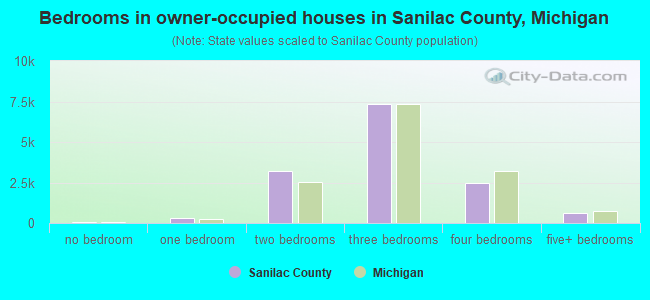
- Bedrooms in owner-occupied houses in Sanilac County, Michigan
- 52no bedroom
- 3261 bedroom
- 2,9342 bedrooms
- 7,5923 bedrooms
- 2,6034 bedrooms
- 6785+ bedrooms
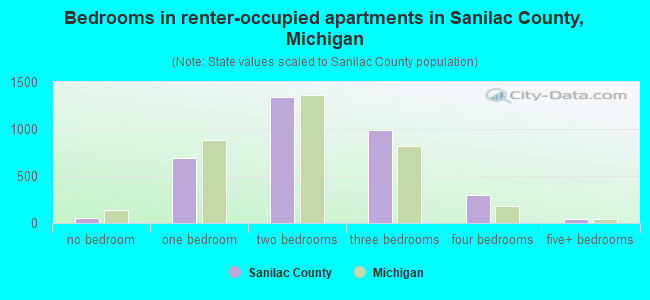
- Bedrooms in renter-occupied apartments in Sanilac County, Michigan
- 50no bedroom
- 7071 bedroom
- 1,3982 bedrooms
- 9523 bedrooms
- 3154 bedrooms
- 805+ bedrooms
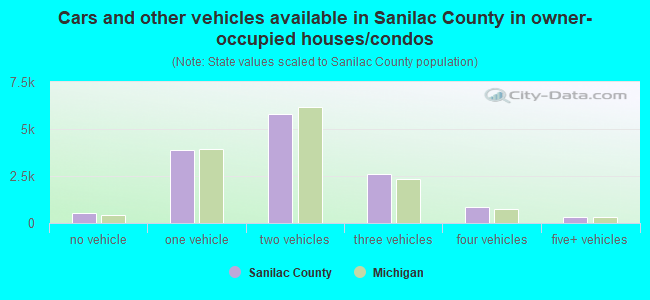
- Cars and other vehicles available in Sanilac County in owner-occupied houses/condos
- 515no vehicle
- 3,9561 vehicle
- 5,8362 vehicles
- 2,7363 vehicles
- 8034 vehicles
- 3265+ vehicles
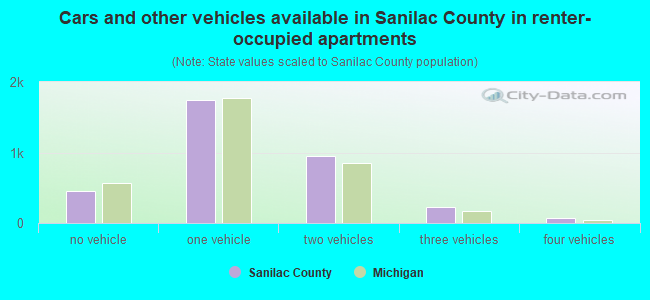
- Cars and other vehicles available in Sanilac County in renter-occupied apartments
- 502no vehicle
- 1,7881 vehicle
- 8782 vehicles
- 2363 vehicles
- 834 vehicles
- 45+ vehicles
89.9% of Sanilac County residents lived in the same house 1 years ago.
Out of people who lived in different houses, 37% lived in this county.
Out of people who lived in different counties, 87% lived in Michigan.
| Sanilac County: | 89.9% |
| State average: | 88.4% |
Place of birth for U.S.-born residents:
- This state: 36,058
- Other state: 3,617
- Northeast: 519
- Midwest: 1,286
- South: 1,221
- West: 592
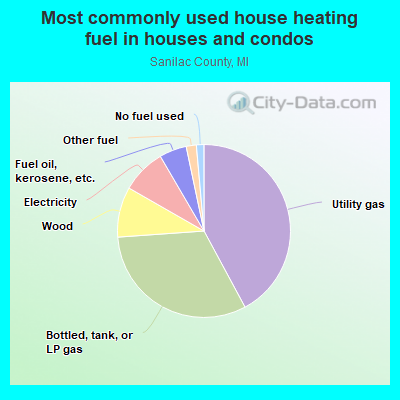
- 42.8%Utility gas
- 32.7%Bottled, tank, or LP gas
- 9.0%Wood
- 8.3%Electricity
- 4.8%Fuel oil, kerosene, etc.
- 1.5%Other fuel
- 1.0%No fuel used
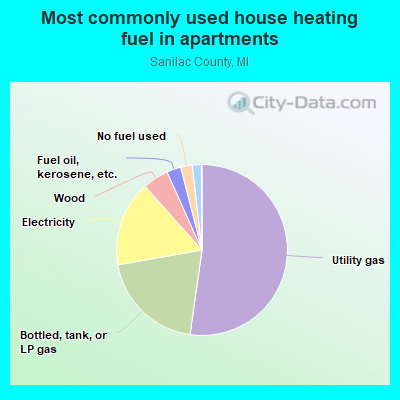
- 52.9%Utility gas
- 17.7%Bottled, tank, or LP gas
- 17.0%Electricity
- 4.5%Wood
- 2.9%Fuel oil, kerosene, etc.
- 2.5%Other fuel
- 2.4%No fuel used
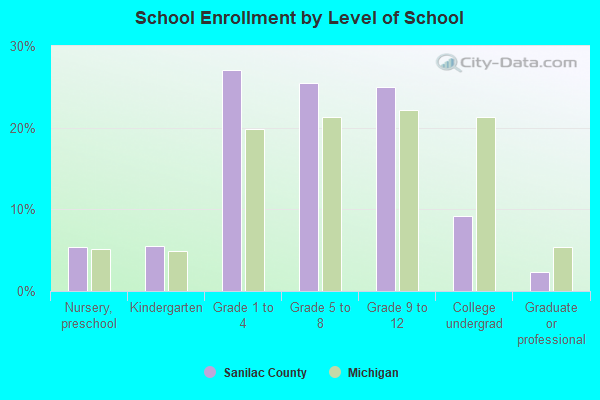
Private vs. public school enrollment:
| Here: | 14.8% |
| Michigan: | 12.4% |
| Here: | 6.4% |
| Michigan: | 9.8% |
| Here: | 19.7% |
| Michigan: | 14.9% |

Sanilac County government finances - Expenditure in 2020:
- Bond Funds - Cash and Securities: $2,441,000
- Charges - Other: $44,227,000
Other: $16,956,000
Regular Highways: $2,111,000
Regular Highways: $1,412,000
Parks and Recreation: $660,000
Parks and Recreation: $475,000
- Current Operations - Health - Other: $32,347,000
Regular Highways: $19,312,000
Regular Highways: $17,663,000
Health - Other: $14,137,000
General - Other: $11,727,000
Sewerage: $5,566,000
Police Protection: $5,423,000
Police Protection: $4,812,000
Judicial and Legal Services: $3,691,000
General - Other: $2,655,000
Judicial and Legal Services: $2,479,000
Transit Utilities: $1,789,000
Transit Utilities: $1,533,000
Public Welfare Institutions: $1,446,000
Financial Administration: $889,000
Parks and Recreation: $721,000
Central Staff Services: $713,000
Parks and Recreation: $709,000
Central Staff Services: $658,000
Financial Administration: $655,000
Public Welfare - Other: $649,000
General Public Buildings: $455,000
Public Welfare - Other: $418,000
Water Utilities: $359,000
Libraries: $315,000
Libraries: $300,000
General Public Buildings: $297,000
Protective Inspection and Regulation - Other: $272,000
Natural Resources - Other: $146,000
Solid Waste Management: $133,000
Housing and Community Development: $99,000
Correctional Institutions: $79,000
Correctional Institutions: $33,000
Corrections - Other: $1,000
- Federal Intergovernmental - Other: $7,348,000
Other: $1,414,000
Health and Hospitals: $466,000
Housing and Community Development: $99,000
- General - Interest on Debt: $700,000
Interest on Debt: $574,000
- Local Intergovernmental - Highways: $1,908,000
Other: $1,862,000
Other: $243,000
- Long Term Debt - Outstanding Unspecified Public Purpose: $33,180,000
Beginning Outstanding - Unspecified Public Purpose: $28,455,000
Beginning Outstanding - Unspecified Public Purpose: $19,548,000
Outstanding Unspecified Public Purpose: $18,569,000
Issue, Unspecified Public Purpose: $7,196,000
Beginning Outstanding - Public Debt for Private Purpose: $5,486,000
Outstanding Nonguaranteed - Industrial Revenue: $4,843,000
Retired Unspecified Public Purpose: $2,470,000
Retired Unspecified Public Purpose: $979,000
Retired Nonguaranteed - Public Debt for Private Purpose: $643,000
- Miscellaneous - General Revenue - Other: $2,111,000
General Revenue - Other: $1,712,000
Interest Earnings: $473,000
Rents: $212,000
Interest Earnings: $188,000
Rents: $171,000
Fines and Forfeits: $157,000
Sale of Property: $113,000
Sale of Property: $108,000
Fines and Forfeits: $33,000
- Other Capital Outlay - General - Other: $1,572,000
Sewerage: $707,000
Parks and Recreation: $526,000
Police Protection: $212,000
General - Other: $200,000
Health - Other: $17,000
Water Utilities: $5,000
- Other Funds - Cash and Securities: $27,090,000
Cash and Securities: $19,471,000
- Sinking Funds - Cash and Securities: $4,843,000
- State Intergovernmental - Other: $8,925,000
Highways: $6,781,000
Highways: $5,530,000
General Local Government Support: $3,372,000
Other: $1,514,000
Health and Hospitals: $1,228,000
Health and Hospitals: $940,000
General Local Government Support: $919,000
- Tax - Property: $16,825,000
Property: $16,240,000
Other License: $317,000
Occupation and Business License - Other: $306,000
Other License: $181,000
Other Selective Sales: $22,000
- Total Salaries and Wages: $18,763,000
: $16,153,000
- Water Utilities - Interest on Debt: $323,000
Sanilac County government finances - Revenue in 2020:
- Bond Funds - Cash and Securities: $2,441,000
- Charges - Other: $44,227,000
Other: $16,956,000
Regular Highways: $2,111,000
Regular Highways: $1,412,000
Parks and Recreation: $660,000
Parks and Recreation: $475,000
- Current Operations - Health - Other: $32,347,000
Regular Highways: $19,312,000
Regular Highways: $17,663,000
Health - Other: $14,137,000
General - Other: $11,727,000
Sewerage: $5,566,000
Police Protection: $5,423,000
Police Protection: $4,812,000
Judicial and Legal Services: $3,691,000
General - Other: $2,655,000
Judicial and Legal Services: $2,479,000
Transit Utilities: $1,789,000
Transit Utilities: $1,533,000
Public Welfare Institutions: $1,446,000
Financial Administration: $889,000
Parks and Recreation: $721,000
Central Staff Services: $713,000
Parks and Recreation: $709,000
Central Staff Services: $658,000
Financial Administration: $655,000
Public Welfare - Other: $649,000
General Public Buildings: $455,000
Public Welfare - Other: $418,000
Water Utilities: $359,000
Libraries: $315,000
Libraries: $300,000
General Public Buildings: $297,000
Protective Inspection and Regulation - Other: $272,000
Natural Resources - Other: $146,000
Solid Waste Management: $133,000
Housing and Community Development: $99,000
Correctional Institutions: $79,000
Correctional Institutions: $33,000
Corrections - Other: $1,000
- Federal Intergovernmental - Other: $7,348,000
Other: $1,414,000
Health and Hospitals: $466,000
Housing and Community Development: $99,000
- General - Interest on Debt: $700,000
Interest on Debt: $574,000
- Local Intergovernmental - Highways: $1,908,000
Other: $1,862,000
Other: $243,000
- Long Term Debt - Outstanding Unspecified Public Purpose: $33,180,000
Beginning Outstanding - Unspecified Public Purpose: $28,455,000
Beginning Outstanding - Unspecified Public Purpose: $19,548,000
Outstanding Unspecified Public Purpose: $18,569,000
Issue, Unspecified Public Purpose: $7,196,000
Beginning Outstanding - Public Debt for Private Purpose: $5,486,000
Outstanding Nonguaranteed - Industrial Revenue: $4,843,000
Retired Unspecified Public Purpose: $2,470,000
Retired Unspecified Public Purpose: $979,000
Retired Nonguaranteed - Public Debt for Private Purpose: $643,000
- Miscellaneous - General Revenue - Other: $2,111,000
General Revenue - Other: $1,712,000
Interest Earnings: $473,000
Rents: $212,000
Interest Earnings: $188,000
Rents: $171,000
Fines and Forfeits: $157,000
Sale of Property: $113,000
Sale of Property: $108,000
Fines and Forfeits: $33,000
- Other Capital Outlay - General - Other: $1,572,000
Sewerage: $707,000
Parks and Recreation: $526,000
Police Protection: $212,000
General - Other: $200,000
Health - Other: $17,000
Water Utilities: $5,000
- Other Funds - Cash and Securities: $27,090,000
Cash and Securities: $19,471,000
- Sinking Funds - Cash and Securities: $4,843,000
- State Intergovernmental - Other: $8,925,000
Highways: $6,781,000
Highways: $5,530,000
General Local Government Support: $3,372,000
Other: $1,514,000
Health and Hospitals: $1,228,000
Health and Hospitals: $940,000
General Local Government Support: $919,000
- Tax - Property: $16,825,000
Property: $16,240,000
Other License: $317,000
Occupation and Business License - Other: $306,000
Other License: $181,000
Other Selective Sales: $22,000
- Total Salaries and Wages: $18,763,000
: $16,153,000
- Water Utilities - Interest on Debt: $323,000
Sanilac County government finances - Debt in 2020:
- Bond Funds - Cash and Securities: $2,441,000
- Charges - Other: $44,227,000
Other: $16,956,000
Regular Highways: $2,111,000
Regular Highways: $1,412,000
Parks and Recreation: $660,000
Parks and Recreation: $475,000
- Current Operations - Health - Other: $32,347,000
Regular Highways: $19,312,000
Regular Highways: $17,663,000
Health - Other: $14,137,000
General - Other: $11,727,000
Sewerage: $5,566,000
Police Protection: $5,423,000
Police Protection: $4,812,000
Judicial and Legal Services: $3,691,000
General - Other: $2,655,000
Judicial and Legal Services: $2,479,000
Transit Utilities: $1,789,000
Transit Utilities: $1,533,000
Public Welfare Institutions: $1,446,000
Financial Administration: $889,000
Parks and Recreation: $721,000
Central Staff Services: $713,000
Parks and Recreation: $709,000
Central Staff Services: $658,000
Financial Administration: $655,000
Public Welfare - Other: $649,000
General Public Buildings: $455,000
Public Welfare - Other: $418,000
Water Utilities: $359,000
Libraries: $315,000
Libraries: $300,000
General Public Buildings: $297,000
Protective Inspection and Regulation - Other: $272,000
Natural Resources - Other: $146,000
Solid Waste Management: $133,000
Housing and Community Development: $99,000
Correctional Institutions: $79,000
Correctional Institutions: $33,000
Corrections - Other: $1,000
- Federal Intergovernmental - Other: $7,348,000
Other: $1,414,000
Health and Hospitals: $466,000
Housing and Community Development: $99,000
- General - Interest on Debt: $700,000
Interest on Debt: $574,000
- Local Intergovernmental - Highways: $1,908,000
Other: $1,862,000
Other: $243,000
- Long Term Debt - Outstanding Unspecified Public Purpose: $33,180,000
Beginning Outstanding - Unspecified Public Purpose: $28,455,000
Beginning Outstanding - Unspecified Public Purpose: $19,548,000
Outstanding Unspecified Public Purpose: $18,569,000
Issue, Unspecified Public Purpose: $7,196,000
Beginning Outstanding - Public Debt for Private Purpose: $5,486,000
Outstanding Nonguaranteed - Industrial Revenue: $4,843,000
Retired Unspecified Public Purpose: $2,470,000
Retired Unspecified Public Purpose: $979,000
Retired Nonguaranteed - Public Debt for Private Purpose: $643,000
- Miscellaneous - General Revenue - Other: $2,111,000
General Revenue - Other: $1,712,000
Interest Earnings: $473,000
Rents: $212,000
Interest Earnings: $188,000
Rents: $171,000
Fines and Forfeits: $157,000
Sale of Property: $113,000
Sale of Property: $108,000
Fines and Forfeits: $33,000
- Other Capital Outlay - General - Other: $1,572,000
Sewerage: $707,000
Parks and Recreation: $526,000
Police Protection: $212,000
General - Other: $200,000
Health - Other: $17,000
Water Utilities: $5,000
- Other Funds - Cash and Securities: $27,090,000
Cash and Securities: $19,471,000
- Sinking Funds - Cash and Securities: $4,843,000
- State Intergovernmental - Other: $8,925,000
Highways: $6,781,000
Highways: $5,530,000
General Local Government Support: $3,372,000
Other: $1,514,000
Health and Hospitals: $1,228,000
Health and Hospitals: $940,000
General Local Government Support: $919,000
- Tax - Property: $16,825,000
Property: $16,240,000
Other License: $317,000
Occupation and Business License - Other: $306,000
Other License: $181,000
Other Selective Sales: $22,000
- Total Salaries and Wages: $18,763,000
: $16,153,000
- Water Utilities - Interest on Debt: $323,000
Sanilac County government finances - Cash and Securities in 2020:
- Bond Funds - Cash and Securities: $2,441,000
- Charges - Other: $44,227,000
Other: $16,956,000
Regular Highways: $2,111,000
Regular Highways: $1,412,000
Parks and Recreation: $660,000
Parks and Recreation: $475,000
- Current Operations - Health - Other: $32,347,000
Regular Highways: $19,312,000
Regular Highways: $17,663,000
Health - Other: $14,137,000
General - Other: $11,727,000
Sewerage: $5,566,000
Police Protection: $5,423,000
Police Protection: $4,812,000
Judicial and Legal Services: $3,691,000
General - Other: $2,655,000
Judicial and Legal Services: $2,479,000
Transit Utilities: $1,789,000
Transit Utilities: $1,533,000
Public Welfare Institutions: $1,446,000
Financial Administration: $889,000
Parks and Recreation: $721,000
Central Staff Services: $713,000
Parks and Recreation: $709,000
Central Staff Services: $658,000
Financial Administration: $655,000
Public Welfare - Other: $649,000
General Public Buildings: $455,000
Public Welfare - Other: $418,000
Water Utilities: $359,000
Libraries: $315,000
Libraries: $300,000
General Public Buildings: $297,000
Protective Inspection and Regulation - Other: $272,000
Natural Resources - Other: $146,000
Solid Waste Management: $133,000
Housing and Community Development: $99,000
Correctional Institutions: $79,000
Correctional Institutions: $33,000
Corrections - Other: $1,000
- Federal Intergovernmental - Other: $7,348,000
Other: $1,414,000
Health and Hospitals: $466,000
Housing and Community Development: $99,000
- General - Interest on Debt: $700,000
Interest on Debt: $574,000
- Local Intergovernmental - Highways: $1,908,000
Other: $1,862,000
Other: $243,000
- Long Term Debt - Outstanding Unspecified Public Purpose: $33,180,000
Beginning Outstanding - Unspecified Public Purpose: $28,455,000
Beginning Outstanding - Unspecified Public Purpose: $19,548,000
Outstanding Unspecified Public Purpose: $18,569,000
Issue, Unspecified Public Purpose: $7,196,000
Beginning Outstanding - Public Debt for Private Purpose: $5,486,000
Outstanding Nonguaranteed - Industrial Revenue: $4,843,000
Retired Unspecified Public Purpose: $2,470,000
Retired Unspecified Public Purpose: $979,000
Retired Nonguaranteed - Public Debt for Private Purpose: $643,000
- Miscellaneous - General Revenue - Other: $2,111,000
General Revenue - Other: $1,712,000
Interest Earnings: $473,000
Rents: $212,000
Interest Earnings: $188,000
Rents: $171,000
Fines and Forfeits: $157,000
Sale of Property: $113,000
Sale of Property: $108,000
Fines and Forfeits: $33,000
- Other Capital Outlay - General - Other: $1,572,000
Sewerage: $707,000
Parks and Recreation: $526,000
Police Protection: $212,000
General - Other: $200,000
Health - Other: $17,000
Water Utilities: $5,000
- Other Funds - Cash and Securities: $27,090,000
Cash and Securities: $19,471,000
- Sinking Funds - Cash and Securities: $4,843,000
- State Intergovernmental - Other: $8,925,000
Highways: $6,781,000
Highways: $5,530,000
General Local Government Support: $3,372,000
Other: $1,514,000
Health and Hospitals: $1,228,000
Health and Hospitals: $940,000
General Local Government Support: $919,000
- Tax - Property: $16,825,000
Property: $16,240,000
Other License: $317,000
Occupation and Business License - Other: $306,000
Other License: $181,000
Other Selective Sales: $22,000
- Total Salaries and Wages: $18,763,000
: $16,153,000
- Water Utilities - Interest on Debt: $323,000
Supplemental Security Income (SSI) in 2006:
- Total number of recipients: 814
- Number of aged recipients: 40
- Number of blind and disabled recipients: 774
- Number of recipients under 18: 107
- Number of recipients between 18 and 64: 585
- Number of recipients older than 64: 122
- Number of recipients also receiving OASDI: 334
- Amount of payments (thousands of dollars): 363
| Most common first names in Sanilac County, MI among deceased individuals | ||
| Name | Count | Lived (average) |
|---|---|---|
| John | 395 | 76.8 years |
| William | 337 | 76.5 years |
| Mary | 289 | 79.6 years |
| Robert | 253 | 71.2 years |
| George | 198 | 76.6 years |
| Charles | 176 | 75.3 years |
| James | 175 | 73.3 years |
| Joseph | 168 | 76.5 years |
| Helen | 149 | 79.7 years |
| Frank | 145 | 76.4 years |
| Most common last names in Sanilac County, MI among deceased individuals | ||
| Last name | Count | Lived (average) |
|---|---|---|
| Smith | 146 | 76.0 years |
| Miller | 84 | 76.6 years |
| Brown | 73 | 79.5 years |
| Davis | 52 | 76.2 years |
| Campbell | 47 | 81.0 years |
| Jones | 43 | 73.6 years |
| Williams | 42 | 77.6 years |
| Walker | 42 | 78.3 years |
| Scott | 41 | 77.5 years |
| Thompson | 40 | 78.1 years |
| Businesses in Sanilac County, MI | ||||
| Name | Count | Name | Count | |
|---|---|---|---|---|
| AT&T | 1 | Lane Furniture | 1 | |
| Ace Hardware | 2 | Little Caesars Pizza | 2 | |
| Advance Auto Parts | 1 | MasterBrand Cabinets | 4 | |
| Burger King | 2 | McDonald's | 4 | |
| Chevrolet | 2 | Pizza Hut | 1 | |
| Dairy Queen | 2 | RadioShack | 2 | |
| FedEx | 1 | Rite Aid | 2 | |
| Ford | 1 | Sears | 1 | |
| GNC | 1 | True Value | 2 | |
| H&R Block | 3 | U-Haul | 2 | |
| Jones New York | 1 | UPS | 4 | |
| Kmart | 1 | Walmart | 1 | |
Sanilac County on our top lists:
- #101 on the list of "Top 101 counties with the lowest surface withdrawal of fresh water for public supply"