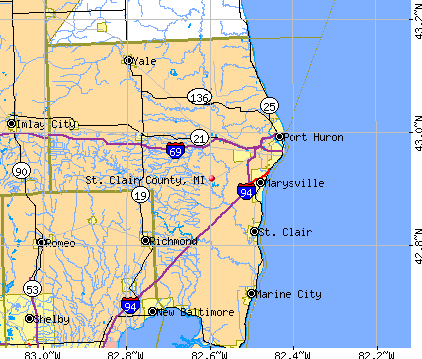
St. Clair County, Michigan (MI)
County owner-occupied free and clear houses and condos in 2010: 14,872
County owner-occupied houses and condos in 2000: 49,404
Renter-occupied apartments: 14,485 (it was 12,668 in 2000)
| % of renters here: | 20% |
| State: | 28% |
Land area: 724 sq. mi.
Water area: 112.3 sq. mi.
Population density: 221 people per square mile (high).
Industries providing employment: Educational, health and social services (20.7%), Manufacturing (20.5%), Retail trade (11.5%).
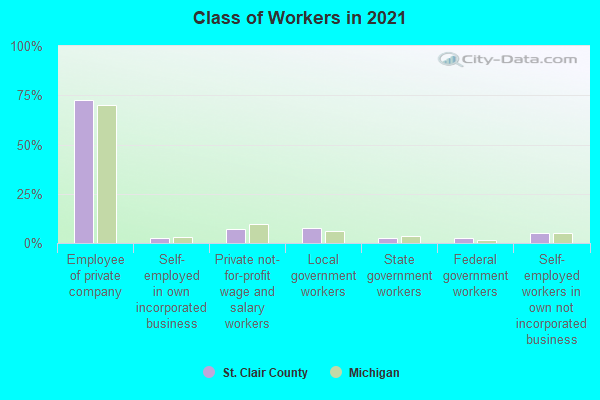
Type of workers:
- Private wage or salary: 81%
- Government: 12%
- Self-employed, not incorporated: 6%
- Unpaid family work: 0%
- OSM Map
- General Map
- Google Map
- MSN Map

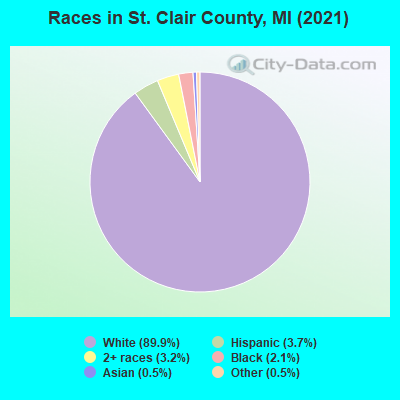
- 143,50189.6%White Non-Hispanic Alone
- 6,0853.8%Hispanic or Latino
- 5,6813.5%Two or more races
- 3,7792.4%Black Non-Hispanic Alone
- 7400.5%Asian alone
- 3090.2%American Indian and Alaska Native alone
- 560.03%Some other race alone
| Median resident age: | 43.5 years |
| Michigan median age: | 40.3 years |
| Males: 80,178 | |
| Females: 79,973 |

 | CDC to Michigan: Shut Down Again. (81 replies) |
| Forbes just named GR #1 place to invest in house (50 replies) |
| Brain tumor patient looking for a home in rule area (3 replies) |
| Metro Area Freeway Names (23 replies) |
| Michigan pop estimates by region 2015 (21 replies) |
| How connected is Windsor to Detroit? (15 replies) |
| St. Clair County: | 2.0 people |
| Michigan: | 2 people |
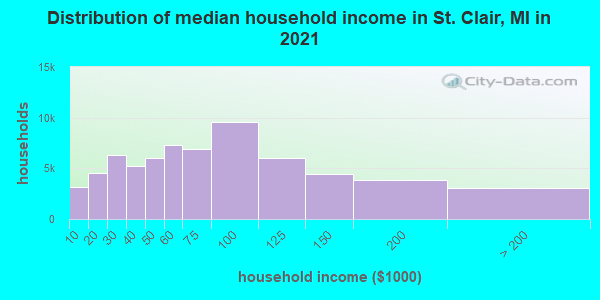
Estimated median household income in 2022: $63,510 ($46,313 in 1999)
| This county: | $63,510 |
| Michigan: | $66,986 |
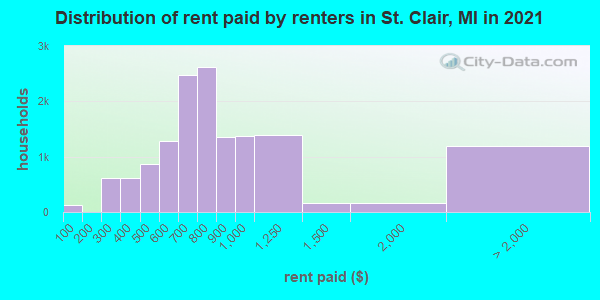
Median contract rent in 2022 for apartments: $822 (lower quartile is $639, upper quartile is $964)
| This county: | $822 |
| State: | $865 |
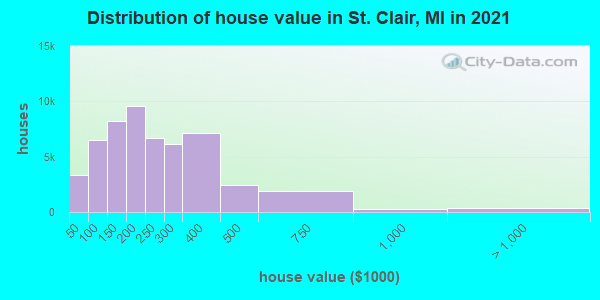
Estimated median house or condo value in 2022: $219,400 (it was $122,700 in 2000)
| St. Clair: | $219,400 |
| Michigan: | $224,400 |
Mean price in 2022:
Median monthly housing costs for homes and condos with a mortgage: $1,359Detached houses: $267,856
Here: $267,856 State: $280,038 Townhouses or other attached units: $249,347
Here: $249,347 State: $239,520 In 2-unit structures: $178,000
Here: $178,000 State: $219,481 In 3-to-4-unit structures: $116,837
Here: $116,837 State: $207,067 In 5-or-more-unit structures: $155,877
Here: $155,877 State: $192,733 Mobile homes: $54,705
Here: $54,705 State: $72,868
Median monthly housing costs for units without a mortgage: $545
Institutionalized population: 1,150
Crime in 2021 (reported by the sheriff's office or county police, not the county total):
- Murders: 0
- Rapes: 28
- Robberies: 3
- Assaults: 126
- Burglaries: 85
- Thefts: 360
- Auto thefts: 52
Crime in 2020 (reported by the sheriff's office or county police, not the county total):
- Murders: 1
- Rapes: 27
- Robberies: 4
- Assaults: 106
- Burglaries: 111
- Thefts: 419
- Auto thefts: 50
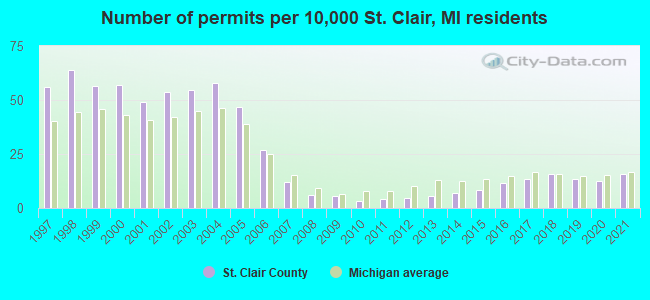
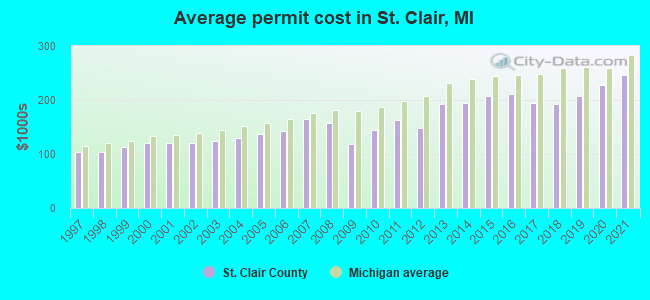
Single-family new house construction building permits:
- 2022: 172 buildings, average cost: $295,700
- 2021: 255 buildings, average cost: $247,100
- 2020: 206 buildings, average cost: $227,900
- 2019: 224 buildings, average cost: $208,400
- 2018: 262 buildings, average cost: $192,300
- 2017: 223 buildings, average cost: $194,000
- 2016: 188 buildings, average cost: $211,000
- 2015: 134 buildings, average cost: $207,500
- 2014: 113 buildings, average cost: $194,100
- 2013: 91 buildings, average cost: $191,600
- 2012: 78 buildings, average cost: $147,600
- 2011: 66 buildings, average cost: $162,900
- 2010: 54 buildings, average cost: $144,000
- 2009: 91 buildings, average cost: $117,800
- 2008: 99 buildings, average cost: $158,000
- 2007: 200 buildings, average cost: $165,200
- 2006: 438 buildings, average cost: $141,900
- 2005: 770 buildings, average cost: $136,600
- 2004: 948 buildings, average cost: $129,900
- 2003: 897 buildings, average cost: $125,200
- 2002: 880 buildings, average cost: $120,200
- 2001: 803 buildings, average cost: $119,600
- 2000: 936 buildings, average cost: $119,600
- 1999: 929 buildings, average cost: $113,100
- 1998: 1052 buildings, average cost: $103,600
- 1997: 918 buildings, average cost: $103,400
Median real estate property taxes paid for housing units with mortgages in 2022: $2,469 (1.1%)
Median real estate property taxes paid for housing units with no mortgage in 2022: $2,284 (1.1%)
| St. Clair County: | 13.7% |
| Michigan: | 13.4% |
Median age of residents in 2022: 43.5 years old
(Males: 42.6 years old, Females: 45.0 years old)
(Median age for: White residents: 46.2 years old, Black residents: 35.2 years old, American Indian residents: 56.2 years old, Asian residents: 27.6 years old, Hispanic or Latino residents: 27.9 years old, Other race residents: 38.4 years old)
Area name: Detroit-Warren-Livonia, MI HUD Metro FMR Area
Fair market rent in 2006 for a 1-bedroom apartment in St. Clair County is $644 a month.
Fair market rent for a 2-bedroom apartment is $770 a month.
Fair market rent for a 3-bedroom apartment is $921 a month.
Cities in this county include: Port Huron, Marysville, St. Clair, Marine City, Algonac, Pearl Beach, Yale, Capac, Emmett.
2023 air pollution in St. Clair County:
Ozone (1-hour): 0.036 ppm (standard limit: 0.12 ppm). Near U.S. average.
Particulate Matter (PM2.5) Annual: 12.4 µg/m3(standard limit: 15.0 µg/m3). Above U.S. average.
Neighboring counties: Bennett County, South Dakota  , Jackson County, Oregon , Niagara County, New York
  , Orleans County, New York , Power County, Idaho , Knox County, Nebraska .
| Here: | 3.6% |
| Michigan: | 3.5% |
Current college students: 6,578
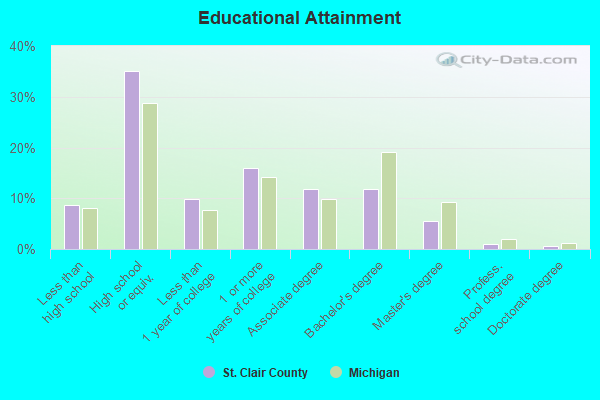
People 25 years of age or older with a high school degree or higher: 92.1%
People 25 years of age or older with a bachelor's degree or higher: 19.4%
Number of foreign born residents: 2,827 (59.4% naturalized citizens)
| St. Clair County: | 1.8% |
| Whole state: | 6.9% |
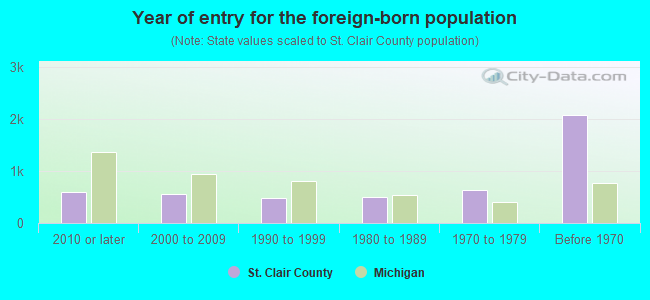
- Year of entry for the foreign-born population
- 6002010 or later
- 5672000 to 2009
- 4651990 to 1999
- 5071980 to 1989
- 6271970 to 1979
- 2,074Before 1970
Mean travel time to work (commute): minutes
Percentage of county residents living and working in this county: 98.9%
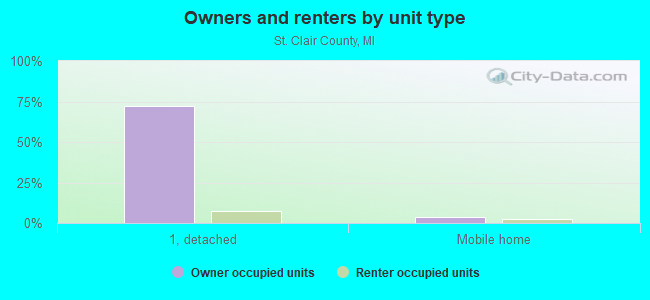
Housing units in structures:
- One, detached: 57,146
- One, attached: 1,918
- Two: 2,112
- 3 or 4: 2,211
- 5 to 9: 1,808
- 10 to 19: 840
- 20 to 49: 484
- 50 or more: 1,421
- Mobile homes: 4,899
Housing units in St. Clair County with a mortgage: 32,772 (2,613 second mortgage, 225 home equity loan, 2,170 both second mortgage and home equity loan)
Houses without a mortgage: 786
| Here: | 3.9% with mortgage |
| State: | 96.7% with mortgage |
Religion statistics for St. Clair County
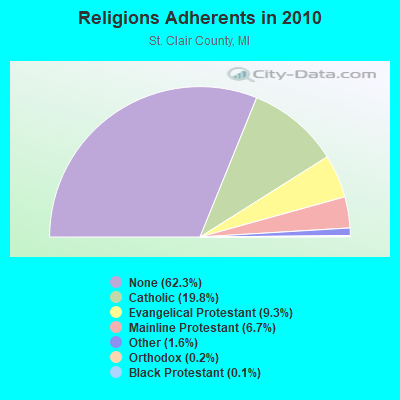
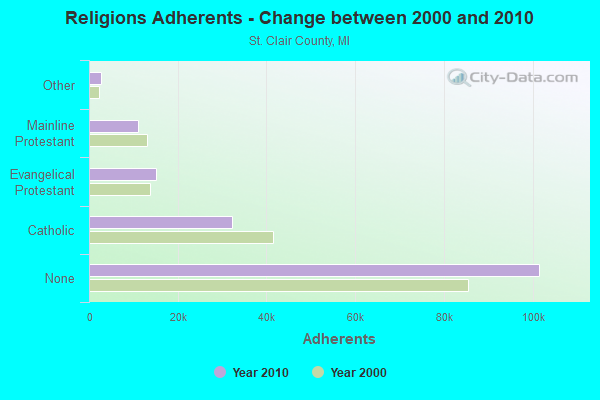
| Religion | Adherents | Congregations |
|---|---|---|
| Catholic | 32,248 | 11 |
| Evangelical Protestant | 15,146 | 56 |
| Mainline Protestant | 10,997 | 49 |
| Other | 2,660 | 11 |
| Orthodox | 274 | 2 |
| Black Protestant | 200 | 2 |
| None | 101,515 | - |
Source: Clifford Grammich, Kirk Hadaway, Richard Houseal, Dale E.Jones, Alexei Krindatch, Richie Stanley and Richard H.Taylor. 2012. 2010 U.S.Religion Census: Religious Congregations & Membership Study. Association of Statisticians of American Religious Bodies. Jones, Dale E., et al. 2002. Congregations and Membership in the United States 2000. Nashville, TN: Glenmary Research Center.
Food Environment Statistics:
| St. Clair County: | 2.00 / 10,000 pop. |
| State: | 2.34 / 10,000 pop. |
| Here: | 0.24 / 10,000 pop. |
| Michigan: | 0.18 / 10,000 pop. |
| This county: | 2.18 / 10,000 pop. |
| Michigan: | 1.52 / 10,000 pop. |
| St. Clair County: | 2.36 / 10,000 pop. |
| Michigan: | 2.99 / 10,000 pop. |
| This county: | 6.54 / 10,000 pop. |
| State: | 6.80 / 10,000 pop. |
| St. Clair County: | 9.1% |
| Michigan: | 9.7% |
| St. Clair County: | 30.2% |
| State: | 29.7% |
| Here: | 11.2% |
| State: | 13.4% |
Agriculture in St. Clair County:
Average size of farms: 145 acresAverage value of agricultural products sold per farm: $31,909
Average value of crops sold per acre for harvested cropland: $234.67
The value of nursery, greenhouse, floriculture, and sod as a percentage of the total market value of agricultural products sold: 17.23%
The value of livestock, poultry, and their products as a percentage of the total market value of agricultural products sold: 21.95%
Average total farm production expenses per farm: $34,918
Harvested cropland as a percentage of land in farms: 73.43%
Irrigated harvested cropland as a percentage of land in farms: 0.63%
Average market value of all machinery and equipment per farm: $63,838
The percentage of farms operated by a family or individual: 92.78%
Average age of principal farm operators: 54 years
Average number of cattle and calves per 100 acres of all land in farms: 5.59
Milk cows as a percentage of all cattle and calves: 15.79%
Corn for grain: 27998 harvested acres
All wheat for grain: 6005 harvested acres
Soybeans for beans: 75733 harvested acres
Vegetables: 1,021 harvested acres
Land in orchards: 188 acres
Earthquake activity:
St. Clair County-area historical earthquake activity is significantly above Michigan state average. It is 57% smaller than the overall U.S. average.On 9/25/1998 at 19:52:52, a magnitude 5.2 (4.8 MB, 4.3 MS, 5.2 LG, 4.5 MW, Depth: 3.1 mi, Class: Moderate, Intensity: VI - VII) earthquake occurred 149.8 miles away from St. Clair County center
On 1/31/1986 at 16:46:43, a magnitude 5.0 (5.0 MB) earthquake occurred 117.0 miles away from the county center
On 7/12/1986 at 08:19:37, a magnitude 4.5 (4.5 MB, Class: Light, Intensity: IV - V) earthquake occurred 188.3 miles away from the county center
On 8/23/2011 at 17:51:04, a magnitude 5.8 (5.8 MW, Depth: 3.7 mi) earthquake occurred 424.4 miles away from the county center
On 6/10/2019 at 14:50:45, a magnitude 4.0 (4.0 MB, Depth: 1.2 mi) earthquake occurred 103.6 miles away from St. Clair County center
On 7/27/1980 at 18:52:21, a magnitude 5.2 (5.1 MB, 4.7 MS, 5.0 UK, 5.2 UK) earthquake occurred 333.5 miles away from the county center
Magnitude types: regional Lg-wave magnitude (LG), body-wave magnitude (MB), surface-wave magnitude (MS), moment magnitude (MW)
Most recent natural disasters:
- Michigan Covid-19 Pandemic, Incident Period: January 20, 2020, FEMA Id: 4494, Natural disaster type: Other
The number of natural disasters in St. Clair County (1) is a lot smaller than the US average (15).
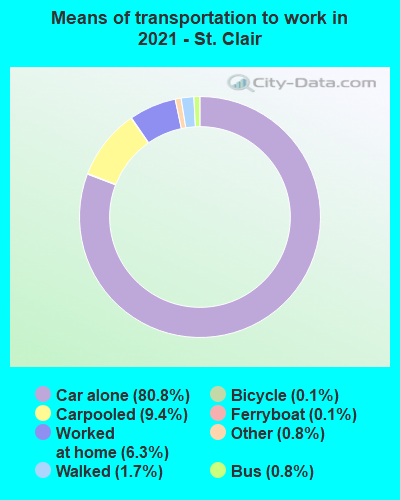
Means of transportation to work:
- Drove a car alone: 41,626 (76.6%)
- Carpooled: 4,782 (8.8%)
- Bus: 325 (0.6%)
- Ferryboat: 132 (0.2%)
- Taxicab, motorcycle, or other means: 532 (1.0%)
- Bicycle: 79 (0.1%)
- Walked: 804 (1.5%)
- Worked at home: 5,545 (10.2%)
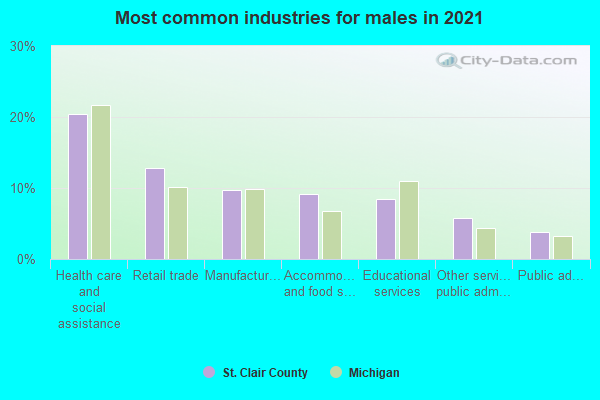
- Health care and social assistance (21%)
- Retail trade (10%)
- Educational services (10%)
- Manufacturing (8%)
- Accommodation and food services (8%)
- Professional, scientific, and technical services (5%)
- Other services, except public administration (4%)
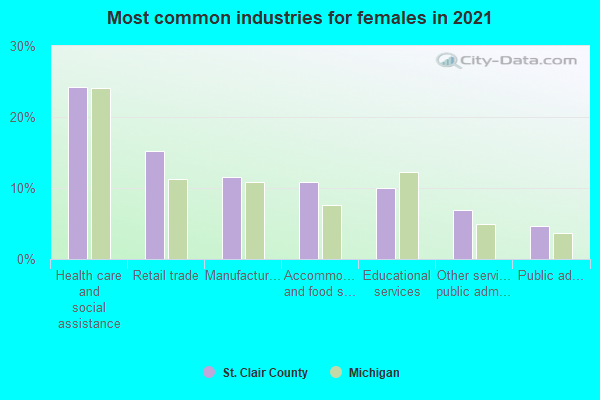
- Health care and social assistance (25%)
- Retail trade (11%)
- Educational services (11%)
- Manufacturing (9%)
- Accommodation and food services (9%)
- Professional, scientific, and technical services (5%)
- Other services, except public administration (5%)
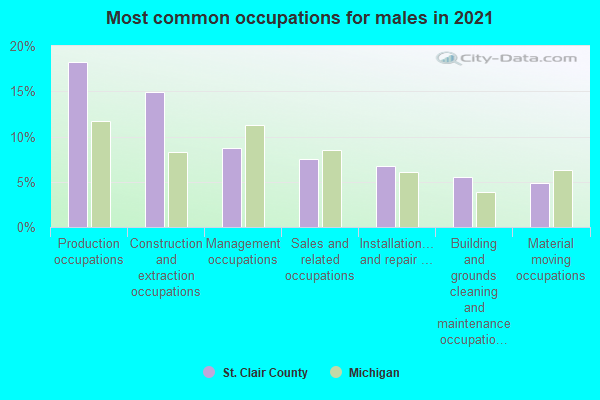
- Production occupations (16%)
- Construction and extraction occupations (12%)
- Installation, maintenance, and repair occupations (10%)
- Management occupations (8%)
- Sales and related occupations (8%)
- Transportation occupations (5%)
- Food preparation and serving related occupations (5%)
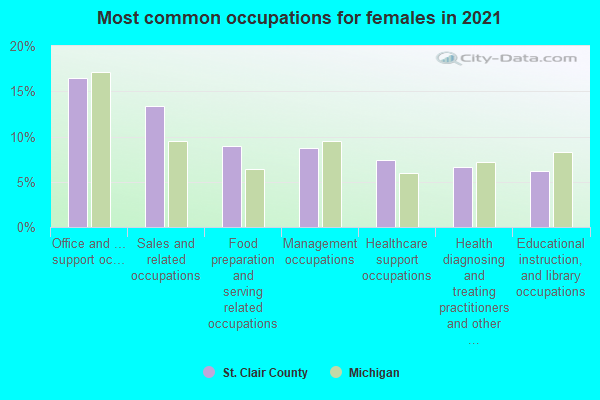
- Office and administrative support occupations (16%)
- Healthcare support occupations (12%)
- Sales and related occupations (10%)
- Food preparation and serving related occupations (9%)
- Management occupations (8%)
- Educational instruction, and library occupations (7%)
- Production occupations (5%)
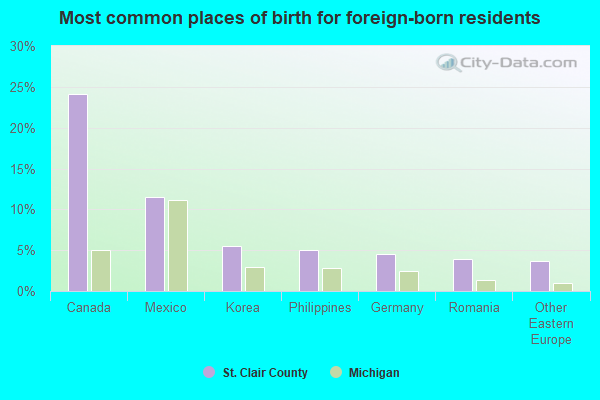
- Canada (28%)
- Mexico (10%)
- Philippines (7%)
- Iraq (4%)
- Other Eastern Europe (4%)
- Germany (3%)
- India (3%)

- German (21%)
- American (12%)
- Polish (10%)
- English (9%)
- Irish (8%)
- Italian (6%)
- European (3%)
People in group quarters in St. Clair County, Michigan in 2010:
- 714 people in nursing facilities/skilled-nursing facilities
- 418 people in local jails and other municipal confinement facilities
- 384 people in other noninstitutional facilities
- 283 people in group homes intended for adults
- 120 people in workers' group living quarters and job corps centers
- 34 people in residential treatment centers for adults
- 28 people in emergency and transitional shelters (with sleeping facilities) for people experiencing homelessness
- 13 people in group homes for juveniles (non-correctional)
- 4 people in residential treatment centers for juveniles (non-correctional)
People in group quarters in St. Clair County, Michigan in 2000:
- 605 people in nursing homes
- 445 people in other group homes
- 211 people in local jails and other confinement facilities (including police lockups)
- 157 people in other noninstitutional group quarters
- 115 people in homes for the mentally retarded
- 35 people in other types of correctional institutions
- 28 people in homes or halfway houses for drug/alcohol abuse
- 21 people in homes for the mentally ill
- 18 people in military ships
- 17 people in other nonhousehold living situations
- 16 people in homes for the physically handicapped
- 4 people in crews of maritime vessels
- 3 people in religious group quarters
4.91% of this county's 2021 resident taxpayers lived in other counties in 2020 ($57,982 average adjusted gross income)
| Here: | 4.91% |
| Michigan average: | 5.83% |
10 or fewer of this county's residents moved from foreign countries.
3.75% relocated from other counties in Michigan ($44,179 average AGI)
1.15% relocated from other states ($13,803 average AGI)
St. Clair County: 1.15% Michigan average: 1.78%
Top counties from which taxpayers relocated into this county between 2020 and 2021:
| from Macomb County, MI | |
| from Oakland County, MI | |
| from Sanilac County, MI | |
| from Wayne County, MI | |
| from Lapeer County, MI | |
| from Genesee County, MI | |
| from Ingham County, MI |
4.75% of this county's 2020 resident taxpayers moved to other counties in 2021 ($51,410 average adjusted gross income)
| Here: | 4.75% |
| Michigan average: | 5.95% |
10 or fewer of this county's residents moved to foreign countries.
3.51% relocated to other counties in Michigan ($36,645 average AGI)
1.24% relocated to other states ($14,765 average AGI)
St. Clair County: 1.24% Michigan average: 1.91%
Top counties to which taxpayers relocated from this county between 2020 and 2021:
| to Macomb County, MI | |
| to Oakland County, MI | |
| to Sanilac County, MI | |
| to Wayne County, MI | |
| to Lapeer County, MI | |
| to Genesee County, MI | |
| to Kent County, MI |
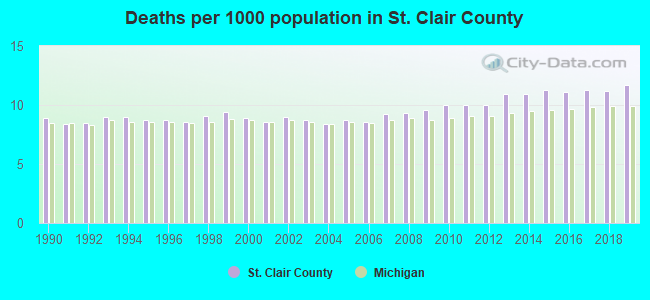
Births per 1000 population from 1990 to 1999: 13.6
Births per 1000 population from 2000 to 2009: 11.9
Births per 1000 population from 2010 to 2022: 8.2
Deaths per 1000 population from 1990 to 1999: 8.8
Deaths per 1000 population from 2000 to 2009: 8.9
Deaths per 1000 population from 2010 to 2020: 11.1
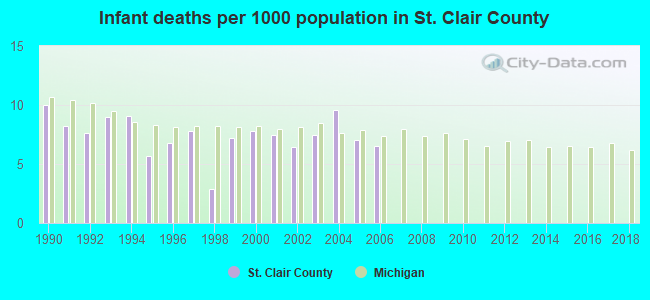
Infant deaths per 1000 live births from 1990 to 1999: 7.4
Infant deaths per 1000 live births from 2000 to 2006: 7.5
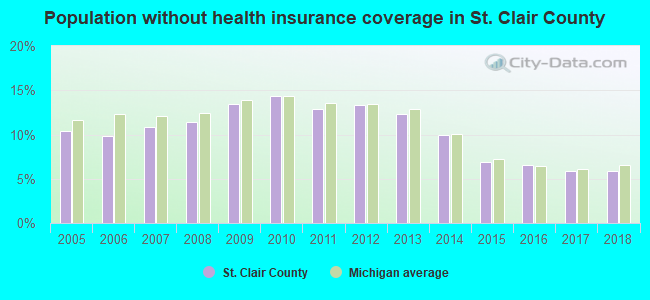
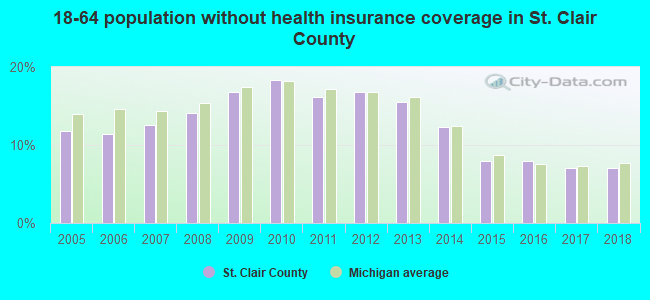
Persons under 19 years old without health insurance coverage in 2018: 3.1%
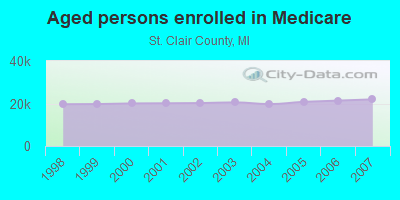
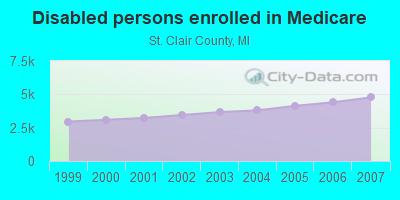
Persons enrolled in hospital insurance and/or supplemental medical insurance (Medicare) in July 1, 2007: 26,716 (21,947 aged, 4,769 disabled)
Children under 18 without health insurance coverage in 2007: 2,368 (5%)
Most common underlying causes of death in St. Clair County, Michigan in 1999 - 2019:
- Atherosclerotic heart disease (3,565)
- Bronchus or lung, unspecified - Malignant neoplasms (2,345)
- Acute myocardial infarction, unspecified (1,727)
- Chronic obstructive pulmonary disease, unspecified (1,726)
- Atherosclerotic cardiovascular disease, so described (1,152)
- Alzheimer disease, unspecified (857)
- Congestive heart failure (819)
- Stroke, not specified as haemorrhage or infarction (775)
- Hypertensive heart disease without (congestive) heart failure (645)
- Unspecified diabetes mellitus, without complications (640)
Population without health insurance coverage in 2000: 10%
Children under 18 without health insurance coverage in 2000: 6%
Short term general hospital admissions per 100,000 population in 2004: 10,571
Short term general hospital beds per 100,000 population in 2004: 218
Emergency room visits per 100,000 population in 2004: 38,862
General practice office based MDs per 100,000 population in 2005: 1,166
Medical specialist MDs per 100,000 population in 2005: 867
Dentists per 100,000 population in 1998: 10
Total births per 100,000 population, July 2005 - July 2006 : 48
Total deaths per 100,000 population, July 2005 - July 2006: 58
Limited-service eating places per 100,000 population in 2005 : 9
Beer, wine & liquor stores per 100,000 population in 2005: 1
Homicides per 1,000,000 population from 2000 to 2006: 17.9. This is less than state average.
Suicides per 1,000,000 population from 2000 to 2006: 115.8. This is more than state average.
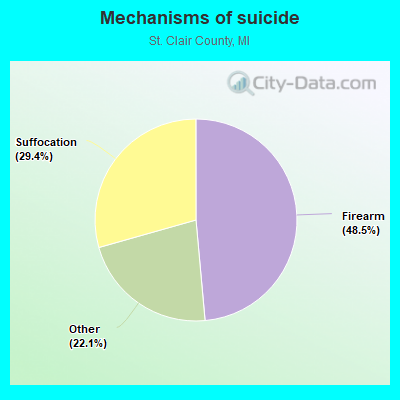
- Firearm - 56.2
- Suffocation - 34.0
- Other - 25.5
Household type by relationship:
Households: 160,151- Male householders: 32,503 (9,512 living alone), Female householders: 36,606 (9,732 living alone)
34,902 spouses (34,759 opposite-sex spouses), 5,378 unmarried partners, (5,311 opposite-sex unmarried partners), 39,726 children (36,319 natural, 1,382 adopted, 2,025 stepchildren), 1,791 grandchildren, 2,036 brothers or sisters, 1,026 parents, 345 foster children, 1,120 other relatives, 3,440 non-relatives
- In group quarters: 1,278
Size of family households: 22,673 2-persons, 9,344 3-persons, 8,306 4-persons, 3,862 5-persons, 951 6-persons, 915 7-or-more-persons.
Size of nonfamily households: 19,244 1-person, 3,010 2-persons, 697 3-persons, 58 5-persons, 49 6-persons.
19,889 married couples with children.
8,325 single-parent households (2,474 men, 5,851 women).
97.4% of residents of St. Clair speak English at home.
1.0% of residents speak Spanish at home (66% speak English very well, 19% speak English well, 11% speak English not well, 4% don't speak English at all).
0.9% of residents speak other Indo-European language at home (84% speak English very well, 12% speak English well, 4% speak English not well).
0.3% of residents speak Asian or Pacific Island language at home (68% speak English very well, 17% speak English well, 13% speak English not well, 2% don't speak English at all).
0.3% of residents speak other language at home (49% speak English very well, 16% speak English well, 23% speak English not well, 12% don't speak English at all).
In fiscal year 2004:
Federal Government expenditure: $693,877,000 ($4,060 per capita)
Department of Defense expenditure: $29,998,000
Federal direct payments to individuals for retirement and disability: $315,735,000
Federal other direct payments to individuals: $176,811,000
Federal direct payments not to individuals: $6,441,000
Federal grants: $130,042,000
Federal procurement contracts: $27,221,000 ($21,129,000 Department of Defense)
Federal salaries and wages: $37,627,000 ($40,000 Department of Defense)
Federal Government direct loans: $1,410,000
Federal guaranteed/insured loans: $90,654,000
Federal Government insurance: $236,144,000
Population change from April 1, 2000 to July 1, 2005:
Births: 10,838| Here: | 63 per 1000 residents |
| State: | 68 per 1000 residents |
Deaths: 7,806
| Here: | 46 per 1000 residents |
| State: | 45 per 1000 residents |
Net international migration: +480
| Here: | +3 per 1000 residents |
| State: | +12 per 1000 residents |
Net internal migration: +3,925
| Here: | |
| State: |
Total withdrawal of fresh water for public supply: 171.55 millions of gallons per day (0% from ground, 100% from surface)
| Here: | 6.4 |
| State: | 6.5 |
| Here: | 4.8 |
| State: | 4.3 |
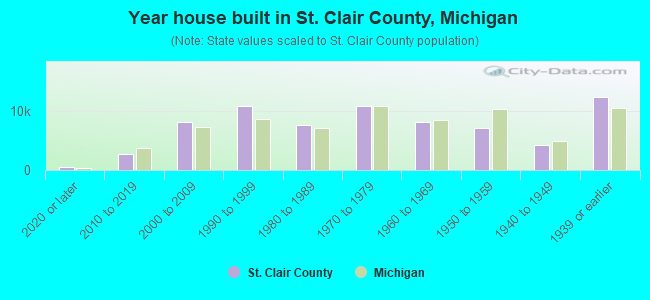
- Year house built in St. Clair County, Michigan
- 9922020 or later
- 3,4092010 to 2019
- 8,6282000 to 2009
- 11,1051990 to 1999
- 7,0571980 to 1989
- 9,9391970 to 1979
- 7,0111960 to 1969
- 7,8411950 to 1959
- 5,0851940 to 1949
- 11,7721939 or earlier
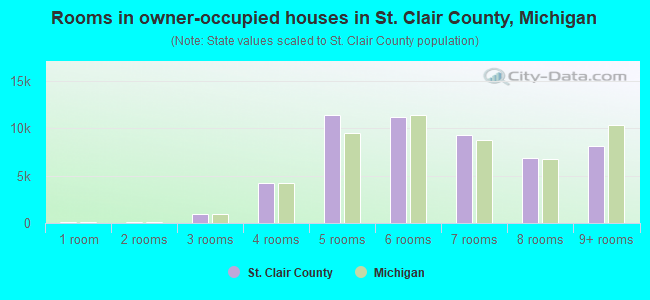
- Rooms in owner-occupied houses in St. Clair County, Michigan
- 01 room
- 1792 rooms
- 5613 rooms
- 3,8564 rooms
- 11,8895 rooms
- 12,3726 rooms
- 10,6157 rooms
- 5,9328 rooms
- 9,8279+ rooms
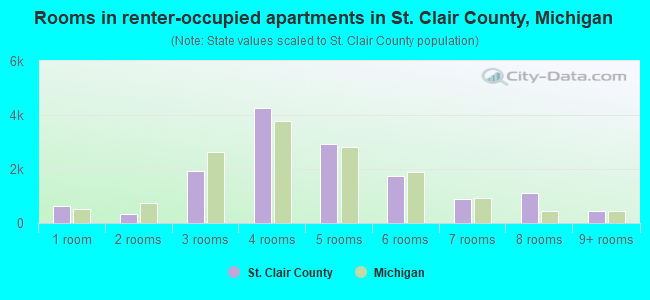
- Rooms in renter-occupied apartments in St. Clair County, Michigan
- 4251 room
- 4382 rooms
- 2,1583 rooms
- 3,3494 rooms
- 2,2215 rooms
- 2,6836 rooms
- 9777 rooms
- 1,2018 rooms
- 4269+ rooms
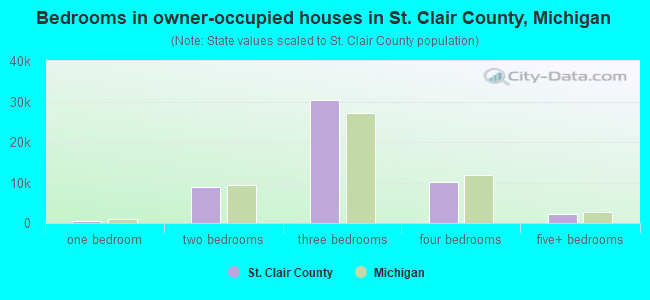
- Bedrooms in owner-occupied houses in St. Clair County, Michigan
- 148no bedroom
- 6401 bedroom
- 8,7432 bedrooms
- 31,4723 bedrooms
- 12,3914 bedrooms
- 1,8375+ bedrooms
- Bedrooms in renter-occupied apartments in St. Clair County, Michigan
- 594no bedroom
- 3,3591 bedroom
- 4,4352 bedrooms
- 3,3723 bedrooms
- 1,2214 bedrooms
- 8975+ bedrooms
- Cars and other vehicles available in St. Clair County in owner-occupied houses/condos
- 1,565no vehicle
- 14,6031 vehicle
- 22,0182 vehicles
- 11,4503 vehicles
- 3,6114 vehicles
- 1,9845+ vehicles
- Cars and other vehicles available in St. Clair County in renter-occupied apartments
- 2,203no vehicle
- 6,2401 vehicle
- 3,9472 vehicles
- 9933 vehicles
- 784 vehicles
- 4175+ vehicles
90.0% of St. Clair County residents lived in the same house 1 years ago.
Out of people who lived in different houses, 39% lived in this county.
Out of people who lived in different counties, 78% lived in Michigan.
| St. Clair County: | 90.0% |
| State average: | 88.4% |
Place of birth for U.S.-born residents:
- This state: 141,433
- Other state: 14,999
- Northeast: 2,225
- Midwest: 4,813
- South: 5,401
- West: 2,560
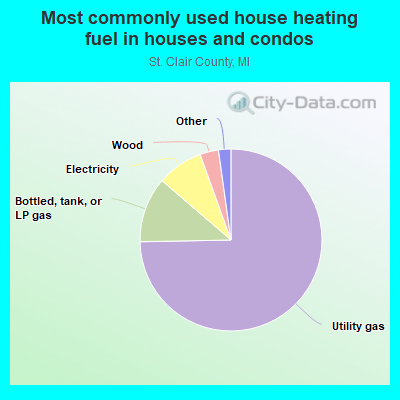
- 74.9%Utility gas
- 12.7%Bottled, tank, or LP gas
- 6.9%Electricity
- 2.5%Wood
- 1.1%Other fuel
- 0.9%Fuel oil, kerosene, etc.
- 0.5%Solar energy
- 0.4%No fuel used
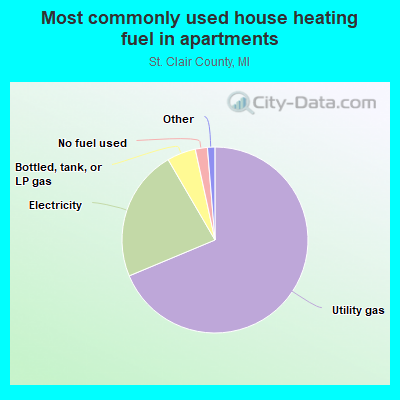
- 73.6%Utility gas
- 17.0%Electricity
- 7.3%Bottled, tank, or LP gas
- 0.8%Wood
- 0.7%Other fuel
- 0.4%No fuel used
- 0.2%Fuel oil, kerosene, etc.
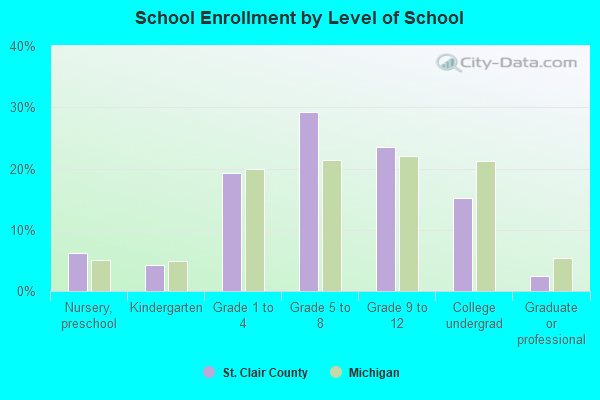
Private vs. public school enrollment:
| Here: | 10.3% |
| Michigan: | 12.4% |
| Here: | 2.8% |
| Michigan: | 9.8% |
| Here: | 18.4% |
| Michigan: | 14.9% |
St. Clair County government finances - Expenditure in 2020:
- Charges - Other: $20,242,000
Other: $14,533,000
Solid Waste Management: $8,325,000
Solid Waste Management: $6,813,000
Regular Highways: $3,982,000
Natural Resources - Other: $2,336,000
Natural Resources - Other: $1,743,000
Sewerage: $700,000
Air Transportation: $587,000
Air Transportation: $578,000
Regular Highways: $421,000
Parks and Recreation: $145,000
Parks and Recreation: $101,000
- Construction - Regular Highways: $21,759,000
Regular Highways: $8,911,000
General - Other: $1,725,000
General - Other: $907,000
- Current Operations - Health - Other: $62,489,000
Health - Other: $56,476,000
Regular Highways: $35,472,000
General - Other: $17,835,000
Regular Highways: $17,636,000
General - Other: $16,658,000
Correctional Institutions: $14,032,000
Correctional Institutions: $13,119,000
Police Protection: $12,085,000
Police Protection: $11,295,000
Judicial and Legal Services: $11,061,000
Judicial and Legal Services: $10,194,000
Public Welfare - Other: $6,410,000
Public Welfare - Other: $6,397,000
Solid Waste Management: $5,703,000
Libraries: $5,375,000
Central Staff Services: $5,217,000
Libraries: $5,178,000
Parks and Recreation: $5,116,000
Solid Waste Management: $5,049,000
Parks and Recreation: $4,953,000
Central Staff Services: $3,374,000
General Public Buildings: $2,394,000
Sewerage: $2,325,000
General Public Buildings: $2,258,000
Financial Administration: $2,139,000
Sewerage: $2,090,000
Financial Administration: $1,908,000
Air Transportation: $1,088,000
Air Transportation: $1,024,000
Water Utilities: $916,000
Corrections - Other: $808,000
Corrections - Other: $676,000
- Federal Intergovernmental - Highways: $7,910,000
Other: $6,910,000
Other: $3,323,000
Highways: $2,294,000
Housing and Community Development: $2,064,000
Health and Hospitals: $1,939,000
Health and Hospitals: $1,838,000
Housing and Community Development: $150,000
- General - Interest on Debt: $1,795,000
Interest on Debt: $1,510,000
- Local Intergovernmental - Highways: $6,224,000
Highways: $4,672,000
Other: $3,759,000
Other: $3,451,000
Health and Hospitals: $2,000
- Long Term Debt - Beginning Outstanding - Unspecified Public Purpose: $70,184,000
Outstanding Unspecified Public Purpose: $67,398,000
Beginning Outstanding - Unspecified Public Purpose: $65,373,000
Outstanding Unspecified Public Purpose: $61,478,000
Retired Unspecified Public Purpose: $6,659,000
Retired Unspecified Public Purpose: $5,652,000
Issue, Unspecified Public Purpose: $3,873,000
Issue, Unspecified Public Purpose: $1,758,000
- Miscellaneous - General Revenue - Other: $5,057,000
General Revenue - Other: $4,855,000
Interest Earnings: $2,866,000
Interest Earnings: $1,679,000
Fines and Forfeits: $1,015,000
Rents: $992,000
Fines and Forfeits: $987,000
Rents: $676,000
- Other Capital Outlay - Parks and Recreation: $1,182,000
Health - Other: $995,000
Regular Highways: $826,000
Judicial and Legal Services: $475,000
Parks and Recreation: $466,000
Libraries: $338,000
Regular Highways: $315,000
Health - Other: $263,000
Judicial and Legal Services: $110,000
- Other Funds - Cash and Securities: $102,654,000
Cash and Securities: $100,075,000
- Revenue - Water Utilities: $650,000
- State Intergovernmental - Health and Hospitals: $61,402,000
Highways: $54,567,000
Health and Hospitals: $53,343,000
Highways: $20,125,000
Other: $7,113,000
Other: $6,566,000
General Local Government Support: $3,870,000
General Local Government Support: $3,802,000
Public Welfare: $340,000
Public Welfare: $218,000
- Tax - Property: $50,344,000
Property: $47,133,000
Other License: $813,000
Other License: $802,000
- Total Salaries and Wages: $45,470,000
: $41,283,000
St. Clair County government finances - Revenue in 2020:
- Charges - Other: $20,242,000
Other: $14,533,000
Solid Waste Management: $8,325,000
Solid Waste Management: $6,813,000
Regular Highways: $3,982,000
Natural Resources - Other: $2,336,000
Natural Resources - Other: $1,743,000
Sewerage: $700,000
Air Transportation: $587,000
Air Transportation: $578,000
Regular Highways: $421,000
Parks and Recreation: $145,000
Parks and Recreation: $101,000
- Construction - Regular Highways: $21,759,000
Regular Highways: $8,911,000
General - Other: $1,725,000
General - Other: $907,000
- Current Operations - Health - Other: $62,489,000
Health - Other: $56,476,000
Regular Highways: $35,472,000
General - Other: $17,835,000
Regular Highways: $17,636,000
General - Other: $16,658,000
Correctional Institutions: $14,032,000
Correctional Institutions: $13,119,000
Police Protection: $12,085,000
Police Protection: $11,295,000
Judicial and Legal Services: $11,061,000
Judicial and Legal Services: $10,194,000
Public Welfare - Other: $6,410,000
Public Welfare - Other: $6,397,000
Solid Waste Management: $5,703,000
Libraries: $5,375,000
Central Staff Services: $5,217,000
Libraries: $5,178,000
Parks and Recreation: $5,116,000
Solid Waste Management: $5,049,000
Parks and Recreation: $4,953,000
Central Staff Services: $3,374,000
General Public Buildings: $2,394,000
Sewerage: $2,325,000
General Public Buildings: $2,258,000
Financial Administration: $2,139,000
Sewerage: $2,090,000
Financial Administration: $1,908,000
Air Transportation: $1,088,000
Air Transportation: $1,024,000
Water Utilities: $916,000
Corrections - Other: $808,000
Corrections - Other: $676,000
- Federal Intergovernmental - Highways: $7,910,000
Other: $6,910,000
Other: $3,323,000
Highways: $2,294,000
Housing and Community Development: $2,064,000
Health and Hospitals: $1,939,000
Health and Hospitals: $1,838,000
Housing and Community Development: $150,000
- General - Interest on Debt: $1,795,000
Interest on Debt: $1,510,000
- Local Intergovernmental - Highways: $6,224,000
Highways: $4,672,000
Other: $3,759,000
Other: $3,451,000
Health and Hospitals: $2,000
- Long Term Debt - Beginning Outstanding - Unspecified Public Purpose: $70,184,000
Outstanding Unspecified Public Purpose: $67,398,000
Beginning Outstanding - Unspecified Public Purpose: $65,373,000
Outstanding Unspecified Public Purpose: $61,478,000
Retired Unspecified Public Purpose: $6,659,000
Retired Unspecified Public Purpose: $5,652,000
Issue, Unspecified Public Purpose: $3,873,000
Issue, Unspecified Public Purpose: $1,758,000
- Miscellaneous - General Revenue - Other: $5,057,000
General Revenue - Other: $4,855,000
Interest Earnings: $2,866,000
Interest Earnings: $1,679,000
Fines and Forfeits: $1,015,000
Rents: $992,000
Fines and Forfeits: $987,000
Rents: $676,000
- Other Capital Outlay - Parks and Recreation: $1,182,000
Health - Other: $995,000
Regular Highways: $826,000
Judicial and Legal Services: $475,000
Parks and Recreation: $466,000
Libraries: $338,000
Regular Highways: $315,000
Health - Other: $263,000
Judicial and Legal Services: $110,000
- Other Funds - Cash and Securities: $102,654,000
Cash and Securities: $100,075,000
- Revenue - Water Utilities: $650,000
- State Intergovernmental - Health and Hospitals: $61,402,000
Highways: $54,567,000
Health and Hospitals: $53,343,000
Highways: $20,125,000
Other: $7,113,000
Other: $6,566,000
General Local Government Support: $3,870,000
General Local Government Support: $3,802,000
Public Welfare: $340,000
Public Welfare: $218,000
- Tax - Property: $50,344,000
Property: $47,133,000
Other License: $813,000
Other License: $802,000
- Total Salaries and Wages: $45,470,000
: $41,283,000
St. Clair County government finances - Debt in 2020:
- Charges - Other: $20,242,000
Other: $14,533,000
Solid Waste Management: $8,325,000
Solid Waste Management: $6,813,000
Regular Highways: $3,982,000
Natural Resources - Other: $2,336,000
Natural Resources - Other: $1,743,000
Sewerage: $700,000
Air Transportation: $587,000
Air Transportation: $578,000
Regular Highways: $421,000
Parks and Recreation: $145,000
Parks and Recreation: $101,000
- Construction - Regular Highways: $21,759,000
Regular Highways: $8,911,000
General - Other: $1,725,000
General - Other: $907,000
- Current Operations - Health - Other: $62,489,000
Health - Other: $56,476,000
Regular Highways: $35,472,000
General - Other: $17,835,000
Regular Highways: $17,636,000
General - Other: $16,658,000
Correctional Institutions: $14,032,000
Correctional Institutions: $13,119,000
Police Protection: $12,085,000
Police Protection: $11,295,000
Judicial and Legal Services: $11,061,000
Judicial and Legal Services: $10,194,000
Public Welfare - Other: $6,410,000
Public Welfare - Other: $6,397,000
Solid Waste Management: $5,703,000
Libraries: $5,375,000
Central Staff Services: $5,217,000
Libraries: $5,178,000
Parks and Recreation: $5,116,000
Solid Waste Management: $5,049,000
Parks and Recreation: $4,953,000
Central Staff Services: $3,374,000
General Public Buildings: $2,394,000
Sewerage: $2,325,000
General Public Buildings: $2,258,000
Financial Administration: $2,139,000
Sewerage: $2,090,000
Financial Administration: $1,908,000
Air Transportation: $1,088,000
Air Transportation: $1,024,000
Water Utilities: $916,000
Corrections - Other: $808,000
Corrections - Other: $676,000
- Federal Intergovernmental - Highways: $7,910,000
Other: $6,910,000
Other: $3,323,000
Highways: $2,294,000
Housing and Community Development: $2,064,000
Health and Hospitals: $1,939,000
Health and Hospitals: $1,838,000
Housing and Community Development: $150,000
- General - Interest on Debt: $1,795,000
Interest on Debt: $1,510,000
- Local Intergovernmental - Highways: $6,224,000
Highways: $4,672,000
Other: $3,759,000
Other: $3,451,000
Health and Hospitals: $2,000
- Long Term Debt - Beginning Outstanding - Unspecified Public Purpose: $70,184,000
Outstanding Unspecified Public Purpose: $67,398,000
Beginning Outstanding - Unspecified Public Purpose: $65,373,000
Outstanding Unspecified Public Purpose: $61,478,000
Retired Unspecified Public Purpose: $6,659,000
Retired Unspecified Public Purpose: $5,652,000
Issue, Unspecified Public Purpose: $3,873,000
Issue, Unspecified Public Purpose: $1,758,000
- Miscellaneous - General Revenue - Other: $5,057,000
General Revenue - Other: $4,855,000
Interest Earnings: $2,866,000
Interest Earnings: $1,679,000
Fines and Forfeits: $1,015,000
Rents: $992,000
Fines and Forfeits: $987,000
Rents: $676,000
- Other Capital Outlay - Parks and Recreation: $1,182,000
Health - Other: $995,000
Regular Highways: $826,000
Judicial and Legal Services: $475,000
Parks and Recreation: $466,000
Libraries: $338,000
Regular Highways: $315,000
Health - Other: $263,000
Judicial and Legal Services: $110,000
- Other Funds - Cash and Securities: $102,654,000
Cash and Securities: $100,075,000
- Revenue - Water Utilities: $650,000
- State Intergovernmental - Health and Hospitals: $61,402,000
Highways: $54,567,000
Health and Hospitals: $53,343,000
Highways: $20,125,000
Other: $7,113,000
Other: $6,566,000
General Local Government Support: $3,870,000
General Local Government Support: $3,802,000
Public Welfare: $340,000
Public Welfare: $218,000
- Tax - Property: $50,344,000
Property: $47,133,000
Other License: $813,000
Other License: $802,000
- Total Salaries and Wages: $45,470,000
: $41,283,000
St. Clair County government finances - Cash and Securities in 2020:
- Charges - Other: $20,242,000
Other: $14,533,000
Solid Waste Management: $8,325,000
Solid Waste Management: $6,813,000
Regular Highways: $3,982,000
Natural Resources - Other: $2,336,000
Natural Resources - Other: $1,743,000
Sewerage: $700,000
Air Transportation: $587,000
Air Transportation: $578,000
Regular Highways: $421,000
Parks and Recreation: $145,000
Parks and Recreation: $101,000
- Construction - Regular Highways: $21,759,000
Regular Highways: $8,911,000
General - Other: $1,725,000
General - Other: $907,000
- Current Operations - Health - Other: $62,489,000
Health - Other: $56,476,000
Regular Highways: $35,472,000
General - Other: $17,835,000
Regular Highways: $17,636,000
General - Other: $16,658,000
Correctional Institutions: $14,032,000
Correctional Institutions: $13,119,000
Police Protection: $12,085,000
Police Protection: $11,295,000
Judicial and Legal Services: $11,061,000
Judicial and Legal Services: $10,194,000
Public Welfare - Other: $6,410,000
Public Welfare - Other: $6,397,000
Solid Waste Management: $5,703,000
Libraries: $5,375,000
Central Staff Services: $5,217,000
Libraries: $5,178,000
Parks and Recreation: $5,116,000
Solid Waste Management: $5,049,000
Parks and Recreation: $4,953,000
Central Staff Services: $3,374,000
General Public Buildings: $2,394,000
Sewerage: $2,325,000
General Public Buildings: $2,258,000
Financial Administration: $2,139,000
Sewerage: $2,090,000
Financial Administration: $1,908,000
Air Transportation: $1,088,000
Air Transportation: $1,024,000
Water Utilities: $916,000
Corrections - Other: $808,000
Corrections - Other: $676,000
- Federal Intergovernmental - Highways: $7,910,000
Other: $6,910,000
Other: $3,323,000
Highways: $2,294,000
Housing and Community Development: $2,064,000
Health and Hospitals: $1,939,000
Health and Hospitals: $1,838,000
Housing and Community Development: $150,000
- General - Interest on Debt: $1,795,000
Interest on Debt: $1,510,000
- Local Intergovernmental - Highways: $6,224,000
Highways: $4,672,000
Other: $3,759,000
Other: $3,451,000
Health and Hospitals: $2,000
- Long Term Debt - Beginning Outstanding - Unspecified Public Purpose: $70,184,000
Outstanding Unspecified Public Purpose: $67,398,000
Beginning Outstanding - Unspecified Public Purpose: $65,373,000
Outstanding Unspecified Public Purpose: $61,478,000
Retired Unspecified Public Purpose: $6,659,000
Retired Unspecified Public Purpose: $5,652,000
Issue, Unspecified Public Purpose: $3,873,000
Issue, Unspecified Public Purpose: $1,758,000
- Miscellaneous - General Revenue - Other: $5,057,000
General Revenue - Other: $4,855,000
Interest Earnings: $2,866,000
Interest Earnings: $1,679,000
Fines and Forfeits: $1,015,000
Rents: $992,000
Fines and Forfeits: $987,000
Rents: $676,000
- Other Capital Outlay - Parks and Recreation: $1,182,000
Health - Other: $995,000
Regular Highways: $826,000
Judicial and Legal Services: $475,000
Parks and Recreation: $466,000
Libraries: $338,000
Regular Highways: $315,000
Health - Other: $263,000
Judicial and Legal Services: $110,000
- Other Funds - Cash and Securities: $102,654,000
Cash and Securities: $100,075,000
- Revenue - Water Utilities: $650,000
- State Intergovernmental - Health and Hospitals: $61,402,000
Highways: $54,567,000
Health and Hospitals: $53,343,000
Highways: $20,125,000
Other: $7,113,000
Other: $6,566,000
General Local Government Support: $3,870,000
General Local Government Support: $3,802,000
Public Welfare: $340,000
Public Welfare: $218,000
- Tax - Property: $50,344,000
Property: $47,133,000
Other License: $813,000
Other License: $802,000
- Total Salaries and Wages: $45,470,000
: $41,283,000
Supplemental Security Income (SSI) in 2006:
- Total number of recipients: 2,684
- Number of aged recipients: 138
- Number of blind and disabled recipients: 2,546
- Number of recipients under 18: 399
- Number of recipients between 18 and 64: 1,948
- Number of recipients older than 64: 337
- Number of recipients also receiving OASDI: 944
- Amount of payments (thousands of dollars): 1,266
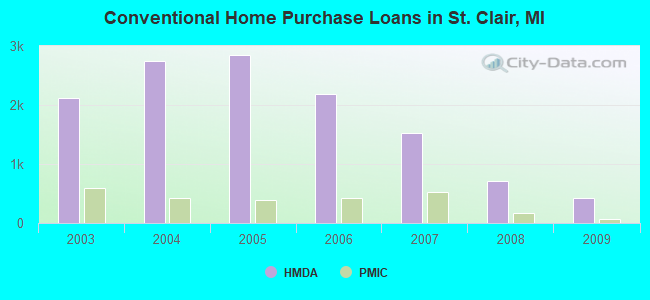
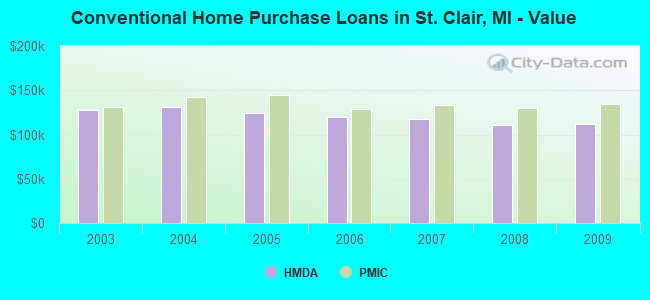
| Home Mortgage Disclosure Act Aggregated Statistics For Year 2009 (Based on 49 full tracts) | ||||||||||||||
| A) FHA, FSA/RHS & VA Home Purchase Loans | B) Conventional Home Purchase Loans | C) Refinancings | D) Home Improvement Loans | E) Loans on Dwellings For 5+ Families | F) Non-occupant Loans on < 5 Family Dwellings (A B C & D) | G) Loans On Manufactured Home Dwelling (A B C & D) | ||||||||
|---|---|---|---|---|---|---|---|---|---|---|---|---|---|---|
| Number | Average Value | Number | Average Value | Number | Average Value | Number | Average Value | Number | Average Value | Number | Average Value | Number | Average Value | |
| LOANS ORIGINATED | 515 | $100,891 | 430 | $112,230 | 2,658 | $138,230 | 237 | $30,295 | 10 | $764,600 | 239 | $121,841 | 63 | $76,048 |
| APPLICATIONS APPROVED, NOT ACCEPTED | 56 | $91,232 | 64 | $75,312 | 312 | $148,785 | 28 | $19,393 | 0 | $0 | 29 | $111,483 | 41 | $39,707 |
| APPLICATIONS DENIED | 166 | $101,464 | 106 | $74,774 | 1,035 | $148,868 | 149 | $28,799 | 0 | $0 | 84 | $115,095 | 56 | $62,036 |
| APPLICATIONS WITHDRAWN | 74 | $93,527 | 49 | $105,816 | 461 | $149,134 | 45 | $26,956 | 0 | $0 | 34 | $109,206 | 16 | $75,812 |
| FILES CLOSED FOR INCOMPLETENESS | 26 | $77,731 | 35 | $112,343 | 269 | $148,357 | 7 | $187,143 | 0 | $0 | 29 | $125,034 | 6 | $84,000 |
| Private Mortgage Insurance Companies Aggregated Statistics For Year 2009 (Based on 46 full tracts) | ||||||||
| A) Conventional Home Purchase Loans | B) Refinancings | C) Non-occupant Loans on < 5 Family Dwellings (A & B) | D) Loans On Manufactured Home Dwelling (A & B) | |||||
|---|---|---|---|---|---|---|---|---|
| Number | Average Value | Number | Average Value | Number | Average Value | Number | Average Value | |
| LOANS ORIGINATED | 76 | $134,684 | 46 | $164,261 | 4 | $137,000 | 0 | $0 |
| APPLICATIONS APPROVED, NOT ACCEPTED | 23 | $172,000 | 25 | $193,720 | 0 | $0 | 0 | $0 |
| APPLICATIONS DENIED | 23 | $132,696 | 21 | $163,143 | 0 | $0 | 1 | $91,000 |
| APPLICATIONS WITHDRAWN | 3 | $97,667 | 8 | $140,875 | 1 | $102,000 | 1 | $91,000 |
| FILES CLOSED FOR INCOMPLETENESS | 3 | $67,000 | 1 | $145,000 | 0 | $0 | 0 | $0 |
| Most common first names in St. Clair County, MI among deceased individuals | ||
| Name | Count | Lived (average) |
|---|---|---|
| John | 960 | 75.2 years |
| William | 815 | 74.1 years |
| Mary | 792 | 79.1 years |
| Robert | 629 | 69.2 years |
| George | 504 | 76.0 years |
| Charles | 491 | 73.5 years |
| James | 480 | 70.6 years |
| Helen | 419 | 80.0 years |
| Joseph | 383 | 74.6 years |
| Margaret | 376 | 79.6 years |
| Most common last names in St. Clair County, MI among deceased individuals | ||
| Last name | Count | Lived (average) |
|---|---|---|
| Smith | 413 | 74.9 years |
| Miller | 221 | 76.2 years |
| Brown | 156 | 76.4 years |
| Johnson | 134 | 74.4 years |
| Jones | 130 | 74.3 years |
| Williams | 112 | 76.2 years |
| Thompson | 91 | 73.4 years |
| Martin | 78 | 76.2 years |
| Wilson | 77 | 75.8 years |
| Moore | 76 | 76.1 years |
| Businesses in St. Clair County, MI | ||||
| Name | Count | Name | Count | |
|---|---|---|---|---|
| 7-Eleven | 2 | KFC | 4 | |
| ALDI | 1 | Kmart | 1 | |
| AT&T | 2 | Knights Inn | 1 | |
| Advance Auto Parts | 1 | Kohl's | 1 | |
| Aeropostale | 1 | Kroger | 4 | |
| American Eagle Outfitters | 1 | La-Z-Boy | 2 | |
| Applebee's | 1 | Lane Bryant | 1 | |
| Arby's | 3 | Lane Furniture | 4 | |
| AutoZone | 4 | LensCrafters | 1 | |
| Barnes & Noble | 1 | Little Caesars Pizza | 4 | |
| Baskin-Robbins | 1 | Long John Silver's | 2 | |
| Bath & Body Works | 1 | Lowe's | 1 | |
| Baymont Inn | 1 | Macy's | 1 | |
| Best Western | 1 | Marriott | 1 | |
| Blockbuster | 2 | MasterBrand Cabinets | 16 | |
| Buffalo Wild Wings | 1 | Maurices | 1 | |
| Burger King | 5 | McDonald's | 10 | |
| CVS | 5 | Meijer | 2 | |
| Carson Pirie Scott | 1 | Men's Wearhouse | 1 | |
| Catherines | 1 | Motherhood Maternity | 2 | |
| Chevrolet | 1 | New Balance | 1 | |
| Chuck E. Cheese's | 1 | Nike | 3 | |
| Circle K | 2 | Olive Garden | 1 | |
| Comfort Inn | 1 | Pac Sun | 1 | |
| Cracker Barrel | 1 | Payless | 2 | |
| Curves | 2 | Penske | 3 | |
| DHL | 1 | PetSmart | 1 | |
| Dairy Queen | 4 | Pizza Hut | 2 | |
| Days Inn | 1 | Quality | 1 | |
| Deb | 1 | RadioShack | 3 | |
| Decora Cabinetry | 1 | Red Lobster | 1 | |
| Dennys | 1 | Rite Aid | 4 | |
| Discount Tire | 1 | Ruby Tuesday | 1 | |
| DressBarn | 1 | Rue21 | 1 | |
| Dressbarn | 1 | Sam's Club | 1 | |
| Dunkin Donuts | 1 | Sears | 4 | |
| Famous Footwear | 1 | Spencer Gifts | 1 | |
| Fashion Bug | 2 | Sprint Nextel | 4 | |
| FedEx | 12 | Staples | 1 | |
| Finish Line | 1 | Starbucks | 1 | |
| Ford | 1 | Super 8 | 1 | |
| GNC | 5 | T-Mobile | 4 | |
| GameStop | 3 | T.J.Maxx | 1 | |
| Goodwill | 1 | Taco Bell | 5 | |
| Gymboree | 1 | Target | 1 | |
| H&R Block | 8 | Tim Hortons | 4 | |
| Hilton | 1 | Toys"R"Us | 1 | |
| Hobby Lobby | 1 | U-Haul | 8 | |
| Hollister Co. | 1 | UPS | 16 | |
| Home Depot | 1 | Vans | 1 | |
| Honda | 1 | Verizon Wireless | 1 | |
| Hot Topic | 1 | Victoria's Secret | 1 | |
| JCPenney | 1 | Walgreens | 2 | |
| Jimmy John's | 6 | Walmart | 1 | |
| Jones New York | 3 | Wendy's | 2 | |
| Journeys | 1 | White Castle | 1 | |
| Justice | 1 | YMCA | 1 | |
St. Clair County on our top lists:
- #10 on the list of "Top 101 counties with the largest increase in the number of deaths per 1000 residents 2000-2006 to 2007-2013 (pop. 50,000+)"
- #13 on the list of "Top 101 counties with the largest number of people moving out compared to moving in (pop. 50,000+)"
- #29 on the list of "Top 101 counties with the highest surface withdrawal of fresh water for public supply (pop. 50,000+)"
- #30 on the list of "Top 101 counties with the highest surface withdrawal of fresh water for public supply"
- #41 on the list of "Top 101 counties with the largest decrease in the number of births per 1000 residents 2000-2006 to 2007-2013 (pop 50,000+)"
- #44 on the list of "Top 101 counties with the highest total withdrawal of fresh water for public supply (pop. 50,000+)"
- #45 on the list of "Top 101 counties with the highest total withdrawal of fresh water for public supply"
- #73 on the list of "Top 101 counties with the lowest number of births per 1000 residents 2007-2013"
- #73 on the list of "Top 101 counties with the lowest number of births per 1000 residents 2007-2013 (pop 50,000+)"
- #96 on the list of "Top 101 counties with the lowest percentage of residents relocating from other counties between 2010 and 2011 (pop. 50,000+)"
- #97 on the list of "Top 101 counties with the highest percentage of residents relocating to foreign countries in 2011 (pop. 50,000+)"