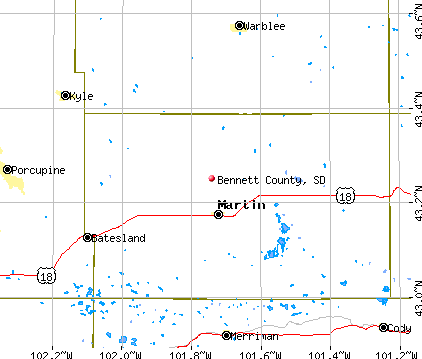
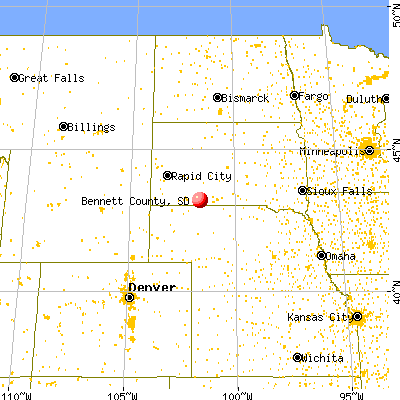
Bennett County, South Dakota (SD)
County owner-occupied free and clear houses and condos in 2010: 430
County owner-occupied houses and condos in 2000: 668
Renter-occupied apartments: 460 (it was 455 in 2000)
| % of renters here: | 41% |
| State: | 32% |
Land area: 1185 sq. mi.
Water area: 5.3 sq. mi.
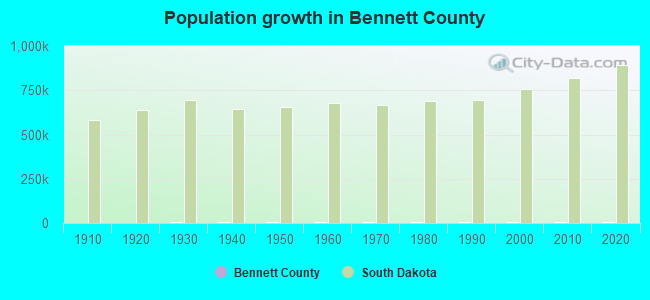
Population density: 3 people per square mile (very low).
Industries providing employment: Educational, health and social services (34.8%), Agriculture,forestry,fishing and hunting, and mining (15.1%), Retail trade (11.0%), Arts, entertainment, recreation, accommodation and food services (10.5%).
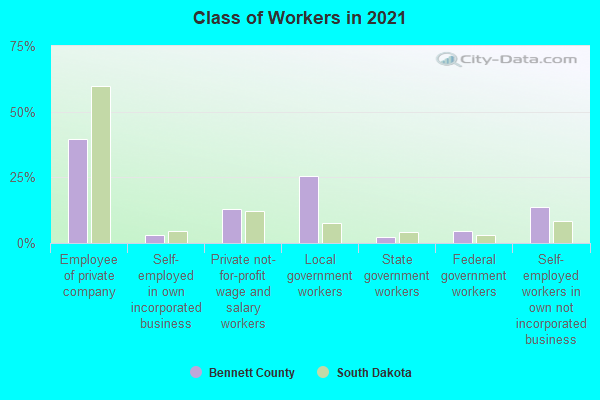
Type of workers:
- Private wage or salary: 55%
- Government: 31%
- Self-employed, not incorporated: 14%
- Unpaid family work: 0%
- OSM Map
- General Map
- Google Map
- MSN Map

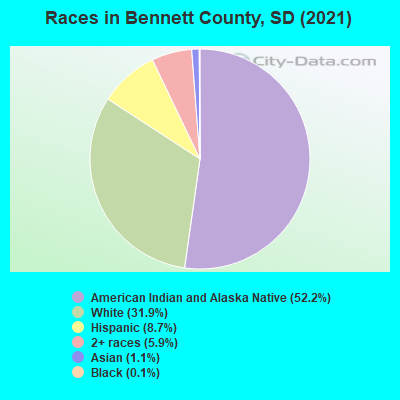
- 1,63648.3%American Indian and Alaska Native alone
- 1,24936.9%White Non-Hispanic Alone
- 34010.0%Hispanic or Latino
- 1103.2%Two or more races
- 451.3%Asian alone
- 50.1%Black Non-Hispanic Alone
| Median resident age: | 27.7 years |
| South Dakota median age: | 38.5 years |
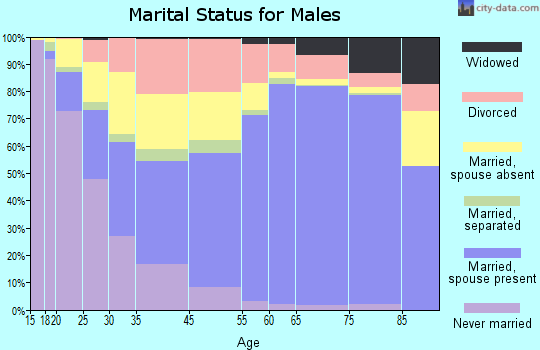
| Males: 1,635 | |
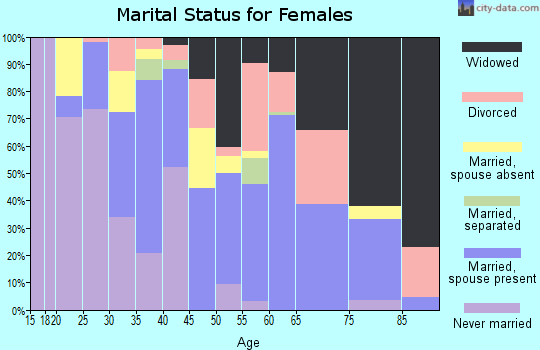
| Females: 1,830 |

 | Closet town to commute to Pine Ridge (12 replies) |
| SD Football playoffs tonight. (4 replies) |
| A question about Martin, South Dakota (17 replies) |
| Bennett County: | 3.0 people |
| South Dakota: | 2 people |
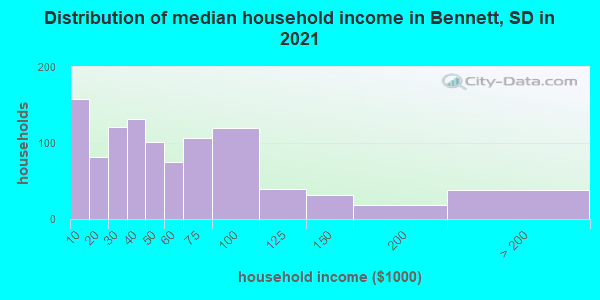
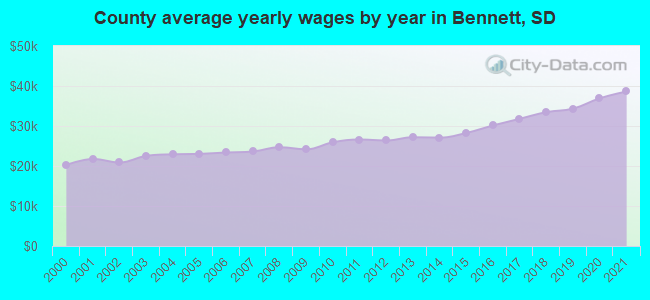
Estimated median household income in 2022: $44,995 ($25,313 in 1999)
| This county: | $44,995 |
| South Dakota: | $69,728 |
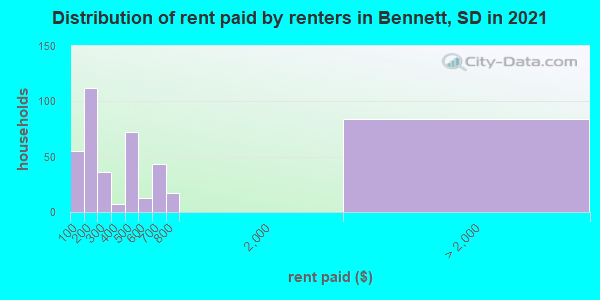
Median contract rent in 2022 for apartments: $193 (lower quartile is $140, upper quartile is $490)
| This county: | $193 |
| State: | $747 |
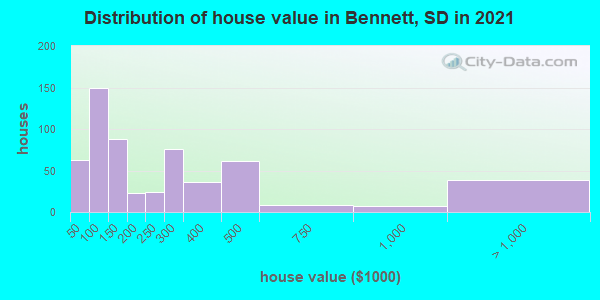
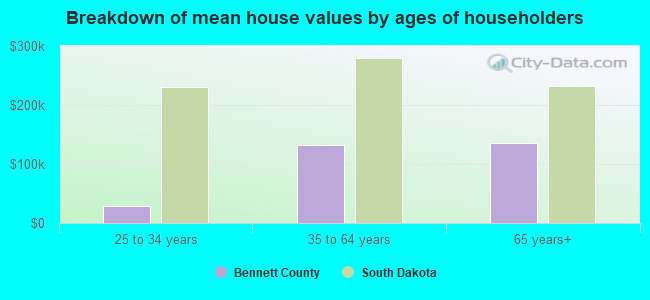
Estimated median house or condo value in 2022: $142,982 (it was $39,500 in 2000)
| Bennett: | $142,982 |
| South Dakota: | $245,000 |
Median monthly housing costs for homes and condos with a mortgage: $1,066
Median monthly housing costs for units without a mortgage: $505
Institutionalized population: 37
Crime in 2021 (reported by the sheriff's office or county police, not the county total):
- Murders: 0
- Rapes: 1
- Robberies: 0
- Assaults: 0
- Burglaries: 0
- Thefts: 1
- Auto thefts: 0
Crime in 2020 (reported by the sheriff's office or county police, not the county total):
- Murders: 0
- Rapes: 1
- Robberies: 0
- Assaults: 2
- Burglaries: 5
- Thefts: 0
- Auto thefts: 4
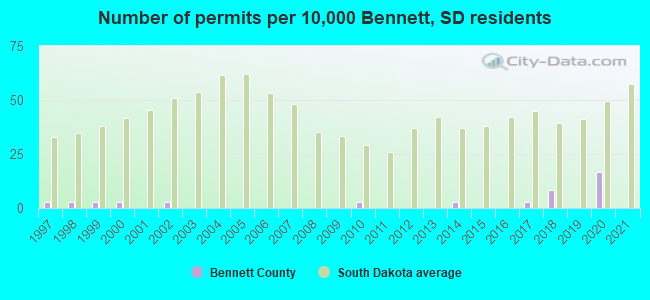
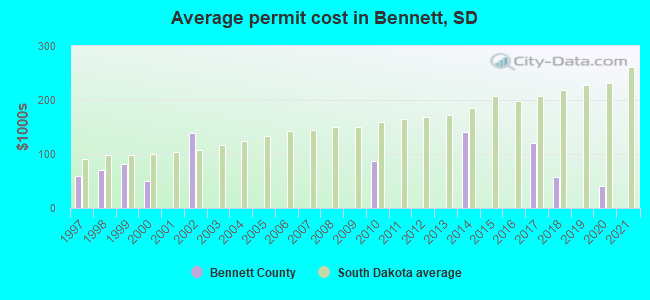
Single-family new house construction building permits:
- 2022: 0 buildings
- 2021: 0 buildings
- 2020: 6 buildings, average cost: $40,300
- 2019: 0 buildings
- 2018: 3 buildings, average cost: $58,300
- 2017: 1 building, cost: $120,000
- 2016: 0 buildings
- 2015: 0 buildings
- 2014: 1 building, cost: $140,000
- 2013: 0 buildings
- 2012: 0 buildings
- 2011: 0 buildings
- 2010: 1 building, cost: $87,000
- 2009: 0 buildings
- 2008: 0 buildings
- 2007: 0 buildings
- 2006: 0 buildings
- 2005: 0 buildings
- 2004: 0 buildings
- 2003: 0 buildings
- 2002: 1 building, cost: $138,800
- 2001: 0 buildings
- 2000: 1 building, cost: $50,000
- 1999: 1 building, cost: $82,000
- 1998: 1 building, cost: $70,000
- 1997: 1 building, cost: $60,000
Median real estate property taxes paid for housing units with mortgages in 2022: $1,730 (1.6%)
Median real estate property taxes paid for housing units with no mortgage in 2022: $1,233 (0.7%)
| Bennett County: | 30.1% |
| South Dakota: | 12.5% |
Median age of residents in 2022: 27.7 years old
(Males: 29.4 years old, Females: 26.4 years old)
(Median age for: White residents: 50.1 years old, American Indian residents: 22.9 years old, Asian residents: 33.9 years old, Hispanic or Latino residents: 16.5 years old, Other race residents: 18.9 years old)
Fair market rent in 2006 for a 1-bedroom apartment in Bennett County is $379 a month.
Fair market rent for a 2-bedroom apartment is $484 a month.
Fair market rent for a 3-bedroom apartment is $648 a month.
Neighboring counties: Niagara County, New York  , Orleans County, New York , St. Clair County, Michigan .
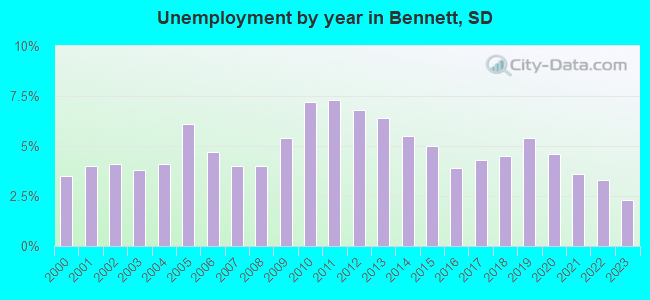
| Here: | 3.6% |
| South Dakota: | 2.0% |
Current college students: 170
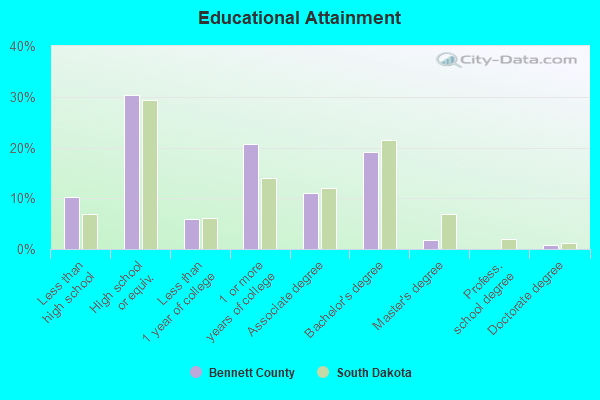
People 25 years of age or older with a high school degree or higher: 88.9%
People 25 years of age or older with a bachelor's degree or higher: 18.4%
Number of foreign born residents: 40 (34.0% naturalized citizens)
| Bennett County: | 1.2% |
| Whole state: | 3.5% |
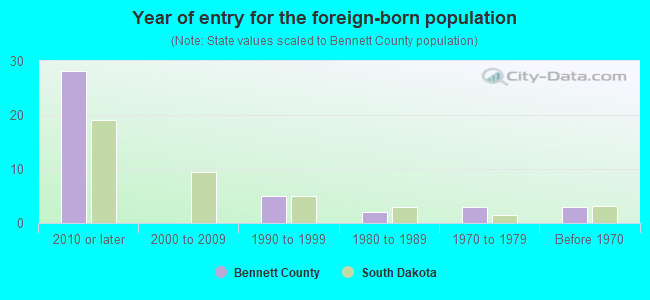
- Year of entry for the foreign-born population
- 382010 or later
- 02000 to 2009
- 61990 to 1999
- 21980 to 1989
- 31970 to 1979
- 3Before 1970
Mean travel time to work (commute): minutes
Percentage of county residents living and working in this county: 99.4%
Housing units in structures:
- One, detached: 1,105
- One, attached: 18
- Two: 18
- 3 or 4: 10
- 5 to 9: 32
- 10 to 19: 2
- 20 or more: 3
- Mobile homes: 81
Housing units in Bennett County with a mortgage: 209 (0 second mortgage, 0 home equity loan, 0 both second mortgage and home equity loan)
Houses without a mortgage: 0
| Here: | 100.0% with mortgage |
| State: | 98.3% with mortgage |
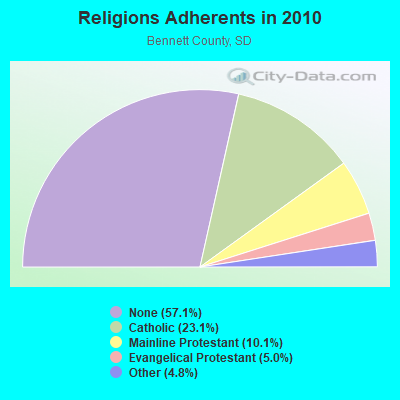
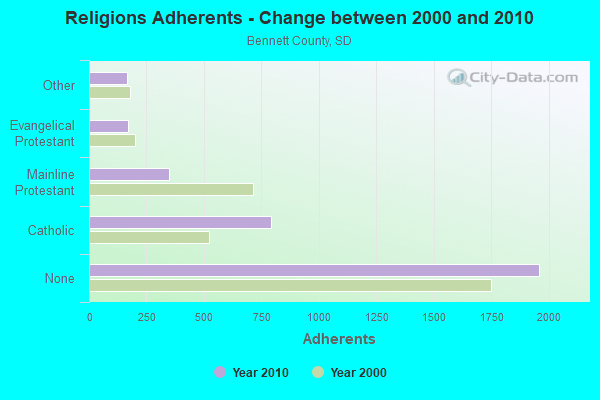
Religion statistics for Bennett County
| Religion | Adherents | Congregations |
|---|---|---|
| Catholic | 792 | 1 |
| Mainline Protestant | 346 | 3 |
| Evangelical Protestant | 170 | 3 |
| Other | 164 | 1 |
| None | 1,959 | - |
Source: Clifford Grammich, Kirk Hadaway, Richard Houseal, Dale E.Jones, Alexei Krindatch, Richie Stanley and Richard H.Taylor. 2012. 2010 U.S.Religion Census: Religious Congregations & Membership Study. Association of Statisticians of American Religious Bodies. Jones, Dale E., et al. 2002. Congregations and Membership in the United States 2000. Nashville, TN: Glenmary Research Center.
Food Environment Statistics:
| Bennett County: | 5.86 / 10,000 pop. |
| State: | 2.84 / 10,000 pop. |
| Bennett County: | 5.86 / 10,000 pop. |
| South Dakota: | 6.68 / 10,000 pop. |
| This county: | 5.86 / 10,000 pop. |
| State: | 9.21 / 10,000 pop. |
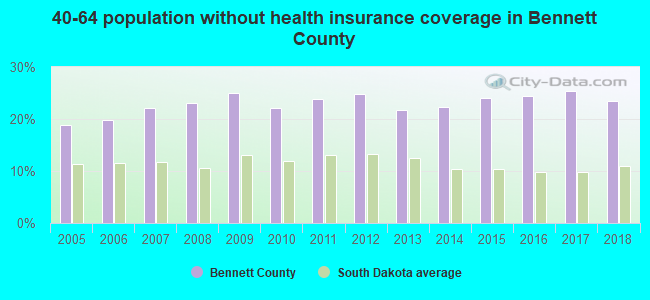
| Bennett County: | 10.4% |
| South Dakota: | 7.7% |
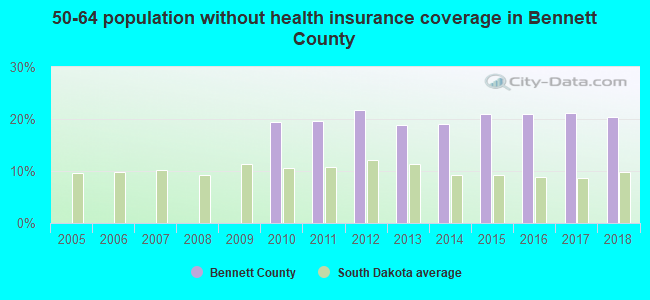
| Bennett County: | 33.6% |
| State: | 27.7% |
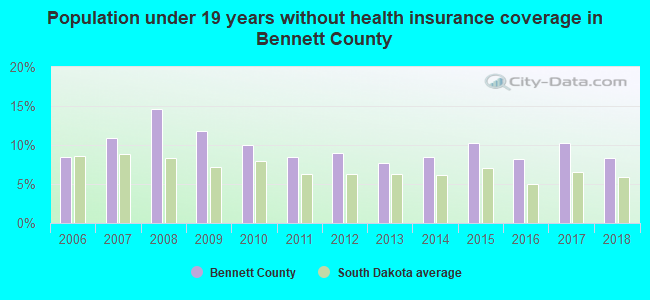
| Here: | 20.5% |
| State: | 14.9% |
Agriculture in Bennett County:
Average size of farms: 3148 acresAverage value of agricultural products sold per farm: $100,621
Average value of crops sold per acre for harvested cropland: $47.63
The value of nursery, greenhouse, floriculture, and sod as a percentage of the total market value of agricultural products sold: 0.00%
The value of livestock, poultry, and their products as a percentage of the total market value of agricultural products sold: 72.48%
Average total farm production expenses per farm: $90,087
Harvested cropland as a percentage of land in farms: 18.46%
Average market value of all machinery and equipment per farm: $107,213
The percentage of farms operated by a family or individual: 87.45%
Average age of principal farm operators: 54 years
Average number of cattle and calves per 100 acres of all land in farms: 6.27
Milk cows as a percentage of all cattle and calves: 0.03%
Corn for grain: 4399 harvested acres
All wheat for grain: 29384 harvested acres
Earthquake activity:
Bennett County-area historical earthquake activity is significantly above South Dakota state average. It is 332% greater than the overall U.S. average.On 8/18/1959 at 06:37:13, a magnitude 7.7 (7.7 UK, Class: Major, Intensity: VIII - XII) earthquake occurred 453.0 miles away from Bennett County center, causing $26,000,000 total damage
On 10/18/1984 at 15:30:23, a magnitude 5.5 (5.4 MB, 5.1 MS, 5.5 ML, Class: Moderate, Intensity: VI - VII) earthquake occurred 202.8 miles away from the county center
On 9/8/1984 at 00:59:31, a magnitude 5.1 (5.1 MB) earthquake occurred 219.6 miles away from the county center
On 3/4/1983 at 06:32:18, a magnitude 4.6 (4.4 MB, 4.6 LG, 4.4 ML, Class: Light, Intensity: IV - V) earthquake occurred 134.4 miles away from the county center
On 5/25/2003 at 07:32:33, a magnitude 4.0 (4.0 MB, Depth: 3.1 mi) earthquake occurred 11.5 miles away from Bennett County center
On 5/29/1984 at 20:18:32, a magnitude 5.0 (5.0 MB) earthquake occurred 221.6 miles away from the county center
Magnitude types: regional Lg-wave magnitude (LG), body-wave magnitude (MB), local magnitude (ML), surface-wave magnitude (MS)
Most recent natural disasters:
- South Dakota Covid-19 Pandemic, Incident Period: January 20, 2020, FEMA Id: 4527, Natural disaster type: Other
- South Dakota Severe Storms And Flooding, Incident Period: May 26, 2019 - June 7, 2019, FEMA Id: 4463, Natural disaster type: Storm, Flood
- South Dakota Severe Winter Storm, Snowstorm, And Flooding, Incident Period: March 13, 2019 - April 26, 2019, FEMA Id: 4440, Natural disaster type: Snowstorm, Winter Storm, Flood
- South Dakota Severe Storms, Tornado, and Flooding, Incident Period: May 24, 2013 to May 31, 2013, Major Disaster (Presidential) Declared DR-4125: June 28, 2013, FEMA Id: 4125, Natural disaster type: Storm, Tornado, Flood
- South Dakota Severe Winter Storm and Record and Near Record Snow, Incident Period: November 05, 2008 to November 07, 2008, Major Disaster (Presidential) Declared DR-1811: December 12, 2008, FEMA Id: 1811, Natural disaster type: Winter Storm, Snow
- South Dakota Severe Winter Storm and Record and Near Record Snow, Incident Period: May 01, 2008 to May 02, 2008, Major Disaster (Presidential) Declared DR-1759: May 22, 2008, FEMA Id: 1759, Natural disaster type: Winter Storm, Snow
- South Dakota Severe Winter Storm, Incident Period: April 18, 2006 to April 20, 2006, Major Disaster (Presidential) Declared DR-1647: June 05, 2006, FEMA Id: 1647, Natural disaster type: Winter Storm
- South Dakota Hurricane Katrina Evacuation, Incident Period: September 06, 2005 to October 01, 2005, Emergency Declared EM-3234: September 10, 2005, FEMA Id: 3234, Natural disaster type: Hurricane
- South Dakota Severe Storms/Flooding, Incident Period: February 03, 1997 to May 24, 1997, Major Disaster (Presidential) Declared DR-1173: April 07, 1997, FEMA Id: 1173, Natural disaster type: Storm, Flood
- South Dakota Severe Winter Storms/Blizzards, Incident Period: January 03, 1997 to January 31, 1997, Major Disaster (Presidential) Declared DR-1156: January 10, 1997, FEMA Id: 1156, Natural disaster type: Winter Storm, Blizzard
- 1 other natural disasters have been reported since 1953.
The number of natural disasters in Bennett County (11) is smaller than the US average (15).
Major Disasters (Presidential) Declared: 6
Emergencies Declared: 2
Causes of natural disasters: Winter Storms: 5, Floods: 4, Storms: 3, Snows: 2, Blizzard: 1, Drought: 1, Hurricane: 1, Snowstorm: 1, Tornado: 1, Other: 1 (Note: some incidents may be assigned to more than one category).
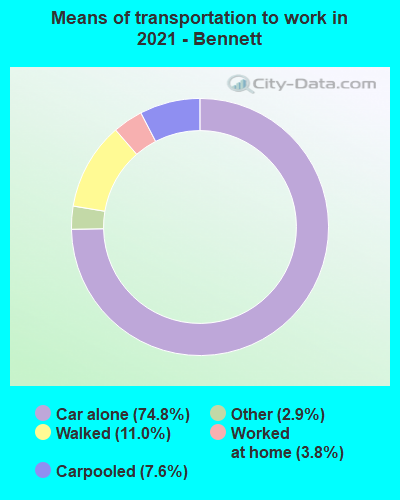
Means of transportation to work:
- Drove a car alone: 774 (78.7%)
- Carpooled: 44 (4.5%)
- Taxicab, motorcycle, or other means: 7 (0.7%)
- Walked: 85 (8.6%)
- Worked at home: 53 (5.4%)
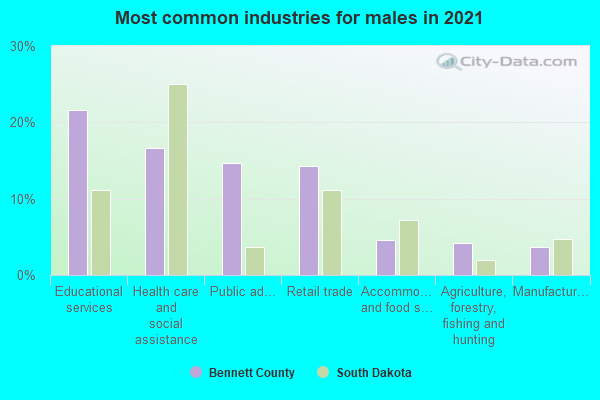
- Educational services (34%)
- Health care and social assistance (19%)
- Public administration (9%)
- Retail trade (7%)
- Manufacturing (4%)
- Agriculture, forestry, fishing and hunting (3%)
- Arts, entertainment, and recreation (3%)
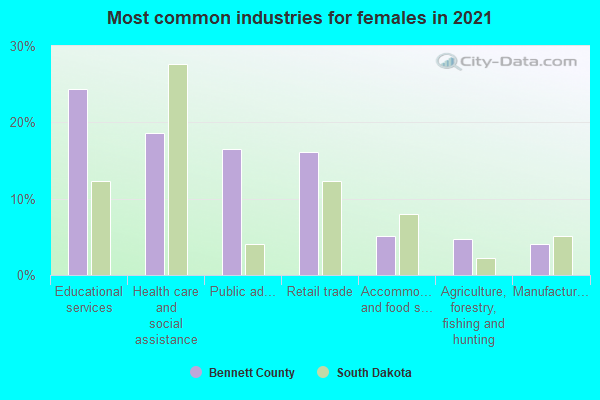
- Educational services (41%)
- Health care and social assistance (23%)
- Public administration (11%)
- Retail trade (9%)
- Manufacturing (5%)
- Agriculture, forestry, fishing and hunting (4%)
- Arts, entertainment, and recreation (3%)
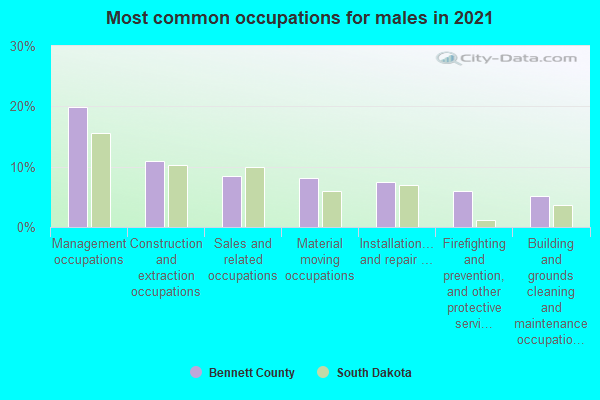
- Management occupations (24%)
- Sales and related occupations (12%)
- Construction and extraction occupations (9%)
- Production occupations (6%)
- Material moving occupations (6%)
- Farming, fishing, and forestry occupations (6%)
- Food preparation and serving related occupations (6%)
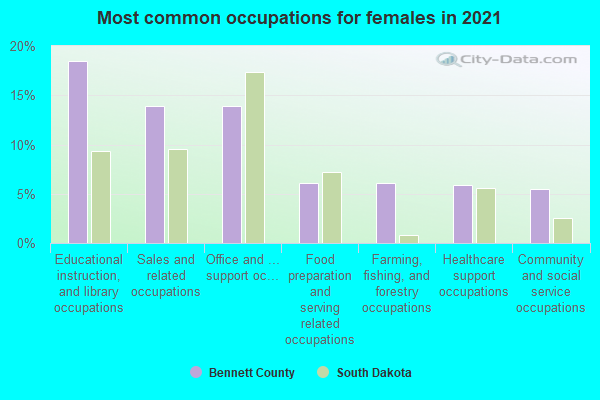
- Educational instruction, and library occupations (24%)
- Office and administrative support occupations (9%)
- Sales and related occupations (8%)
- Healthcare support occupations (7%)
- Production occupations (7%)
- Health diagnosing and treating practitioners and other technical occupations (6%)
- Management occupations (5%)
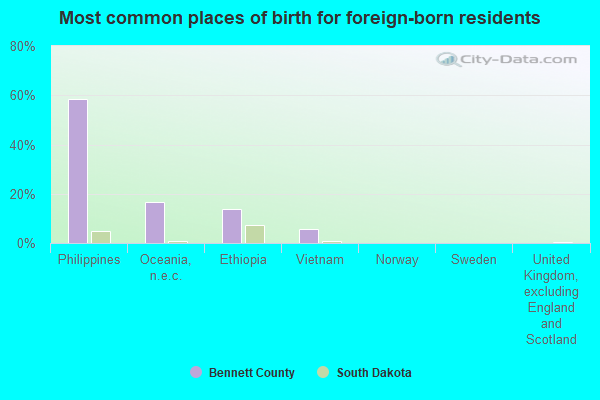
- Philippines (59%)
- Ethiopia (14%)
- Vietnam (11%)
- Oceania, n.e.c. (9%)
- Norway (0%)
- Sweden (0%)
- United Kingdom, excluding England and Scotland (0%)
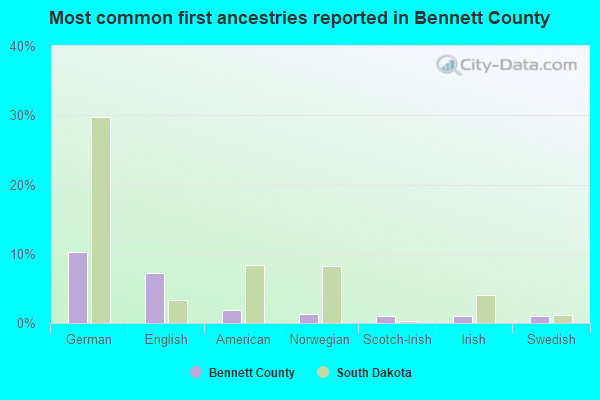
- German (17%)
- English (6%)
- American (2%)
- Scotch-Irish (1%)
- Swedish (1%)
- Irish (1%)
- Norwegian (1%)
39 people in wards in general hospitals for patients who have no usual home elsewhere
9 people in local jails and other confinement facilities (including police lockups)
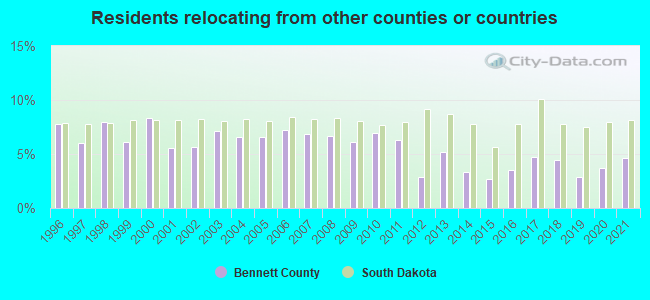
4.61% of this county's 2021 resident taxpayers lived in other counties in 2020 ($34,311 average adjusted gross income)
| Here: | 4.61% |
| South Dakota average: | 8.18% |
10 or fewer of this county's residents moved from foreign countries.
4.61% relocated from other counties in South Dakota ($34,311 average AGI)
10 or fewer of this county's residents relocated from other states.
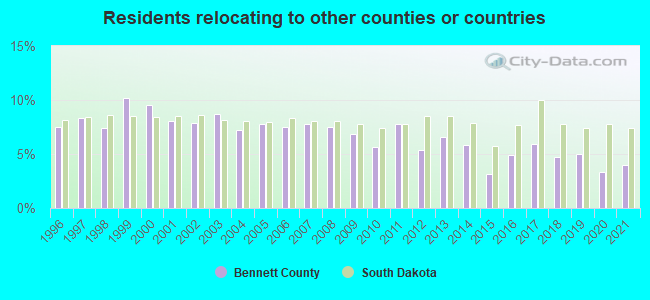
4.02% of this county's 2020 resident taxpayers moved to other counties in 2021 ($35,564 average adjusted gross income)
| Here: | 4.02% |
| South Dakota average: | 7.42% |
10 or fewer of this county's residents moved to foreign countries.
4.02% relocated to other counties in South Dakota ($35,564 average AGI)
10 or fewer of this county's residents relocated to other states.
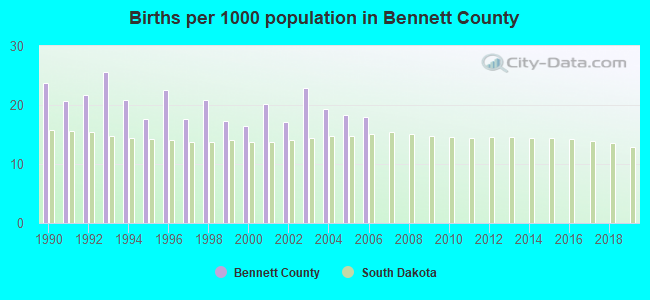
Births per 1000 population from 1990 to 1999: 20.9
Births per 1000 population from 2000 to 2006: 18.9
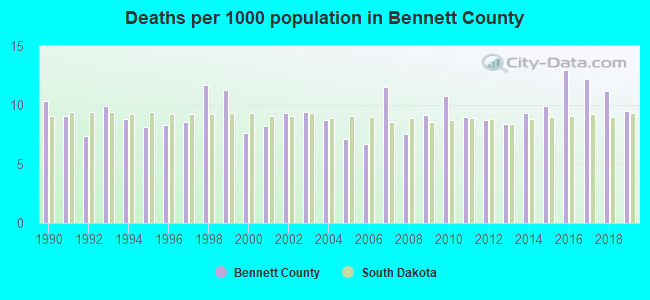
Deaths per 1000 population from 1990 to 1999: 9.3
Deaths per 1000 population from 2000 to 2009: 8.5
Deaths per 1000 population from 2010 to 2020: 10.3
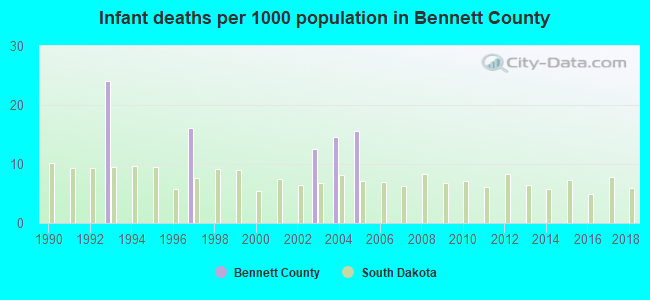
Infant deaths per 1000 live births from 1990 to 1999: 4.0
Infant deaths per 1000 live births from 2000 to 2006: 6.1
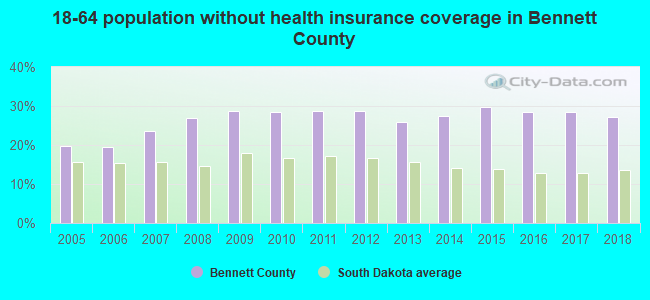
Persons under 19 years old without health insurance coverage in 2018: 8.3%
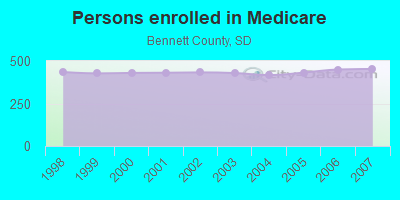
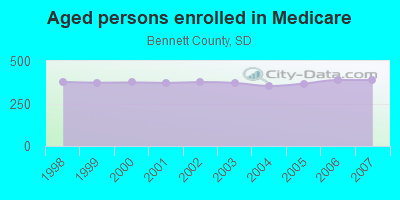
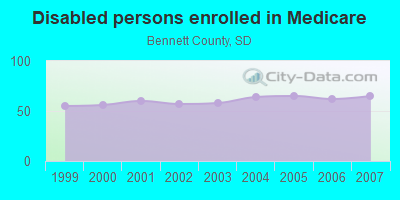
Persons enrolled in hospital insurance and/or supplemental medical insurance (Medicare) in July 1, 2007: 453 (388 aged, 65 disabled)
Children under 18 without health insurance coverage in 2007: 109 (10%)
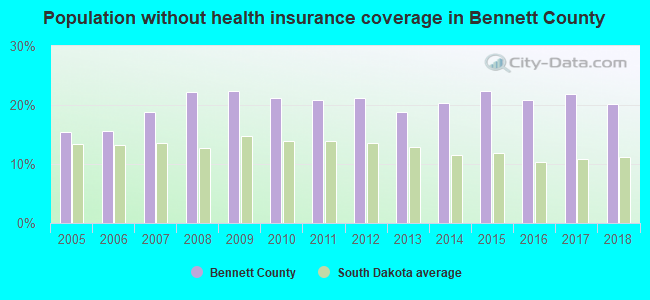
Population without health insurance coverage in 2000: 24%
Children under 18 without health insurance coverage in 2000: 20%
Short term general hospital admissions per 100,000 population in 2004: 4,458
Short term general hospital beds per 100,000 population in 2004: 1,760
Emergency room visits per 100,000 population in 2004: 60,193
General practice office based MDs per 100,000 population in 2005: 1,953
Medical specialist MDs per 100,000 population in 2005: 1,144
Dentists per 100,000 population in 1998: 56
Total births per 100,000 population, July 2005 - July 2006 : 30
Total deaths per 100,000 population, July 2005 - July 2006: 28
Limited-service eating places per 100,000 population in 2005 : 28
EPA green book nonattainment status in 2004-2006: 1
Crimes per 100,000 population in 1996: 1
Household type by relationship:
Households: 3,465- Male householders: 500 (124 living alone), Female householders: 561 (120 living alone)
453 spouses (453 opposite-sex spouses), 71 unmarried partners, (71 opposite-sex unmarried partners), 998 children (923 natural, 31 adopted, 41 stepchildren), 649 grandchildren, 4 brothers or sisters, 0 parents, 0 foster children, 187 other relatives, 4 non-relatives
- In group quarters: 42
Size of family households: 334 2-persons, 144 3-persons, 101 4-persons, 31 5-persons, 93 6-persons, 72 7-or-more-persons.
Size of nonfamily households: 244 1-person, 51 2-persons.
344 married couples with children.
319 single-parent households (83 men, 236 women).
87.4% of residents of Bennett speak English at home.
0.3% of residents speak Spanish at home (82% speak English very well, 18% speak English well).
0.7% of residents speak Asian or Pacific Island language at home (83% speak English well, 17% speak English not well).
11.2% of residents speak other language at home (91% speak English very well, 9% speak English well).
In fiscal year 2004:
Federal Government expenditure: $32,554,000 ($9,243 per capita)
Department of Defense expenditure: $213,000
Federal direct payments to individuals for retirement and disability: $6,738,000
Federal other direct payments to individuals: $3,784,000
Federal direct payments not to individuals: $8,621,000
Federal grants: $10,814,000
Federal procurement contracts: $1,399,000 ($0,000 Department of Defense)
Federal salaries and wages: $1,198,000 ($0,000 Department of Defense)
Federal Government direct loans: $180,000
Federal guaranteed/insured loans: $548,000
Federal Government insurance: $8,051,000
Population change from April 1, 2000 to July 1, 2005:
Births: 372| Here: | 104 per 1000 residents |
| State: | 72 per 1000 residents |
Deaths: 176
| Here: | 49 per 1000 residents |
| State: | 48 per 1000 residents |
Net international migration: 0
| Here: | 0 per 1000 residents |
| State: | +5 per 1000 residents |
Net internal migration: -176
| Here: | |
| State: |
Total withdrawal of fresh water for public supply: 0.24 millions of gallons per day (all from ground)
| Here: | 6.0 |
| State: | 7.0 |
| Here: | 5.3 |
| State: | 4.1 |
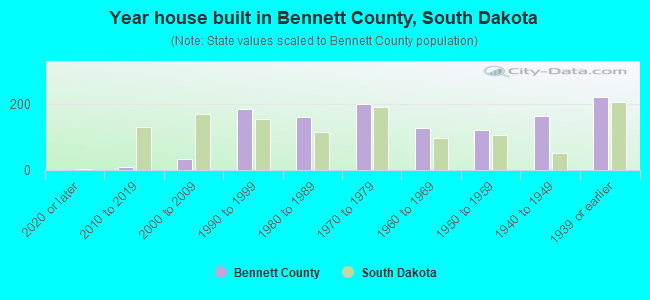
- Year house built in Bennett County, South Dakota
- 02020 or later
- 152010 to 2019
- 462000 to 2009
- 1491990 to 1999
- 1481980 to 1989
- 2311970 to 1979
- 1071960 to 1969
- 1291950 to 1959
- 1281940 to 1949
- 2541939 or earlier
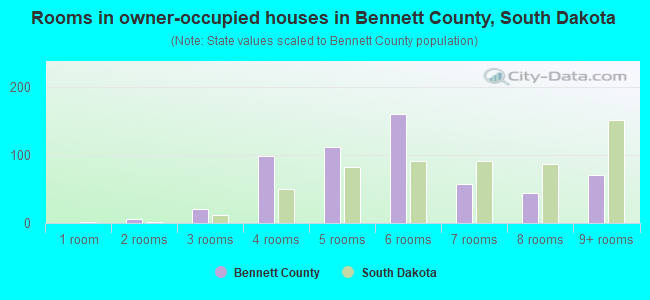
- Rooms in owner-occupied houses in Bennett County, South Dakota
- 01 room
- 02 rooms
- 303 rooms
- 934 rooms
- 1245 rooms
- 1816 rooms
- 667 rooms
- 688 rooms
- 949+ rooms
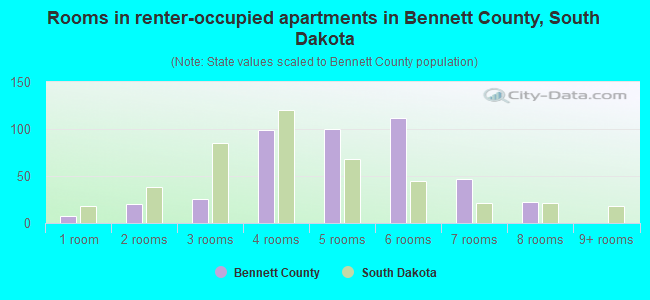
- Rooms in renter-occupied apartments in Bennett County, South Dakota
- 71 room
- 162 rooms
- 343 rooms
- 684 rooms
- 895 rooms
- 776 rooms
- 547 rooms
- 468 rooms
- 09+ rooms
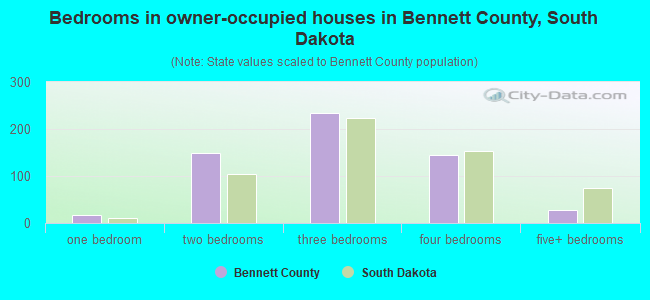
- Bedrooms in owner-occupied houses in Bennett County, South Dakota
- 0no bedroom
- 191 bedroom
- 1642 bedrooms
- 2463 bedrooms
- 2004 bedrooms
- 235+ bedrooms
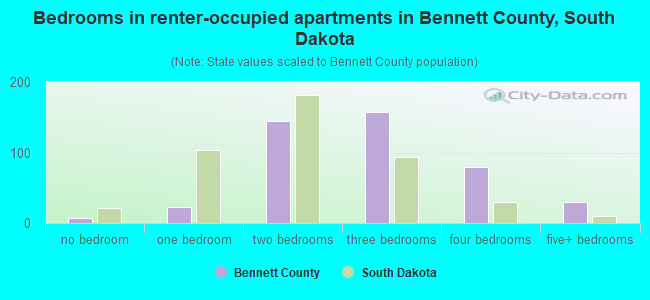
- Bedrooms in renter-occupied apartments in Bennett County, South Dakota
- 7no bedroom
- 271 bedroom
- 1052 bedrooms
- 1133 bedrooms
- 744 bedrooms
- 865+ bedrooms
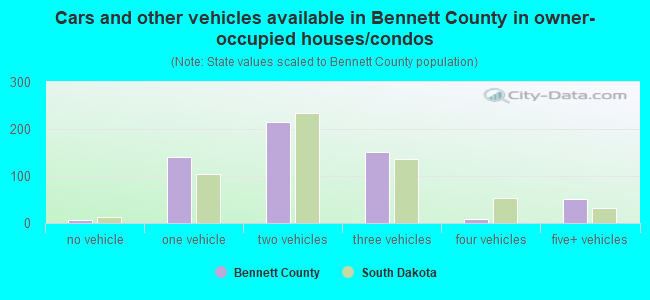
- Cars and other vehicles available in Bennett County in owner-occupied houses/condos
- 16no vehicle
- 1541 vehicle
- 2492 vehicles
- 1553 vehicles
- 154 vehicles
- 635+ vehicles
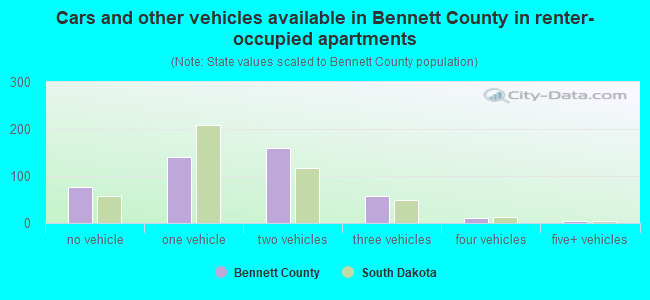
- Cars and other vehicles available in Bennett County in renter-occupied apartments
- 79no vehicle
- 1711 vehicle
- 1062 vehicles
- 323 vehicles
- 94 vehicles
- 65+ vehicles
99.7% of Bennett County residents lived in the same house 1 years ago.
Out of people who lived in different houses, 16% lived in this county.
Out of people who lived in different counties, 55% lived in South Dakota.
| Bennett County: | 99.7% |
| State average: | 86.6% |
Place of birth for U.S.-born residents:
- This state: 2,472
- Other state: 929
- Northeast: 22
- Midwest: 604
- South: 41
- West: 257
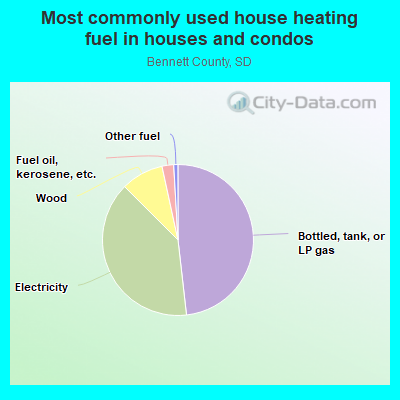
- 45.7%Bottled, tank, or LP gas
- 39.0%Electricity
- 13.3%Wood
- 1.3%Other fuel
- 0.7%Fuel oil, kerosene, etc.
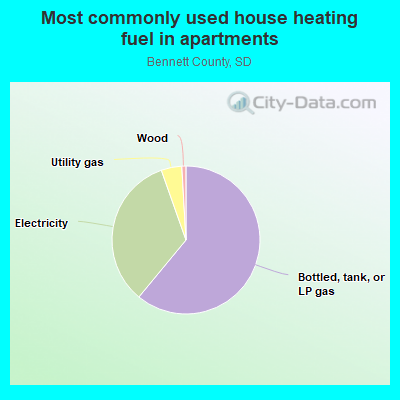
- 60.2%Bottled, tank, or LP gas
- 34.8%Electricity
- 4.0%Utility gas
- 1.0%Wood
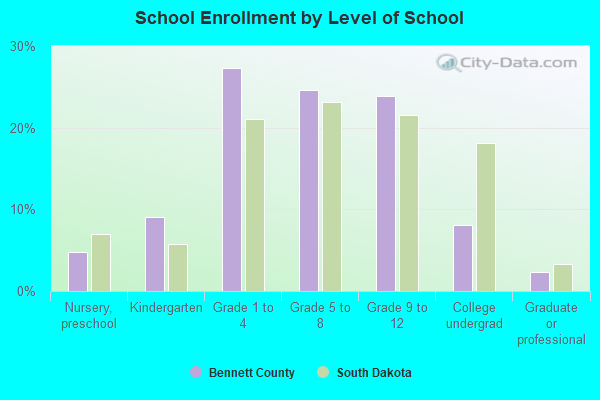
Private vs. public school enrollment:
| Here: | 0.0% |
| South Dakota: | 11.9% |
| Here: | 0.0% |
| South Dakota: | 7.2% |
| Here: | 18.3% |
| South Dakota: | 10.2% |
Bennett County government finances - Expenditure in 2018:
- Assistance and Subsidies - Public Welfare, Federal Categorical Assistance Programs: $2,000
- Charges - Other: $324,000
- Current Operations - Regular Highways: $4,755,000
Police Protection: $847,000
General Public Buildings: $810,000
Financial Administration: $562,000
General - Other: $538,000
Judicial and Legal Services: $336,000
Natural Resources - Other: $290,000
Central Staff Services: $214,000
Local Fire Protection: $93,000
Parks and Recreation: $69,000
Libraries: $66,000
Health - Other: $42,000
Public Welfare - Other: $15,000
Protective Inspection and Regulation - Other: $2,000
Public Welfare Institutions: $2,000
Transit Utilities: $2,000
- Federal Intergovernmental - General Local Government Support: $196,000
Other: $79,000
- General - Interest on Debt: $54,000
- Local Intergovernmental - Other: $17,000
Transit Utilities: $2,000
- Long Term Debt - Beginning Outstanding - Unspecified Public Purpose: $1,515,000
Outstanding Unspecified Public Purpose: $975,000
Retired Unspecified Public Purpose: $540,000
- Miscellaneous - Interest Earnings: $106,000
General Revenue - Other: $66,000
Sale of Property: $42,000
Fines and Forfeits: $7,000
Donations From Private Sources: $2,000
- Other Funds - Cash and Securities: $5,217,000
- State Intergovernmental - Other: $2,214,000
- Tax - Property: $5,747,000
Other: $196,000
Alcoholic Beverage License: $22,000
Other License: $17,000
- Total Salaries and Wages: $2,781,000
Bennett County government finances - Revenue in 2018:
- Assistance and Subsidies - Public Welfare, Federal Categorical Assistance Programs: $2,000
- Charges - Other: $324,000
- Current Operations - Regular Highways: $4,755,000
Police Protection: $847,000
General Public Buildings: $810,000
Financial Administration: $562,000
General - Other: $538,000
Judicial and Legal Services: $336,000
Natural Resources - Other: $290,000
Central Staff Services: $214,000
Local Fire Protection: $93,000
Parks and Recreation: $69,000
Libraries: $66,000
Health - Other: $42,000
Public Welfare - Other: $15,000
Protective Inspection and Regulation - Other: $2,000
Public Welfare Institutions: $2,000
Transit Utilities: $2,000
- Federal Intergovernmental - General Local Government Support: $196,000
Other: $79,000
- General - Interest on Debt: $54,000
- Local Intergovernmental - Other: $17,000
Transit Utilities: $2,000
- Long Term Debt - Beginning Outstanding - Unspecified Public Purpose: $1,515,000
Outstanding Unspecified Public Purpose: $975,000
Retired Unspecified Public Purpose: $540,000
- Miscellaneous - Interest Earnings: $106,000
General Revenue - Other: $66,000
Sale of Property: $42,000
Fines and Forfeits: $7,000
Donations From Private Sources: $2,000
- Other Funds - Cash and Securities: $5,217,000
- State Intergovernmental - Other: $2,214,000
- Tax - Property: $5,747,000
Other: $196,000
Alcoholic Beverage License: $22,000
Other License: $17,000
- Total Salaries and Wages: $2,781,000
Bennett County government finances - Debt in 2018:
- Assistance and Subsidies - Public Welfare, Federal Categorical Assistance Programs: $2,000
- Charges - Other: $324,000
- Current Operations - Regular Highways: $4,755,000
Police Protection: $847,000
General Public Buildings: $810,000
Financial Administration: $562,000
General - Other: $538,000
Judicial and Legal Services: $336,000
Natural Resources - Other: $290,000
Central Staff Services: $214,000
Local Fire Protection: $93,000
Parks and Recreation: $69,000
Libraries: $66,000
Health - Other: $42,000
Public Welfare - Other: $15,000
Protective Inspection and Regulation - Other: $2,000
Public Welfare Institutions: $2,000
Transit Utilities: $2,000
- Federal Intergovernmental - General Local Government Support: $196,000
Other: $79,000
- General - Interest on Debt: $54,000
- Local Intergovernmental - Other: $17,000
Transit Utilities: $2,000
- Long Term Debt - Beginning Outstanding - Unspecified Public Purpose: $1,515,000
Outstanding Unspecified Public Purpose: $975,000
Retired Unspecified Public Purpose: $540,000
- Miscellaneous - Interest Earnings: $106,000
General Revenue - Other: $66,000
Sale of Property: $42,000
Fines and Forfeits: $7,000
Donations From Private Sources: $2,000
- Other Funds - Cash and Securities: $5,217,000
- State Intergovernmental - Other: $2,214,000
- Tax - Property: $5,747,000
Other: $196,000
Alcoholic Beverage License: $22,000
Other License: $17,000
- Total Salaries and Wages: $2,781,000
Bennett County government finances - Cash and Securities in 2018:
- Assistance and Subsidies - Public Welfare, Federal Categorical Assistance Programs: $2,000
- Charges - Other: $324,000
- Current Operations - Regular Highways: $4,755,000
Police Protection: $847,000
General Public Buildings: $810,000
Financial Administration: $562,000
General - Other: $538,000
Judicial and Legal Services: $336,000
Natural Resources - Other: $290,000
Central Staff Services: $214,000
Local Fire Protection: $93,000
Parks and Recreation: $69,000
Libraries: $66,000
Health - Other: $42,000
Public Welfare - Other: $15,000
Protective Inspection and Regulation - Other: $2,000
Public Welfare Institutions: $2,000
Transit Utilities: $2,000
- Federal Intergovernmental - General Local Government Support: $196,000
Other: $79,000
- General - Interest on Debt: $54,000
- Local Intergovernmental - Other: $17,000
Transit Utilities: $2,000
- Long Term Debt - Beginning Outstanding - Unspecified Public Purpose: $1,515,000
Outstanding Unspecified Public Purpose: $975,000
Retired Unspecified Public Purpose: $540,000
- Miscellaneous - Interest Earnings: $106,000
General Revenue - Other: $66,000
Sale of Property: $42,000
Fines and Forfeits: $7,000
Donations From Private Sources: $2,000
- Other Funds - Cash and Securities: $5,217,000
- State Intergovernmental - Other: $2,214,000
- Tax - Property: $5,747,000
Other: $196,000
Alcoholic Beverage License: $22,000
Other License: $17,000
- Total Salaries and Wages: $2,781,000
Supplemental Security Income (SSI) in 2006:
- Total number of recipients: 162
- Number of aged recipients: 8
- Number of blind and disabled recipients: 154
- Number of recipients under 18: 31
- Number of recipients between 18 and 64: 97
- Number of recipients older than 64: 34
- Number of recipients also receiving OASDI: 46
- Amount of payments (thousands of dollars): 75
| Most common first names in Bennett County, SD among deceased individuals | ||
| Name | Count | Lived (average) |
|---|---|---|
| John | 26 | 75.3 years |
| Mary | 22 | 82.6 years |
| James | 15 | 73.8 years |
| Charles | 15 | 74.5 years |
| Robert | 15 | 73.1 years |
| William | 13 | 76.1 years |
| Frank | 11 | 75.5 years |
| George | 9 | 77.2 years |
| Joseph | 9 | 71.7 years |
| Anna | 8 | 81.2 years |
| Most common last names in Bennett County, SD among deceased individuals | ||
| Last name | Count | Lived (average) |
|---|---|---|
| Nelson | 14 | 71.3 years |
| Marshall | 13 | 64.2 years |
| Bettelyoun | 11 | 67.1 years |
| Richards | 9 | 63.7 years |
| Dubray | 9 | 61.7 years |
| Livermont | 8 | 76.8 years |
| Hicks | 8 | 77.1 years |
| Harris | 7 | 71.9 years |
| Phipps | 6 | 72.0 years |
| Byrne | 6 | 85.0 years |
| Businesses in Bennett County, SD | ||||
| Name | Count | Name | Count | |
|---|---|---|---|---|
| Ace Hardware | 1 | H&R Block | 1 | |
| Ford | 1 | True Value | 1 | |