Estimated zip code population in 2022: 7,870 Zip code population in 2010: 8,428 Zip code population in 2000: 7,867
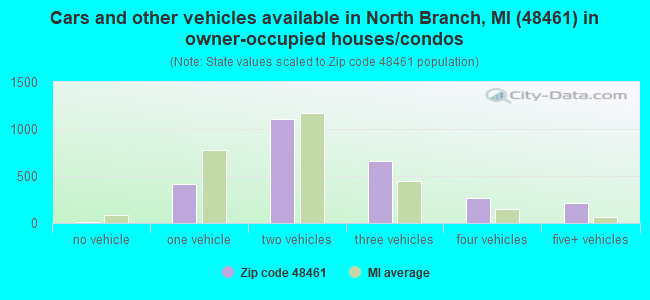
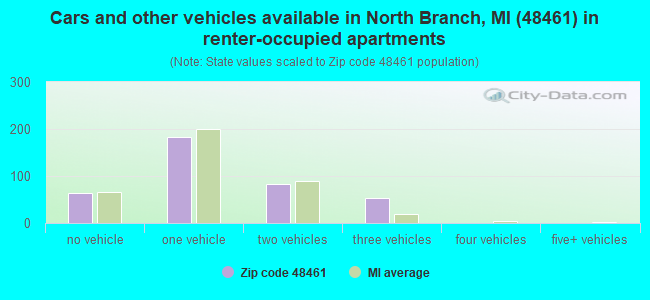
Houses and condos: 3,189 Renter-occupied apartments: 383
% of renters here:
12%
State:
27%
March 2022 cost of living index in zip code 48461: 89.9 (less than average, U.S. average is 100)
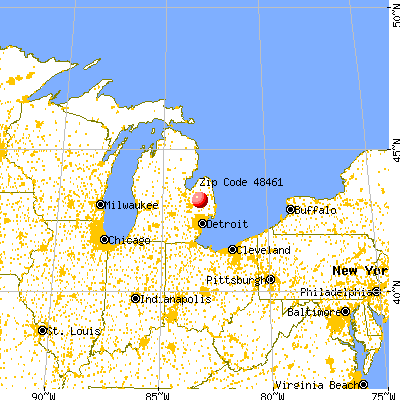
Land area: 83.6 sq. mi. Water area: 0.6 sq. mi.
Population density: 94 people per square mile
(very low).
OSM Map
General Map
Google Map
MSN Map
OSM Map
General Map
Google Map
MSN Map
OSM Map
General Map
Google Map
MSN Map
OSM Map
General Map
Google Map
MSN Map
Please wait while loading the map...
Real estate property taxes paid for housing units in 2022:
This zip code:
0.9% ($1,940)
Michigan:
1.2% ($2,746)
Median real estate property taxes paid for housing units with mortgages in 2022: $1,883 (0.8%) Median real estate property taxes paid for housing units with no mortgage in 2022: $2,193 (1.2%)
Business Search- 14 Million verified businesses
Males: 3,768
(47.9%)
Females: 4,101
(52.1%)
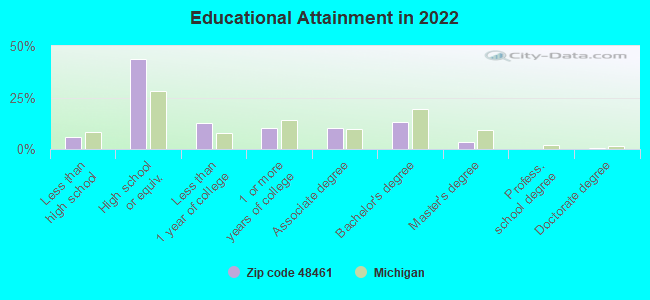
For population 25 years and over in 48461:
High school or higher: 93.5%
Bachelor's degree or higher: 17.2%
Graduate or professional degree: 4.1%
Unemployed: 3.2%
Mean travel time to work (commute): 34.6 minutes
For population 15 years and over in 48461:
Never married: 26.4%
Now married: 61.0%
Separated: 0.8%
Widowed: 5.1%
Divorced: 6.7%
Zip code 48461 compared to state average:
Black race population percentage significantly below state average.
Hispanic race population percentage significantly below state average.
Foreign-born population percentage significantly below state average.
Renting percentage below state average.
Length of stay since moving in significantly above state average.
Percentage of population with a bachelor's degree or higher below state average.
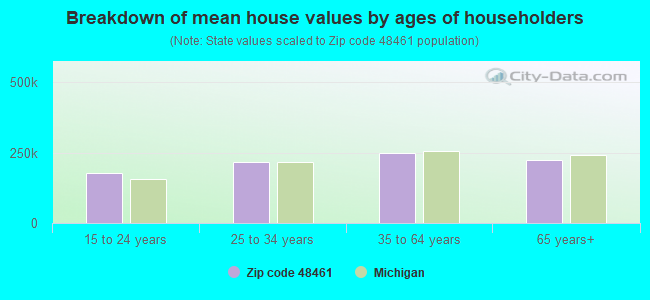
Estimated median house/condo value in 2022: $216,254
48461:
$216,254
Michigan:
$224,400
According to our research of Michigan and other state lists, there were 25 registered sex offenders living in 48461 zip code as of May 24, 2024. The ratio of all residents to sex offenders in zip code 48461 is 343 to 1. The ratio of registered sex offenders to all residents in this zip code is near the state average.
Median resident age:
This zip code:
43.7 years
Michigan median age:
40.3 years
Average household size:
This zip code:
2.6 people
Michigan:
2.4 people
Averages for the 2020 tax year for zip code 48461, filed in 2021:
Average Adjusted Gross Income (AGI) in 2020: $54,642 (Individual Income Tax Returns)
Here:
$54,642
State:
$68,945
Salary/wage: $49,457 (reported on 80.4% of returns)
Here:
$49,457
State:
$57,142
(% of AGI for various income ranges: 959.0% for AGIs below $25k, 3002.3% for AGIs $25k-50k, 5916.3% for AGIs $50k-75k, 8586.5% for AGIs $75k-100k, 15656.4% for AGIs $100k-200k)
Taxable interest for individuals: $847 (reported on 24.9% of returns)
This zip code:
$847
Michigan:
$1,630
(% of AGI for various income ranges: 9.9% for AGIs below $25k, 20.6% for AGIs $25k-50k, 36.5% for AGIs $50k-75k, 27.9% for AGIs $75k-100k, 40.6% for AGIs $100k-200k)
Ordinary dividends: $2,740 (reported on 11.0% of returns)
Here:
$2,740
State:
$6,972
(% of AGI for various income ranges: 7.3% for AGIs below $25k, 14.2% for AGIs $25k-50k, 25.5% for AGIs $50k-75k, 70.0% for AGIs $75k-100k, 119.1% for AGIs $100k-200k)
Net capital gain/loss in AGI: +$4,766 (reported on 10.7% of returns)
Here:
+$4,766
State:
+$20,064
(% of AGI for various income ranges: 4.1% for AGIs below $25k, 19.9% for AGIs $25k-50k, 63.9% for AGIs $50k-75k, 81.5% for AGIs $75k-100k, 263.6% for AGIs $100k-200k)
Profit/loss from business: +$8,450 (reported on 15.2% of returns)
Here:
+$8,450
State:
+$11,172
(% of AGI for various income ranges: 96.7% for AGIs below $25k, 100.0% for AGIs $25k-50k, 148.6% for AGIs $50k-75k, 172.9% for AGIs $75k-100k, 577.6% for AGIs $100k-200k)
Taxable individual retirement arrangement distribution: $11,676 (reported on 7.6% of returns)
48461:
$11,676
Michigan:
$19,803
(% of AGI for various income ranges: 56.8% for AGIs below $25k, 72.1% for AGIs $25k-50k, 132.9% for AGIs $50k-75k, 219.7% for AGIs $75k-100k, 272.1% for AGIs $100k-200k)
Total itemized deductions: $28,050 (reported on 2.6% of returns)
Here:
$28,050
State:
$34,117
(% of AGI for various income ranges: 97.9% for AGIs $25k-50k, 137.1% for AGIs $75k-100k, 477.3% for AGIs $100k-200k)
Charity contributions: $9,925 (reported on 2.1% of returns)
Here:
$9,925
State:
$13,548
(% of AGI for various income ranges: 52.9% for AGIs $50k-75k, 162.1% for AGIs $100k-200k)
Taxes paid: $6,600 (reported on 2.6% of returns)
48461:
$6,600
State:
$7,972
(% of AGI for various income ranges: 19.4% for AGIs $25k-50k, 35.6% for AGIs $75k-100k, 117.6% for AGIs $100k-200k)
Earned income credit: $2,232 (reported on 14.9% of returns)
Here:
$2,232
State:
$2,251
(% of AGI for various income ranges: 79.6% for AGIs below $25k, 66.2% for AGIs $25k-50k, 3.3% for AGIs $50k-75k)
Percentage of individuals using paid preparers for their 2020 taxes: 95.5%
Here:
96%
State:
93%
(% for various income ranges: 93.7% for AGIs below $25k, 96.8% for AGIs $25k-50k, 96.8% for AGIs $50k-75k, 95.5% for AGIs $75k-100k, 97.9% for AGIs $100k-200k, 83.3% for AGIs over 200k)
Averages for the 2012 tax year for zip code 48461, filed in 2013:
Average Adjusted Gross Income (AGI) in 2012: $45,679 (Individual Income Tax Returns)
Here:
$45,679
State:
$55,609
Salary/wage: $39,149 (reported on 86.8% of returns)
Here:
$39,149
State:
$46,782
(% of AGI for various income ranges: 65.0% for AGIs below $25k, 71.5% for AGIs $25k-50k, 76.9% for AGIs $50k-75k, 81.8% for AGIs $75k-100k, 80.5% for AGIs $100k-200k, 51.0% for AGIs over 200k)
Taxable interest for individuals: $917 (reported on 28.2% of returns)
This zip code:
$917
Michigan:
$1,491
(% of AGI for various income ranges: 1.1% for AGIs below $25k, 0.5% for AGIs $25k-50k, 0.7% for AGIs $50k-75k, 0.3% for AGIs $75k-100k, 0.3% for AGIs $100k-200k, 1.1% for AGIs over 200k)
Ordinary dividends: $1,380 (reported on 12.1% of returns)
Here:
$1,380
State:
$6,225
(% of AGI for various income ranges: 0.4% for AGIs below $25k, 0.4% for AGIs $25k-50k, 0.2% for AGIs $50k-75k, 0.2% for AGIs $75k-100k, 0.6% for AGIs $100k-200k)
Net capital gain/loss in AGI: +$1,878 (reported on 9.9% of returns)
Here:
+$1,878
State:
+$9,326
(% of AGI for various income ranges: 0.4% for AGIs $50k-75k, 0.1% for AGIs $75k-100k, 1.6% for AGIs $100k-200k)
Profit/loss from business: +$7,655 (reported on 15.1% of returns)
Here:
+$7,655
State:
+$11,523
(% of AGI for various income ranges: 6.8% for AGIs below $25k, 3.1% for AGIs $25k-50k, 1.3% for AGIs $50k-75k, 0.6% for AGIs $75k-100k, 3.5% for AGIs $100k-200k)
Taxable individual retirement arrangement distribution: $9,961 (reported on 8.5% of returns)
48461:
$9,961
Michigan:
$15,298
(% of AGI for various income ranges: 2.1% for AGIs below $25k, 1.9% for AGIs $25k-50k, 1.9% for AGIs $50k-75k, 2.0% for AGIs $75k-100k, 2.1% for AGIs $100k-200k)
Total itemized deductions: $17,766 (21% of AGI, reported on 27.9% of returns)
Here:
$17,766
State:
$21,628
Here:
21.4% of AGI
State:
18.4% of AGI
(% of AGI for various income ranges: 8.7% for AGIs below $25k, 9.4% for AGIs $25k-50k, 10.5% for AGIs $50k-75k, 12.4% for AGIs $75k-100k, 12.6% for AGIs $100k-200k, 9.8% for AGIs over 200k)
Charity contributions: $2,808 (reported on 21.9% of returns)
Here:
$2,808
State:
$4,225
(% of AGI for various income ranges: 0.6% for AGIs below $25k, 0.9% for AGIs $25k-50k, 1.2% for AGIs $50k-75k, 1.5% for AGIs $75k-100k, 1.8% for AGIs $100k-200k, 2.3% for AGIs over 200k)
Taxes paid: $5,500 (reported on 27.9% of returns)
48461:
$5,500
State:
$8,327
(% of AGI for various income ranges: 1.5% for AGIs below $25k, 2.1% for AGIs $25k-50k, 2.8% for AGIs $50k-75k, 3.8% for AGIs $75k-100k, 5.1% for AGIs $100k-200k, 4.7% for AGIs over 200k)
Earned income credit: $2,339 (reported on 18.9% of returns)
Here:
$2,339
State:
$2,306
(% of AGI for various income ranges: 6.3% for AGIs below $25k, 1.4% for AGIs $25k-50k)
Percentage of individuals using paid preparers for their 2012 taxes: 61.9%
Here:
62%
State:
57%
(% for various income ranges: 56.3% for AGIs below $25k, 66.7% for AGIs $25k-50k, 65.5% for AGIs $50k-75k, 63.9% for AGIs $75k-100k, 66.7% for AGIs $100k-200k, 66.7% for AGIs over 200k)
Averages for the 2004 tax year for zip code 48461, filed in 2005:
Average Adjusted Gross Income (AGI) in 2004: $41,681 (Individual Income Tax Returns)
Here:
$41,681
State:
$48,204
Salary/wage: $38,937 (reported on 88.8% of returns)
Here:
$38,937
State:
$42,791
(% of AGI for various income ranges: 124.4% for AGIs below $10k, 69.2% for AGIs $10k-25k, 78.1% for AGIs $25k-50k, 85.6% for AGIs $50k-75k, 89.8% for AGIs $75k-100k, 80.5% for AGIs over 100k)
Taxable interest for individuals: $764 (reported on 43.8% of returns)
This zip code:
$764
Michigan:
$1,725
(% of AGI for various income ranges: 4.4% for AGIs below $10k, 2.2% for AGIs $10k-25k, 0.8% for AGIs $25k-50k, 0.6% for AGIs $50k-75k, 0.4% for AGIs $75k-100k, 0.6% for AGIs over 100k)
Taxable dividends: $958 (reported on 17.0% of returns)
Here:
$958
State:
$3,420
(% of AGI for various income ranges: 2.2% for AGIs below $10k, 0.7% for AGIs $10k-25k, 0.4% for AGIs $25k-50k, 0.3% for AGIs $50k-75k, 0.1% for AGIs $75k-100k, 0.6% for AGIs over 100k)
Net capital gain/loss: +$3,857 (reported on 12.0% of returns)
Here:
+$3,857
State:
+$8,532
(% of AGI for various income ranges: -0.7% for AGIs below $10k, 0.4% for AGIs $10k-25k, 0.9% for AGIs $25k-50k, 0.7% for AGIs $50k-75k, 1.2% for AGIs $75k-100k, 2.2% for AGIs over 100k)
Profit/loss from business: +$7,046 (reported on 16.6% of returns)
Here:
+$7,046
State:
+$9,547
(% of AGI for various income ranges: 5.7% for AGIs below $10k, 5.6% for AGIs $10k-25k, 4.0% for AGIs $25k-50k, 2.0% for AGIs $50k-75k, 1.3% for AGIs $75k-100k, 2.8% for AGIs over 100k)
IRA payment deduction: $2,403 (reported on 1.7% of returns)
48461:
$2,403
Michigan:
$2,875
Self-employed pension: $8,167 (reported on 0.3% of returns)
Here:
$8,167
Michigan:
$13,826
Total itemized deductions: $15,748 (23% of AGI, reported on 39.1% of returns)
Here:
$15,748
State:
$18,509
Here:
23.5% of AGI
State:
20.7% of AGI
(% of AGI for various income ranges: 13.2% for AGIs below $10k, 9.0% for AGIs $10k-25k, 15.1% for AGIs $25k-50k, 15.7% for AGIs $50k-75k, 15.6% for AGIs $75k-100k, 15.1% for AGIs over 100k)
Charity contributions deductions: $1,964 (3% of AGI, reported on 33.5% of returns)
Here:
$1,964
State:
$3,365
Here:
2.8% of AGI
State:
3.6% of AGI
(% of AGI for various income ranges: 0.8% for AGIs below $10k, 1.0% for AGIs $10k-25k, 1.4% for AGIs $25k-50k, 1.5% for AGIs $50k-75k, 1.9% for AGIs $75k-100k, 1.9% for AGIs over 100k)
Total tax: $4,758 (reported on 76.4% of returns)
48461:
$4,758
State:
$7,691
(% of AGI for various income ranges: 3.5% for AGIs below $10k, 4.0% for AGIs $10k-25k, 6.0% for AGIs $25k-50k, 7.7% for AGIs $50k-75k, 9.6% for AGIs $75k-100k, 14.6% for AGIs over 100k)
Earned income credit: $1,768 (reported on 12.7% of returns)
Here:
$1,768
State:
$1,737
Percentage of individuals using paid preparers for their 2004 taxes: 66.4%
Here:
66%
State:
60%
(% for various income ranges: 55.3% for AGIs below $10k, 67.8% for AGIs $10k-25k, 68.7% for AGIs $25k-50k, 69.4% for AGIs $50k-75k, 71.4% for AGIs $75k-100k, 70.1% for AGIs over 100k)
Likely homosexual households (counted as self-reported same-sex unmarried-partner households)
Lesbian couples: 0.2% of all households
Gay men: 0.3% of all households
Household received Food Stamps/SNAP in the past 12 months: 326 Household did not receive Food Stamps/SNAP in the past 12 months: 2,735
Women who had a birth in the past 12 months: 83 (81 now married, 3 unmarried) Women who did not have a birth in the past 12 months: 1,635 (730 now married, 903 unmarried)
Housing units in zip code 48461 with a mortgage: 1,776 (86 second mortgage, 3 home equity loan, 75 both second mortgage and home equity loan) Houses without a mortgage: 16
Median monthly owner costs for units with a mortgage: $1,378 Median monthly owner costs for units without a mortgage: $507
Residents with income below the poverty level in 2022:
This zip code:
10.2%
Whole state:
13.4%
Residents with income below 50% of the poverty level in 2022:
This zip code:
4.6%
Whole state:
6.9%
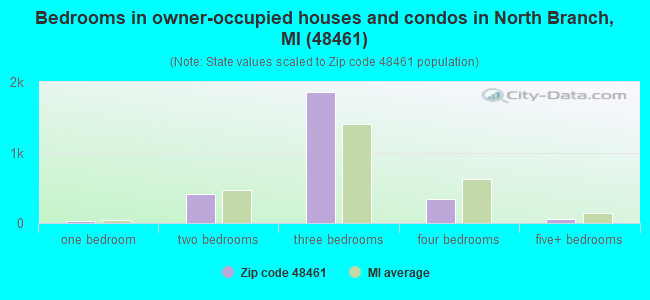
Median number of rooms in houses and condos:
Here:
6.4
State:
6.5
Median number of rooms in apartments:
Here:
4.9
State:
4.3
Notable locations in this zip code not listed on our city pages
Notable locations in zip code 48461: Washakie Golf and RV Resort (A), Sutter's Recreation Area (B), North Branch Library (C), North Branch Police Department (D), Lapeer County Emergency Medical Services Station 2 (E), Deerfield Township Fire Department (F), North Branch Township Fire Department (G). Display/hide their locations on the map
Churches in zip code 48461 include: East Deerfield Church (A), Saint Marys Church (B), Country Christian Church (C), Faith Community Church (D), New Life in Christ Lutheran Church (E), Saint James Lutheran Church (F), Methodist Church (G), Saints Peter and Paul Catholic Church (H), First Baptist Church (I). Display/hide their locations on the map
Cemeteries: Greenwood Cemetery (1), Saints Peter and Paul Cemetery (2), Bottom Creek Cemetery (3), Saint Mary's Catholic Cemetery (4), North Branch-Burlington Cemetery (5), Maple Grove Cemetery (6), Westlawn Cemetery (7). Display/hide their locations on the map
Streams, rivers, and creeks: Elm Creek (A), Gravel Creek (B), Indian Creek (C), Squaw Creek (D), Bottom Creek (E), Cedar Creek (F), Degrow Branch (G). Display/hide their locations on the map
1,035 married couples with children.
298 single-parent households (12 men, 286 women).
97.5% of residents of 48461 zip code speak English at home.
1.7% of residents speak Spanish at home (55% very well, 45% well).
0.2% of residents speak other Indo-European language at home (100% very well).
0.2% of residents speak other language at home (100% well).
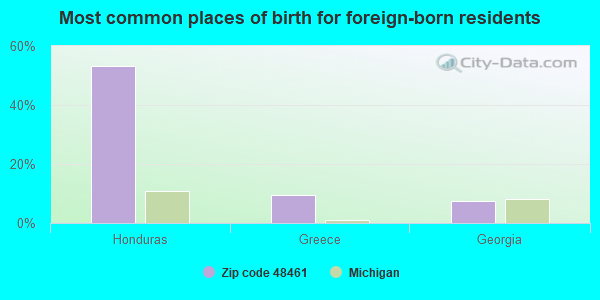
Foreign born population: 105 (1.3%) (32.9% of them are naturalized citizens)
This zip code:
1.3%
Whole state:
6.9%
53%Honduras
9%Greece
7%Georgia
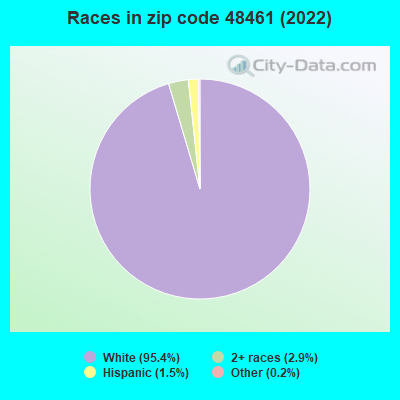
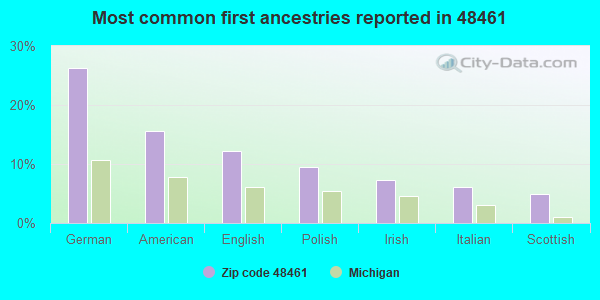
26%German
16%American
12%English
9%Polish
7%Irish
6%Italian
5%Scottish
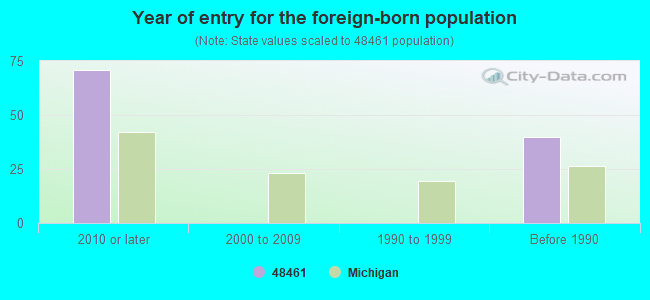
Year of entry for the foreign-born population
712010 or later
02000 to 2009
01990 to 1999
40Before 1990
Facilities with environmental interests located in this zip code:
AUDIX INC (4337 MILL ST in NORTH BRANCH, MI)
Conditionally Exempt Small Quantity Generators, less than 100 kg/month of hazardous waste (Resource Conservation and Recovery Act (tracking hazardous waste)) Business NAICS classification: OTHER COMMERCIAL AND SERVICE INDUSTRY MACHINERY MANUFACTURING. Organizations: CHRISTOPHER MAY (BUSINESS OWNER (CONTACT/OPERATOR)
Alternative names: PRECISION PREP & FINESSE
DICK COUITER INC (6672 LAKE PLEASANT RD in NORTH BRANCH, MI)
Conditionally Exempt Small Quantity Generators, less than 100 kg/month of hazardous waste (Resource Conservation and Recovery Act (tracking hazardous waste)) - notification
Housing units lacking complete plumbing facilities: 1.3% Housing units lacking complete kitchen facilities: 0.2%
37.0%Bottled, tank, or LP gas
36.7%Utility gas
10.1%Wood
7.5%Electricity
5.9%Other fuel
2.0%Fuel oil, kerosene, etc.
0.8%No fuel used
Population in 1990: 6,106. Population change in the 1990s: +1,761 (+28.8%).
Place of birth for U.S.-born residents:
This state: 7,031
Northeast: 198
Midwest: 191
South: 212
West: 119
61% of the 48461 zip code residents lived in the same house 5 years ago. Out of people who lived in different houses, 56% lived in this county. Out of people who lived in different counties, 50% lived in Michigan.
94% of the 48461 zip code residents lived in the same house 1 year ago. Out of people who lived in different houses, 68% moved from this county. Out of people who lived in different houses, 30% moved from different county within same state. Out of people who lived in different houses, 1% moved from different state.
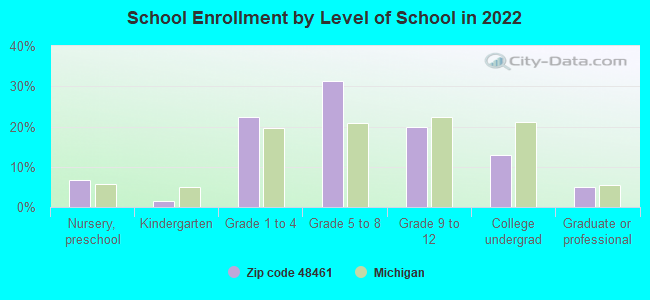
Private vs. public school enrollment:
Students in private schools in grades 1 to 8 (elementary and middle school): 84
Here:
11.1%
Michigan:
12.4%
Students in private schools in grades 9 to 12 (high school): 29
Here:
10.6%
Michigan:
9.8%
Students in private undergraduate colleges: 34
Here:
18.5%
Michigan:
14.9%
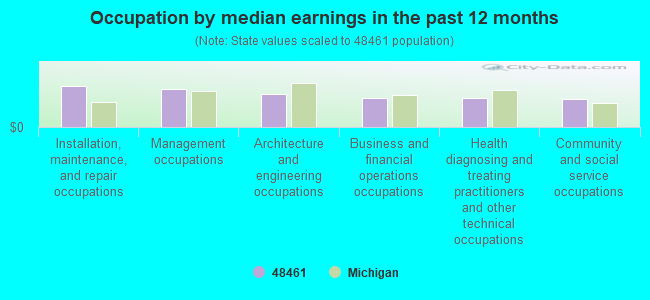
Occupation by median earnings in the past 12 months ($)
98,011Installation, maintenance, and repair occupations
91,314Management occupations
80,607Architecture and engineering occupations
71,091Business and financial operations occupations
70,512Health diagnosing and treating practitioners and other technical occupations
67,553Community and social service occupations
Top industries in this zip code by the number of employees in 2005:
Administrative and Support and Waste Management and Remediation Services: Professional Employer Organizations (100-249 employees: 1 establishment)
Accommodation and Food Services: Limited-Service Restaurants (20-49: 2)
Health Care and Social Assistance: Offices of Dentists (20-49: 1, 10-19: 1, 1-4: 1)
Educational Services: Elementary and Secondary Schools (20-49: 1)
Health Care and Social Assistance: Ambulance Services (20-49: 1)
Wholesale Trade: Farm and Garden Machinery and Equipment Merchant Wholesalers (20-49: 1)
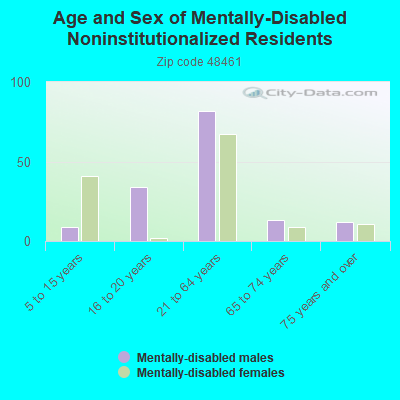
People in group quarters in 2010:
48 people in group homes intended for adults
People in group quarters in 2000:
29 people in other group homes
22 people in agriculture workers' dormitories on farms
5 people in homes for the mentally retarded
Fatal accident statistics in 2011:
Fatal accident count: 2
Vehicles involved in fatal accidents: 4
Fatal accidents caused by drunken drivers: 1
Fatalities: 3
Persons involved in fatal accidents: 8
Pedestrians involved in fatal accidents: 0
Fatal accident statistics in 2010:
Fatal accident count: 2
Vehicles involved in fatal accidents: 5
Fatal accidents caused by drunken drivers: 0
Fatalities: 2
Persons involved in fatal accidents: 10
Pedestrians involved in fatal accidents: 0
Home Mortgage Disclosure Act Aggregated Statistics For Year 2009 (Based on 2 full and 6 partial tracts)
A) FHA, FSA/RHS & VA Home Purchase Loans
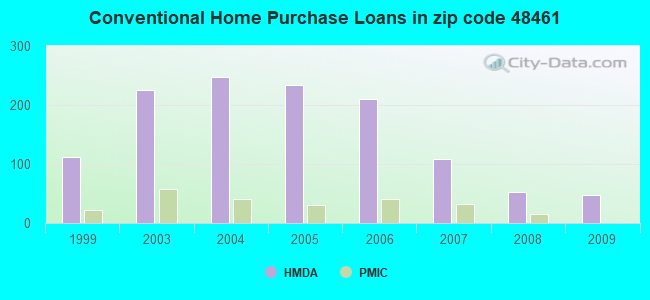
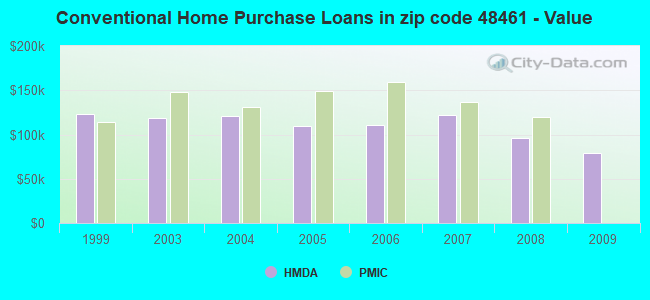
B) Conventional Home Purchase Loans
C) Refinancings
D) Home Improvement Loans
F) Non-occupant Loans on < 5 Family Dwellings (A B C & D)
G) Loans On Manufactured Home Dwelling (A B C & D)
Number
Average Value
Number
Average Value
Number
Average Value
Number
Average Value
Number
Average Value
Number
Average Value
LOANS ORIGINATED
58
$90,111
48
$78,635
247
$118,825
13
$64,707
42
$74,608
20
$85,930
APPLICATIONS APPROVED, NOT ACCEPTED
0
$0
2
$129,955
30
$152,635
2
$10,330
2
$66,860
0
$0
APPLICATIONS DENIED
13
$79,802
6
$103,595
112
$135,839
14
$22,586
9
$117,654
8
$85,891
APPLICATIONS WITHDRAWN
10
$77,914
2
$96,915
53
$150,751
0
$0
2
$55,205
6
$78,120
FILES CLOSED FOR INCOMPLETENESS
2
$83,570
3
$76,547
16
$168,414
0
$0
1
$37,800
2
$56,040
Aggregated Statistics For Year 2008 (Based on 2 full and 6 partial tracts)
A) FHA, FSA/RHS & VA Home Purchase Loans
B) Conventional Home Purchase Loans
C) Refinancings
D) Home Improvement Loans
F) Non-occupant Loans on < 5 Family Dwellings (A B C & D)
G) Loans On Manufactured Home Dwelling (A B C & D)
Number
Average Value
Number
Average Value
Number
Average Value
Number
Average Value
Number
Average Value
Number
Average Value
LOANS ORIGINATED
58
$109,871
53
$95,750
172
$135,261
34
$30,684
16
$82,328
24
$91,083
APPLICATIONS APPROVED, NOT ACCEPTED
8
$96,288
2
$71,585
24
$126,923
9
$18,897
0
$0
7
$85,977
APPLICATIONS DENIED
30
$77,380
29
$75,892
186
$142,298
32
$44,468
11
$116,274
36
$60,402
APPLICATIONS WITHDRAWN
18
$73,292
3
$40,413
43
$160,860
6
$154,162
1
$189,010
11
$69,453
FILES CLOSED FOR INCOMPLETENESS
5
$94,854
2
$110,625
10
$172,389
4
$8,850
0
$0
0
$0
Aggregated Statistics For Year 2007 (Based on 2 full and 6 partial tracts)
A) FHA, FSA/RHS & VA Home Purchase Loans
B) Conventional Home Purchase Loans
C) Refinancings
D) Home Improvement Loans
F) Non-occupant Loans on < 5 Family Dwellings (A B C & D)
G) Loans On Manufactured Home Dwelling (A B C & D)
Number
Average Value
Number
Average Value
Number
Average Value
Number
Average Value
Number
Average Value
Number
Average Value
LOANS ORIGINATED
21
$138,562
108
$122,229
315
$119,274
52
$47,870
44
$112,603
41
$72,910
APPLICATIONS APPROVED, NOT ACCEPTED
3
$91,493
9
$144,002
84
$137,678
16
$58,549
6
$116,255
4
$102,125
APPLICATIONS DENIED
15
$134,762
43
$105,878
323
$131,519
47
$69,815
18
$108,648
44
$98,006
APPLICATIONS WITHDRAWN
7
$109,930
6
$100,850
86
$138,622
6
$33,668
4
$78,735
7
$101,400
FILES CLOSED FOR INCOMPLETENESS
0
$0
3
$87,383
31
$181,425
4
$158,912
2
$130,765
0
$0
Aggregated Statistics For Year 2006 (Based on 2 full and 6 partial tracts)
A) FHA, FSA/RHS & VA Home Purchase Loans
B) Conventional Home Purchase Loans
C) Refinancings
D) Home Improvement Loans
F) Non-occupant Loans on < 5 Family Dwellings (A B C & D)
G) Loans On Manufactured Home Dwelling (A B C & D)
Number
Average Value
Number
Average Value
Number
Average Value
Number
Average Value
Number
Average Value
Number
Average Value
LOANS ORIGINATED
18
$135,577
211
$111,112
463
$121,183
61
$40,061
46
$103,706
66
$76,074
APPLICATIONS APPROVED, NOT ACCEPTED
4
$100,132
32
$89,672
99
$129,840
8
$40,792
4
$190,225
10
$69,615
APPLICATIONS DENIED
2
$216,665
85
$115,677
404
$139,438
56
$53,421
17
$213,710
56
$86,997
APPLICATIONS WITHDRAWN
2
$178,690
53
$112,309
167
$134,221
15
$63,227
3
$107,843
14
$86,415
FILES CLOSED FOR INCOMPLETENESS
0
$0
10
$136,892
84
$152,417
1
$12,230
8
$150,479
1
$105,620
Aggregated Statistics For Year 2005 (Based on 2 full and 6 partial tracts)
A) FHA, FSA/RHS & VA Home Purchase Loans
B) Conventional Home Purchase Loans
C) Refinancings
D) Home Improvement Loans
F) Non-occupant Loans on < 5 Family Dwellings (A B C & D)
G) Loans On Manufactured Home Dwelling (A B C & D)
Number
Average Value
Number
Average Value
Number
Average Value
Number
Average Value
Number
Average Value
Number
Average Value
LOANS ORIGINATED
34
$137,565
234
$109,328
520
$132,659
49
$39,398
54
$101,180
59
$75,156
APPLICATIONS APPROVED, NOT ACCEPTED
8
$92,858
41
$104,837
110
$129,433
9
$41,117
4
$197,128
18
$83,587
APPLICATIONS DENIED
6
$98,693
82
$104,229
417
$130,958
61
$58,526
8
$88,188
51
$73,526
APPLICATIONS WITHDRAWN
5
$136,918
27
$115,131
217
$144,822
28
$142,064
12
$123,575
4
$101,598
FILES CLOSED FOR INCOMPLETENESS
0
$0
9
$88,696
119
$152,415
4
$66,728
4
$108,875
3
$79,650
Aggregated Statistics For Year 2004 (Based on 2 full and 6 partial tracts)
A) FHA, FSA/RHS & VA Home Purchase Loans
B) Conventional Home Purchase Loans
C) Refinancings
D) Home Improvement Loans
F) Non-occupant Loans on < 5 Family Dwellings (A B C & D)
G) Loans On Manufactured Home Dwelling (A B C & D)
Number
Average Value
Number
Average Value
Number
Average Value
Number
Average Value
Number
Average Value
Number
Average Value
LOANS ORIGINATED
37
$128,064
248
$120,858
649
$127,653
65
$59,725
52
$95,607
67
$82,914
APPLICATIONS APPROVED, NOT ACCEPTED
4
$135,922
43
$97,102
140
$120,913
13
$35,117
13
$103,915
24
$55,960
APPLICATIONS DENIED
4
$140,768
91
$81,271
390
$120,975
73
$58,123
16
$68,556
79
$62,345
APPLICATIONS WITHDRAWN
12
$137,952
24
$102,903
212
$128,213
9
$65,002
7
$107,950
11
$87,976
FILES CLOSED FOR INCOMPLETENESS
7
$159,399
8
$137,134
120
$137,322
6
$78,322
0
$0
5
$124,974
Aggregated Statistics For Year 2003 (Based on 2 full and 6 partial tracts)
A) FHA, FSA/RHS & VA Home Purchase Loans
B) Conventional Home Purchase Loans
C) Refinancings
D) Home Improvement Loans
F) Non-occupant Loans on < 5 Family Dwellings (A B C & D)
Number
Average Value
Number
Average Value
Number
Average Value
Number
Average Value
Number
Average Value
LOANS ORIGINATED
38
$124,361
226
$118,622
1,234
$120,279
57
$21,579
64
$95,546
APPLICATIONS APPROVED, NOT ACCEPTED
5
$159,630
15
$108,137
197
$117,196
7
$16,396
8
$101,174
APPLICATIONS DENIED
9
$142,250
85
$91,939
514
$107,830
49
$24,791
18
$89,942
APPLICATIONS WITHDRAWN
8
$155,185
20
$121,890
220
$115,780
6
$31,803
7
$132,483
FILES CLOSED FOR INCOMPLETENESS
6
$134,138
3
$61,230
51
$130,549
3
$13,453
0
$0
Aggregated Statistics For Year 1999 (Based on 3 partial tracts)
A) FHA, FSA/RHS & VA Home Purchase Loans
B) Conventional Home Purchase Loans
C) Refinancings
D) Home Improvement Loans
F) Non-occupant Loans on < 5 Family Dwellings (A B C & D)
2002 - 2018 National Fire Incident Reporting System (NFIRS) incidents
Based on the data from the years 2002 - 2018 the average number of fire incidents per year is 28. The highest number of fires - 88 took place in 2003, and the least - 6 in 2014. The data has a dropping trend.
When looking into fire subcategories, the most reports belonged to: Structure Fires (38.5%), and Outside Fires (26.6%).
Fire incident types reported to NFIRS in Zip Code 48461


 Nearest zip codes: 48727, 48412, 48760, 48435, 48421, 48446.


 Based on the data from the years 2002 - 2018 the average number of fire incidents per year is 28. The highest number of fires - 88 took place in 2003, and the least - 6 in 2014. The data has a dropping trend.
 When looking into fire subcategories, the most reports belonged to: Structure Fires (38.5%), and Outside Fires (26.6%).