Estimated zip code population in 2022: 2,582 Zip code population in 2010: 2,083 Zip code population in 2000: 2,231
Houses and condos: 915 Renter-occupied apartments: 50
% of renters here:
6%
State:
27%
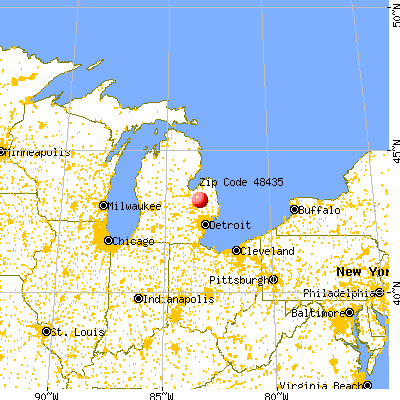
March 2022 cost of living index in zip code 48435: 81.9 (low, U.S. average is 100)
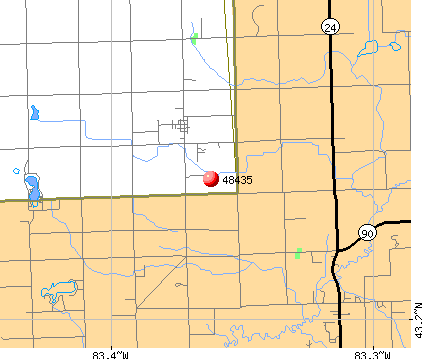
Land area: 25.0 sq. mi. Water area: 0.1 sq. mi.
Population density: 103 people per square mile
(very low).
OSM Map
General Map
Google Map
MSN Map
OSM Map
General Map
Google Map
MSN Map
OSM Map
General Map
Google Map
MSN Map
OSM Map
General Map
Google Map
MSN Map
Please wait while loading the map...
Real estate property taxes paid for housing units in 2022:
This zip code:
0.9% ($1,448)
Michigan:
1.2% ($2,746)
Median real estate property taxes paid for housing units with mortgages in 2022: $1,500 (0.8%) Median real estate property taxes paid for housing units with no mortgage in 2022: $1,400 (1.0%)
Business Search- 14 Million verified businesses
Males: 1,329
(51.5%)
Females: 1,253
(48.5%)
For population 25 years and over in 48435:
High school or higher: 91.2%
Bachelor's degree or higher: 9.9%
Graduate or professional degree: 1.6%
Unemployed: 5.1%
Mean travel time to work (commute): 41.2 minutes
For population 15 years and over in 48435:
Never married: 29.5%
Now married: 55.2%
Separated: 1.0%
Widowed: 5.1%
Divorced: 9.2%
Zip code 48435 compared to state average:
Black race population percentage significantly below state average.
Hispanic race population percentage significantly below state average.
Foreign-born population percentage significantly below state average.
Renting percentage significantly below state average.
Length of stay since moving in significantly above state average.
Percentage of population with a bachelor's degree or higher significantly below state average.
Estimated median house/condo value in 2022: $156,332
48435:
$156,332
Michigan:
$224,400
According to our research of Michigan and other state lists, there were 8 registered sex offenders living in 48435 zip code as of May 23, 2024. The ratio of all residents to sex offenders in zip code 48435 is 260 to 1. The ratio of registered sex offenders to all residents in this zip code is near the state average.
Median resident age:
This zip code:
37.1 years
Michigan median age:
40.3 years
Average household size:
This zip code:
2.9 people
Michigan:
2.4 people
Averages for the 2020 tax year for zip code 48435, filed in 2021:
Average Adjusted Gross Income (AGI) in 2020: $47,286 (Individual Income Tax Returns)
Here:
$47,286
State:
$68,945
Salary/wage: $45,090 (reported on 73.2% of returns)
Here:
$45,090
State:
$57,142
(% of AGI for various income ranges: 846.5% for AGIs below $25k, 2895.7% for AGIs $25k-50k, 5830.8% for AGIs $50k-75k, 9332.9% for AGIs $75k-100k, 14574.3% for AGIs $100k-200k)
Taxable interest for individuals: $474 (reported on 19.6% of returns)
This zip code:
$474
Michigan:
$1,630
(% of AGI for various income ranges: 11.9% for AGIs below $25k, 13.3% for AGIs $25k-50k, 1.7% for AGIs $50k-75k, 27.1% for AGIs $75k-100k, 14.3% for AGIs $100k-200k)
Ordinary dividends: $930 (reported on 10.3% of returns)
Here:
$930
State:
$6,972
(% of AGI for various income ranges: 7.7% for AGIs below $25k, 21.9% for AGIs $25k-50k, 38.6% for AGIs $75k-100k)
Net capital gain/loss in AGI: +$3,171 (reported on 7.2% of returns)
Here:
+$3,171
State:
+$20,064
(% of AGI for various income ranges: 42.4% for AGIs $25k-50k, 190.0% for AGIs $75k-100k)
Profit/loss from business: +$7,200 (reported on 16.5% of returns)
Here:
+$7,200
State:
+$11,172
(% of AGI for various income ranges: 168.5% for AGIs below $25k, 147.6% for AGIs $25k-50k, 137.5% for AGIs $50k-75k, 341.4% for AGIs $75k-100k)
Taxable individual retirement arrangement distribution: $8,667 (reported on 6.2% of returns)
48435:
$8,667
Michigan:
$19,803
(% of AGI for various income ranges: 56.2% for AGIs below $25k, 311.7% for AGIs $50k-75k)
Earned income credit: $2,169 (reported on 16.5% of returns)
Here:
$2,169
State:
$2,251
(% of AGI for various income ranges: 77.7% for AGIs below $25k, 69.0% for AGIs $25k-50k)
Percentage of individuals using paid preparers for their 2020 taxes: 93.8%
Here:
94%
State:
93%
(% for various income ranges: 94.3% for AGIs below $25k, 96.2% for AGIs $25k-50k, 93.8% for AGIs $50k-75k, 90.0% for AGIs $75k-100k, 90.0% for AGIs $100k-200k)
Averages for the 2012 tax year for zip code 48435, filed in 2013:
Average Adjusted Gross Income (AGI) in 2012: $40,003 (Individual Income Tax Returns)
Here:
$40,003
State:
$55,609
Salary/wage: $33,760 (reported on 83.7% of returns)
Here:
$33,760
State:
$46,782
(% of AGI for various income ranges: 56.6% for AGIs below $25k, 66.2% for AGIs $25k-50k, 73.5% for AGIs $50k-75k, 76.1% for AGIs $75k-100k, 76.2% for AGIs $100k-200k)
Taxable interest for individuals: $836 (reported on 30.4% of returns)
This zip code:
$836
Michigan:
$1,491
(% of AGI for various income ranges: 1.7% for AGIs below $25k, 0.4% for AGIs $25k-50k, 0.8% for AGIs $50k-75k, 0.5% for AGIs $100k-200k)
Ordinary dividends: $625 (reported on 8.7% of returns)
Here:
$625
State:
$6,225
(% of AGI for various income ranges: 0.3% for AGIs below $25k, 0.3% for AGIs $25k-50k, 0.2% for AGIs $75k-100k)
Profit/loss from business: +$6,636 (reported on 15.2% of returns)
Here:
+$6,636
State:
+$11,523
(% of AGI for various income ranges: 6.4% for AGIs below $25k, 3.7% for AGIs $25k-50k, 3.2% for AGIs $50k-75k)
Taxable individual retirement arrangement distribution: $8,971 (reported on 7.6% of returns)
48435:
$8,971
Michigan:
$15,298
Total itemized deductions: $15,418 (22% of AGI, reported on 23.9% of returns)
Here:
$15,418
State:
$21,628
Here:
21.7% of AGI
State:
18.4% of AGI
(% of AGI for various income ranges: 9.2% for AGIs $25k-50k, 10.4% for AGIs $50k-75k, 12.8% for AGIs $75k-100k, 10.4% for AGIs $100k-200k)
Charity contributions: $2,340 (reported on 16.3% of returns)
Here:
$2,340
State:
$4,225
(% of AGI for various income ranges: 0.8% for AGIs $25k-50k, 1.1% for AGIs $50k-75k, 1.2% for AGIs $75k-100k, 1.2% for AGIs $100k-200k)
Taxes paid: $4,773 (reported on 23.9% of returns)
48435:
$4,773
State:
$8,327
(% of AGI for various income ranges: 2.4% for AGIs $25k-50k, 2.6% for AGIs $50k-75k, 3.8% for AGIs $75k-100k, 4.7% for AGIs $100k-200k)
Earned income credit: $2,189 (reported on 19.6% of returns)
Here:
$2,189
State:
$2,306
(% of AGI for various income ranges: 6.0% for AGIs below $25k, 1.3% for AGIs $25k-50k)
Percentage of individuals using paid preparers for their 2012 taxes: 67.4%
Here:
67%
State:
57%
(% for various income ranges: 64.1% for AGIs below $25k, 69.6% for AGIs $25k-50k, 75.0% for AGIs $50k-75k, 62.5% for AGIs $75k-100k, 66.7% for AGIs $100k-200k)
Averages for the 2004 tax year for zip code 48435, filed in 2005:
Average Adjusted Gross Income (AGI) in 2004: $37,073 (Individual Income Tax Returns)
Here:
$37,073
State:
$48,204
Salary/wage: $34,011 (reported on 87.9% of returns)
Here:
$34,011
State:
$42,791
(% of AGI for various income ranges: 84.2% for AGIs below $10k, 66.3% for AGIs $10k-25k, 74.4% for AGIs $25k-50k, 85.5% for AGIs $50k-75k, 88.6% for AGIs $75k-100k, 82.5% for AGIs over 100k)
Taxable interest for individuals: $830 (reported on 41.3% of returns)
This zip code:
$830
Michigan:
$1,725
(% of AGI for various income ranges: 4.4% for AGIs below $10k, 2.5% for AGIs $10k-25k, 0.9% for AGIs $25k-50k, 0.4% for AGIs $50k-75k, 0.3% for AGIs $75k-100k, 0.9% for AGIs over 100k)
Taxable dividends: $604 (reported on 14.2% of returns)
Here:
$604
State:
$3,420
(% of AGI for various income ranges: 0.7% for AGIs below $10k, 0.6% for AGIs $10k-25k, 0.3% for AGIs $25k-50k, 0.1% for AGIs $50k-75k, 0.1% for AGIs $75k-100k, 0.2% for AGIs over 100k)
Net capital gain/loss: +$2,902 (reported on 8.1% of returns)
Here:
+$2,902
State:
+$8,532
(% of AGI for various income ranges: 0.8% for AGIs $10k-25k, 0.1% for AGIs $25k-50k, 1.0% for AGIs $50k-75k, 1.4% for AGIs over 100k)
Profit/loss from business: +$4,179 (reported on 14.9% of returns)
Here:
+$4,179
State:
+$9,547
(% of AGI for various income ranges: 9.1% for AGIs below $10k, 4.2% for AGIs $10k-25k, 0.7% for AGIs $25k-50k, 2.8% for AGIs $50k-75k)
IRA payment deduction: $1,400 (reported on 1.0% of returns)
48435:
$1,400
Michigan:
$2,875
Total itemized deductions: $14,784 (24% of AGI, reported on 32.4% of returns)
Here:
$14,784
State:
$18,509
Here:
24.1% of AGI
State:
20.7% of AGI
(% of AGI for various income ranges: 12.6% for AGIs $10k-25k, 10.7% for AGIs $25k-50k, 14.9% for AGIs $50k-75k, 15.0% for AGIs $75k-100k, 12.5% for AGIs over 100k)
Charity contributions deductions: $2,023 (3% of AGI, reported on 25.6% of returns)
Here:
$2,023
State:
$3,365
Here:
3.1% of AGI
State:
3.6% of AGI
(% of AGI for various income ranges: 0.9% for AGIs $10k-25k, 1.0% for AGIs $25k-50k, 2.2% for AGIs $50k-75k, 1.4% for AGIs $75k-100k, 1.2% for AGIs over 100k)
Total tax: $3,874 (reported on 74.3% of returns)
48435:
$3,874
State:
$7,691
(% of AGI for various income ranges: 3.3% for AGIs below $10k, 4.0% for AGIs $10k-25k, 5.4% for AGIs $25k-50k, 7.3% for AGIs $50k-75k, 9.7% for AGIs $75k-100k, 13.6% for AGIs over 100k)
Earned income credit: $1,770 (reported on 14.6% of returns)
Here:
$1,770
State:
$1,737
Percentage of individuals using paid preparers for their 2004 taxes: 63.3%
Here:
63%
State:
60%
(% for various income ranges: 48.0% for AGIs below $10k, 65.5% for AGIs $10k-25k, 66.9% for AGIs $25k-50k, 66.8% for AGIs $50k-75k, 67.1% for AGIs $75k-100k, 78.7% for AGIs over 100k)
Household received Food Stamps/SNAP in the past 12 months: 86 Household did not receive Food Stamps/SNAP in the past 12 months: 803
Women who had a birth in the past 12 months: 42 (43 now married, 0 unmarried) Women who did not have a birth in the past 12 months: 562 (192 now married, 370 unmarried)
Housing units in zip code 48435 with a mortgage: 475 (32 second mortgage, 26 both second mortgage and home equity loan) Median monthly owner costs for units with a mortgage: $1,218 Median monthly owner costs for units without a mortgage: $592
Residents with income below the poverty level in 2022:
This zip code:
9.7%
Whole state:
13.4%
Residents with income below 50% of the poverty level in 2022:
This zip code:
4.5%
Whole state:
6.9%
Median number of rooms in houses and condos:
Here:
6.1
State:
6.5
Median number of rooms in apartments:
Here:
5.2
State:
4.3
Notable locations in this zip code not listed on our city pages
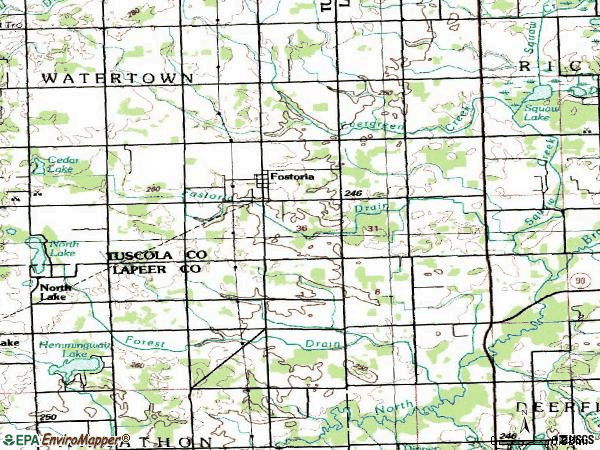
Notable locations in zip code 48435: Watertown Township Hall (A), Fostoria - Watertown Township Fire Department (B). Display/hide their locations on the map
Churches in zip code 48435 include: West Deerfield Church (A), Fostoria Baptist Church (B), Fostoria United Methodist Church (C). Display/hide their locations on the map
Size of family households: 271 2-persons, 208 3-persons, 71 4-persons, 76 5-persons, 58 6-persons, 16 7-or-more-persons
Size of nonfamily households: 156 1-person, 26 2-persons
327 married couples with children.
273 single-parent households (69 men, 204 women).
96.5% of residents of 48435 zip code speak English at home.
1.3% of residents speak Spanish at home (100% very well).
0.8% of residents speak other Indo-European language at home (100% very well).
0.2% of residents speak Asian or Pacific Island language at home (100% not well).
0.6% of residents speak other language at home (100% very well).
Foreign born population: 4 (0.2%) (100.0% of them are naturalized citizens)
This zip code:
0.2%
Whole state:
6.9%
25%Azores Islands
35%German
33%American
10%English
4%French Canadian
4%Scottish
3%Danish
2%Polish
Year of entry for the foreign-born population
02010 or later
02000 to 2009
31990 to 1999
7Before 1990
Facilities with environmental interests located in this zip code:
INTERNATIONAL MATERIALS INCORPORATED (2034 GOODRICH RD in FOSTORIA, MI)
CRITERIA AND HAZARDOUS AIR POLLUTANT INVENTORY (Inventory of air pollution sources) Business SIC classification: CONSTRUCTION SAND AND GRAVEL
Housing units lacking complete plumbing facilities: 0.7% Housing units lacking complete kitchen facilities: 0.7%
58.9%Bottled, tank, or LP gas
26.7%Utility gas
5.6%Fuel oil, kerosene, etc.
4.9%Wood
3.4%Electricity
0.8%No fuel used
Population in 1990: 2,242.
Place of birth for U.S.-born residents:
This state: 2,380
Northeast: 86
Midwest: 36
South: 45
West: 17
60% of the 48435 zip code residents lived in the same house 5 years ago. Out of people who lived in different houses, 29% lived in this county. Out of people who lived in different counties, 50% lived in Michigan.
98% of the 48435 zip code residents lived in the same house 1 year ago. Out of people who lived in different houses, 20% moved from this county. Out of people who lived in different houses, 80% moved from different county within same state. Out of people who lived in different houses, 12% moved from abroad.
Private vs. public school enrollment:
Students in private schools in grades 1 to 8 (elementary and middle school): 64
Here:
22.1%
Michigan:
12.4%
Students in private schools in grades 9 to 12 (high school): 10
Here:
13.4%
Michigan:
9.8%
Students in private undergraduate colleges: 1
Here:
0.8%
Michigan:
14.9%
Occupation by median earnings in the past 12 months ($)
143,442Architecture and engineering occupations
81,922Construction and extraction occupations
59,584Management occupations
57,154Health diagnosing and treating practitioners and other technical occupations
44,613Business and financial operations occupations
42,594Production occupations
Top industries in this zip code by the number of employees in 2005:
Other Services (except Public Administration): Religious Organizations (5-9 employees: 1 establishment, 1-4 employees: 1 establishment)
Educational Services: Fine Arts Schools (5-9: 1)
Construction: Poured Concrete Foundation and Structure Contractors (1-4: 2)
Wholesale Trade: Industrial Machinery and Equipment Merchant Wholesalers (1-4: 1)
Construction: Electrical Contractors (1-4: 1)
Construction: New Single-Family Housing Construction (except Operative Builders) (1-4: 1)
Real Estate and Rental and Leasing: Passenger Car Rental (1-4: 1)
People in group quarters in 2010:
6 people in workers' group living quarters and job corps centers
People in group quarters in 2000:
6 people in other noninstitutional group quarters
Fatal accident statistics in 2014:
Fatal accident count: 1
Vehicles involved in fatal accidents: 1
Fatal accidents caused by drunken drivers: 1
Fatalities: 1
Persons involved in fatal accidents: 2
Pedestrians involved in fatal accidents: 0
Fatal accident statistics in 2012:
Fatal accident count: 1
Vehicles involved in fatal accidents: 1
Fatal accidents caused by drunken drivers: 1
Fatalities: 1
Persons involved in fatal accidents: 1
Pedestrians involved in fatal accidents: 0
Home Mortgage Disclosure Act Aggregated Statistics For Year 2009 (Based on 2 partial tracts)
A) FHA, FSA/RHS & VA Home Purchase Loans
B) Conventional Home Purchase Loans
C) Refinancings
D) Home Improvement Loans
F) Non-occupant Loans on < 5 Family Dwellings (A B C & D)
G) Loans On Manufactured Home Dwelling (A B C & D)
Number
Average Value
Number
Average Value
Number
Average Value
Number
Average Value
Number
Average Value
Number
Average Value
LOANS ORIGINATED
7
$92,369
3
$68,523
23
$123,648
1
$87,050
4
$92,988
1
$88,650
APPLICATIONS APPROVED, NOT ACCEPTED
0
$0
0
$0
3
$131,263
0
$0
0
$0
0
$0
APPLICATIONS DENIED
3
$71,733
1
$112,420
12
$127,704
2
$13,010
1
$134,260
1
$56,850
APPLICATIONS WITHDRAWN
1
$79,980
0
$0
6
$118,898
0
$0
0
$0
1
$90,900
FILES CLOSED FOR INCOMPLETENESS
0
$0
0
$0
1
$152,570
0
$0
0
$0
0
$0
Aggregated Statistics For Year 2008 (Based on 2 partial tracts)
A) FHA, FSA/RHS & VA Home Purchase Loans
B) Conventional Home Purchase Loans
C) Refinancings
D) Home Improvement Loans
F) Non-occupant Loans on < 5 Family Dwellings (A B C & D)
G) Loans On Manufactured Home Dwelling (A B C & D)
Number
Average Value
Number
Average Value
Number
Average Value
Number
Average Value
Number
Average Value
Number
Average Value
LOANS ORIGINATED
9
$103,712
7
$82,319
20
$127,066
4
$52,838
3
$95,503
4
$74,680
APPLICATIONS APPROVED, NOT ACCEPTED
1
$62,960
1
$38,870
3
$135,653
0
$0
0
$0
1
$101,500
APPLICATIONS DENIED
4
$79,095
3
$38,223
21
$137,336
3
$67,023
1
$75,800
5
$65,846
APPLICATIONS WITHDRAWN
1
$37,900
0
$0
6
$182,282
1
$70,660
0
$0
1
$29,230
FILES CLOSED FOR INCOMPLETENESS
0
$0
1
$63,920
2
$138,275
0
$0
0
$0
0
$0
Aggregated Statistics For Year 2007 (Based on 2 partial tracts)
A) FHA, FSA/RHS & VA Home Purchase Loans
B) Conventional Home Purchase Loans
C) Refinancings
D) Home Improvement Loans
F) Non-occupant Loans on < 5 Family Dwellings (A B C & D)
G) Loans On Manufactured Home Dwelling (A B C & D)
Number
Average Value
Number
Average Value
Number
Average Value
Number
Average Value
Number
Average Value
Number
Average Value
LOANS ORIGINATED
2
$126,070
15
$117,409
31
$115,373
5
$67,966
9
$101,463
5
$61,350
APPLICATIONS APPROVED, NOT ACCEPTED
0
$0
1
$157,710
10
$127,292
1
$25,050
1
$69,380
0
$0
APPLICATIONS DENIED
2
$119,165
6
$94,005
41
$137,677
5
$77,216
3
$122,913
8
$97,725
APPLICATIONS WITHDRAWN
0
$0
1
$67,130
10
$132,656
1
$10,600
1
$84,800
1
$150,640
FILES CLOSED FOR INCOMPLETENESS
0
$0
0
$0
5
$216,554
1
$70,020
0
$0
0
$0
Aggregated Statistics For Year 2006 (Based on 2 partial tracts)
A) FHA, FSA/RHS & VA Home Purchase Loans
B) Conventional Home Purchase Loans
C) Refinancings
D) Home Improvement Loans
F) Non-occupant Loans on < 5 Family Dwellings (A B C & D)
G) Loans On Manufactured Home Dwelling (A B C & D)
Number
Average Value
Number
Average Value
Number
Average Value
Number
Average Value
Number
Average Value
Number
Average Value
LOANS ORIGINATED
1
$138,120
21
$110,523
61
$122,709
7
$50,611
8
$87,849
9
$77,623
APPLICATIONS APPROVED, NOT ACCEPTED
0
$0
3
$66,167
10
$161,435
1
$58,780
1
$147,110
1
$77,090
APPLICATIONS DENIED
0
$0
14
$107,809
49
$147,208
6
$79,337
4
$208,780
10
$96,681
APPLICATIONS WITHDRAWN
0
$0
6
$85,975
21
$132,747
3
$38,223
1
$93,470
3
$56,530
FILES CLOSED FOR INCOMPLETENESS
0
$0
1
$158,990
9
$163,383
0
$0
1
$202,360
0
$0
Aggregated Statistics For Year 2005 (Based on 2 partial tracts)
A) FHA, FSA/RHS & VA Home Purchase Loans
B) Conventional Home Purchase Loans
C) Refinancings
D) Home Improvement Loans
F) Non-occupant Loans on < 5 Family Dwellings (A B C & D)
G) Loans On Manufactured Home Dwelling (A B C & D)
Number
Average Value
Number
Average Value
Number
Average Value
Number
Average Value
Number
Average Value
Number
Average Value
LOANS ORIGINATED
3
$123,553
31
$112,472
59
$130,178
5
$57,430
7
$96,910
8
$65,324
APPLICATIONS APPROVED, NOT ACCEPTED
1
$52,030
4
$100,858
13
$122,105
1
$70,340
0
$0
2
$77,250
APPLICATIONS DENIED
0
$0
10
$98,769
52
$134,657
8
$54,082
2
$86,405
9
$65,347
APPLICATIONS WITHDRAWN
1
$109,850
4
$140,122
29
$135,591
4
$133,298
2
$136,830
0
$0
FILES CLOSED FOR INCOMPLETENESS
0
$0
0
$0
13
$133,323
0
$0
1
$66,170
0
$0
Aggregated Statistics For Year 2004 (Based on 2 partial tracts)
A) FHA, FSA/RHS & VA Home Purchase Loans
B) Conventional Home Purchase Loans
C) Refinancings
D) Home Improvement Loans
F) Non-occupant Loans on < 5 Family Dwellings (A B C & D)
G) Loans On Manufactured Home Dwelling (A B C & D)
Number
Average Value
Number
Average Value
Number
Average Value
Number
Average Value
Number
Average Value
Number
Average Value
LOANS ORIGINATED
5
$122,506
27
$117,202
75
$122,827
5
$48,566
8
$94,634
10
$67,452
APPLICATIONS APPROVED, NOT ACCEPTED
0
$0
3
$103,533
10
$121,285
2
$37,420
1
$67,130
3
$57,067
APPLICATIONS DENIED
0
$0
10
$74,679
52
$117,992
9
$52,783
1
$32,760
11
$54,254
APPLICATIONS WITHDRAWN
2
$110,975
2
$114,990
31
$128,097
1
$44,330
1
$48,500
2
$68,415
FILES CLOSED FOR INCOMPLETENESS
0
$0
1
$144,860
15
$134,112
1
$76,120
0
$0
0
$0
Aggregated Statistics For Year 2003 (Based on 2 partial tracts)
A) FHA, FSA/RHS & VA Home Purchase Loans
B) Conventional Home Purchase Loans
C) Refinancings
D) Home Improvement Loans
F) Non-occupant Loans on < 5 Family Dwellings (A B C & D)
Number
Average Value
Number
Average Value
Number
Average Value
Number
Average Value
Number
Average Value
LOANS ORIGINATED
4
$122,698
22
$113,486
137
$117,484
5
$33,726
10
$111,617
APPLICATIONS APPROVED, NOT ACCEPTED
0
$0
2
$87,045
23
$106,778
1
$18,950
2
$116,915
APPLICATIONS DENIED
1
$103,430
9
$108,138
59
$109,056
5
$26,082
4
$88,650
APPLICATIONS WITHDRAWN
1
$130,410
2
$129,285
26
$115,298
1
$29,230
1
$57,490
FILES CLOSED FOR INCOMPLETENESS
0
$0
0
$0
5
$116,338
0
$0
0
$0
Aggregated Statistics For Year 1999 (Based on 1 partial tract)
A) FHA, FSA/RHS & VA Home Purchase Loans
B) Conventional Home Purchase Loans
C) Refinancings
D) Home Improvement Loans
F) Non-occupant Loans on < 5 Family Dwellings (A B C & D)
Detailed PMIC statistics for the following Tracts:3320.00
2002 - 2018 National Fire Incident Reporting System (NFIRS) incidents
According to the data from the years 2002 - 2018 the average number of fires per year is 10. The highest number of fires - 25 took place in 2004, and the least - 1 in 2012. The data has a growing trend.
When looking into fire subcategories, the most reports belonged to: Structure Fires (53.0%), and Outside Fires (32.9%).
Fire incident types reported to NFIRS in Zip Code 48435


 Nearest zip codes: 48464, 48421, 48744, 48760, 48461, 48463.


 According to the data from the years 2002 - 2018 the average number of fires per year is 10. The highest number of fires - 25 took place in 2004, and the least - 1 in 2012. The data has a growing trend.
 When looking into fire subcategories, the most reports belonged to: Structure Fires (53.0%), and Outside Fires (32.9%).