Estimated zip code population in 2022: 5,706 Zip code population in 2010: 5,682 Zip code population in 2000: 5,892
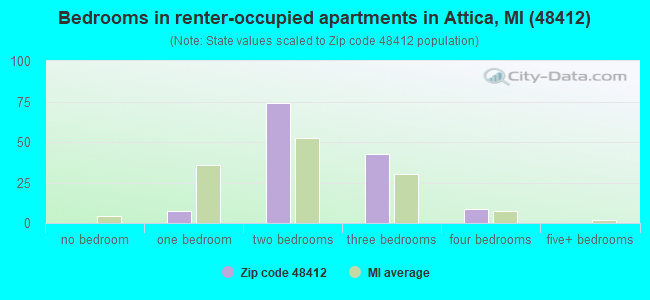
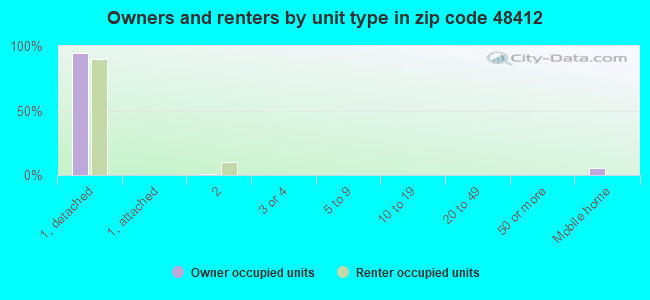
Houses and condos: 2,383 Renter-occupied apartments: 133
% of renters here:
6%
State:
27%
March 2022 cost of living index in zip code 48412: 92.5 (less than average, U.S. average is 100)
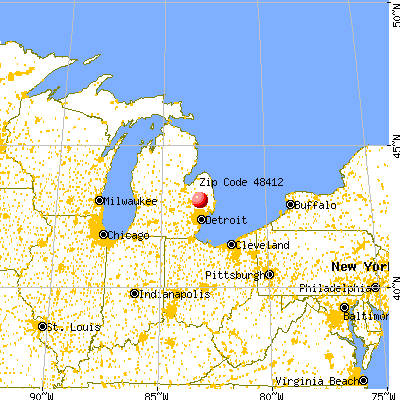
Land area: 50.0 sq. mi. Water area: 1.0 sq. mi.
Population density: 114 people per square mile
(very low).
OSM Map
General Map
Google Map
MSN Map
OSM Map
General Map
Google Map
MSN Map
OSM Map
General Map
Google Map
MSN Map
OSM Map
General Map
Google Map
MSN Map
Please wait while loading the map...
Real estate property taxes paid for housing units in 2022:
This zip code:
0.8% ($2,058)
Michigan:
1.2% ($2,746)
Median real estate property taxes paid for housing units with mortgages in 2022: $2,322 (0.9%) Median real estate property taxes paid for housing units with no mortgage in 2022: $1,503 (0.7%)
Business Search- 14 Million verified businesses
Males: 2,925
(51.3%)
Females: 2,780
(48.7%)
For population 25 years and over in 48412:
High school or higher: 91.2%
Bachelor's degree or higher: 15.7%
Graduate or professional degree: 2.9%
Unemployed: 2.4%
Mean travel time to work (commute): 42.1 minutes
For population 15 years and over in 48412:
Never married: 24.9%
Now married: 61.8%
Separated: 1.6%
Widowed: 3.5%
Divorced: 8.2%
Zip code 48412 compared to state average:
Unemployed percentage below state average.
Black race population percentage significantly below state average.
Median age significantly above state average.
Foreign-born population percentage significantly below state average.
Renting percentage significantly below state average.
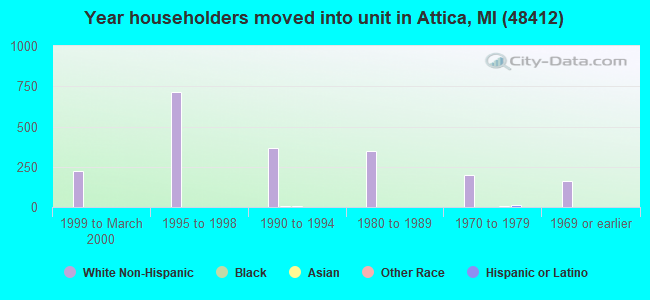
Length of stay since moving in significantly above state average.
Percentage of population with a bachelor's degree or higher below state average.
Averages for the 2020 tax year for zip code 48412, filed in 2021:
Average Adjusted Gross Income (AGI) in 2020: $59,157 (Individual Income Tax Returns)
Here:
$59,157
State:
$68,945
Salary/wage: $52,971 (reported on 77.4% of returns)
Here:
$52,971
State:
$57,142
(% of AGI for various income ranges: 957.2% for AGIs below $25k, 3105.4% for AGIs $25k-50k, 5627.3% for AGIs $50k-75k, 9528.7% for AGIs $75k-100k, 16569.3% for AGIs $100k-200k, 41243.3% for AGIs over 200k)
Taxable interest for individuals: $724 (reported on 29.6% of returns)
This zip code:
$724
Michigan:
$1,630
(% of AGI for various income ranges: 20.0% for AGIs below $25k, 16.3% for AGIs $25k-50k, 24.6% for AGIs $50k-75k, 76.1% for AGIs $75k-100k, 45.6% for AGIs $100k-200k, 136.7% for AGIs over 200k)
Ordinary dividends: $2,762 (reported on 15.8% of returns)
Here:
$2,762
State:
$6,972
(% of AGI for various income ranges: 25.9% for AGIs below $25k, 34.8% for AGIs $25k-50k, 39.5% for AGIs $50k-75k, 39.6% for AGIs $75k-100k, 165.9% for AGIs $100k-200k, 913.3% for AGIs over 200k)
Net capital gain/loss in AGI: +$11,668 (reported on 13.8% of returns)
Here:
+$11,668
State:
+$20,064
(% of AGI for various income ranges: 20.2% for AGIs $25k-50k, 59.5% for AGIs $50k-75k, 210.4% for AGIs $75k-100k, 396.3% for AGIs $100k-200k, 9706.7% for AGIs over 200k)
Profit/loss from business: +$8,185 (reported on 15.5% of returns)
Here:
+$8,185
State:
+$11,172
(% of AGI for various income ranges: 88.0% for AGIs below $25k, 92.7% for AGIs $25k-50k, 126.2% for AGIs $50k-75k, 176.5% for AGIs $75k-100k, 693.7% for AGIs $100k-200k)
Taxable individual retirement arrangement distribution: $14,992 (reported on 8.8% of returns)
48412:
$14,992
Michigan:
$19,803
(% of AGI for various income ranges: 57.0% for AGIs below $25k, 123.8% for AGIs $25k-50k, 161.6% for AGIs $50k-75k, 242.6% for AGIs $75k-100k, 648.1% for AGIs $100k-200k)
Total itemized deductions: $26,421 (reported on 4.7% of returns)
Here:
$26,421
State:
$34,117
(% of AGI for various income ranges: 311.6% for AGIs $50k-75k, 311.7% for AGIs $75k-100k, 380.4% for AGIs $100k-200k, 2673.3% for AGIs over 200k)
Charity contributions: $8,122 (reported on 3.0% of returns)
Here:
$8,122
State:
$13,548
(% of AGI for various income ranges: 39.2% for AGIs $50k-75k, 52.6% for AGIs $75k-100k, 172.2% for AGIs $100k-200k)
Taxes paid: $6,985 (reported on 4.4% of returns)
48412:
$6,985
State:
$7,972
(% of AGI for various income ranges: 58.4% for AGIs $50k-75k, 80.4% for AGIs $75k-100k, 113.3% for AGIs $100k-200k, 670.0% for AGIs over 200k)
Earned income credit: $1,753 (reported on 10.8% of returns)
Here:
$1,753
State:
$2,251
(% of AGI for various income ranges: 49.2% for AGIs below $25k, 50.2% for AGIs $25k-50k)
Percentage of individuals using paid preparers for their 2020 taxes: 92.6%
Here:
93%
State:
93%
(% for various income ranges: 90.5% for AGIs below $25k, 94.2% for AGIs $25k-50k, 93.8% for AGIs $50k-75k, 91.2% for AGIs $75k-100k, 93.2% for AGIs $100k-200k, 100.0% for AGIs over 200k)
Averages for the 2012 tax year for zip code 48412, filed in 2013:
Average Adjusted Gross Income (AGI) in 2012: $49,743 (Individual Income Tax Returns)
Here:
$49,743
State:
$55,609
Salary/wage: $42,294 (reported on 84.0% of returns)
Here:
$42,294
State:
$46,782
(% of AGI for various income ranges: 58.0% for AGIs below $25k, 65.4% for AGIs $25k-50k, 72.2% for AGIs $50k-75k, 79.0% for AGIs $75k-100k, 81.7% for AGIs $100k-200k, 47.9% for AGIs over 200k)
Taxable interest for individuals: $693 (reported on 33.1% of returns)
This zip code:
$693
Michigan:
$1,491
(% of AGI for various income ranges: 1.2% for AGIs below $25k, 0.8% for AGIs $25k-50k, 0.4% for AGIs $50k-75k, 0.2% for AGIs $75k-100k, 0.3% for AGIs $100k-200k, 0.2% for AGIs over 200k)
Ordinary dividends: $1,863 (reported on 15.6% of returns)
Here:
$1,863
State:
$6,225
(% of AGI for various income ranges: 1.0% for AGIs below $25k, 0.8% for AGIs $25k-50k, 0.6% for AGIs $50k-75k, 0.5% for AGIs $75k-100k, 0.5% for AGIs $100k-200k)
Net capital gain/loss in AGI: +$1,121 (reported on 8.7% of returns)
Here:
+$1,121
State:
+$9,326
(% of AGI for various income ranges: 0.2% for AGIs $50k-75k, 0.6% for AGIs $100k-200k)
Profit/loss from business: +$8,344 (reported on 14.9% of returns)
Here:
+$8,344
State:
+$11,523
(% of AGI for various income ranges: 7.8% for AGIs below $25k, 3.0% for AGIs $25k-50k, 2.7% for AGIs $50k-75k, 1.2% for AGIs $75k-100k, 1.8% for AGIs $100k-200k)
Taxable individual retirement arrangement distribution: $11,153 (reported on 11.6% of returns)
48412:
$11,153
Michigan:
$15,298
(% of AGI for various income ranges: 3.9% for AGIs below $25k, 3.1% for AGIs $25k-50k, 2.0% for AGIs $50k-75k, 3.5% for AGIs $75k-100k, 2.6% for AGIs $100k-200k)
Total itemized deductions: $18,376 (21% of AGI, reported on 30.5% of returns)
Here:
$18,376
State:
$21,628
Here:
20.5% of AGI
State:
18.4% of AGI
(% of AGI for various income ranges: 8.3% for AGIs below $25k, 8.7% for AGIs $25k-50k, 11.0% for AGIs $50k-75k, 12.5% for AGIs $75k-100k, 13.9% for AGIs $100k-200k, 9.6% for AGIs over 200k)
Charity contributions: $2,497 (reported on 24.4% of returns)
Here:
$2,497
State:
$4,225
(% of AGI for various income ranges: 0.7% for AGIs below $25k, 0.9% for AGIs $25k-50k, 1.1% for AGIs $50k-75k, 1.2% for AGIs $75k-100k, 1.8% for AGIs $100k-200k, 0.8% for AGIs over 200k)
Taxes paid: $6,032 (reported on 30.5% of returns)
48412:
$6,032
State:
$8,327
(% of AGI for various income ranges: 1.6% for AGIs below $25k, 2.2% for AGIs $25k-50k, 3.2% for AGIs $50k-75k, 4.0% for AGIs $75k-100k, 5.2% for AGIs $100k-200k, 4.8% for AGIs over 200k)
Earned income credit: $2,072 (reported on 14.2% of returns)
Here:
$2,072
State:
$2,306
(% of AGI for various income ranges: 4.5% for AGIs below $25k, 1.0% for AGIs $25k-50k)
Percentage of individuals using paid preparers for their 2012 taxes: 60.7%
Here:
61%
State:
57%
(% for various income ranges: 55.2% for AGIs below $25k, 61.5% for AGIs $25k-50k, 65.2% for AGIs $50k-75k, 65.4% for AGIs $75k-100k, 63.3% for AGIs $100k-200k, 100.0% for AGIs over 200k)
Averages for the 2004 tax year for zip code 48412, filed in 2005:
Average Adjusted Gross Income (AGI) in 2004: $46,798 (Individual Income Tax Returns)
Here:
$46,798
State:
$48,204
Salary/wage: $42,982 (reported on 88.2% of returns)
Here:
$42,982
State:
$42,791
(% of AGI for various income ranges: 121.7% for AGIs below $10k, 63.9% for AGIs $10k-25k, 74.1% for AGIs $25k-50k, 82.7% for AGIs $50k-75k, 88.8% for AGIs $75k-100k, 81.0% for AGIs over 100k)
Taxable interest for individuals: $961 (reported on 52.8% of returns)
This zip code:
$961
Michigan:
$1,725
(% of AGI for various income ranges: 10.5% for AGIs below $10k, 2.3% for AGIs $10k-25k, 1.2% for AGIs $25k-50k, 1.0% for AGIs $50k-75k, 0.7% for AGIs $75k-100k, 0.7% for AGIs over 100k)
Taxable dividends: $1,229 (reported on 22.5% of returns)
Here:
$1,229
State:
$3,420
(% of AGI for various income ranges: 3.2% for AGIs below $10k, 1.3% for AGIs $10k-25k, 0.7% for AGIs $25k-50k, 0.6% for AGIs $50k-75k, 0.4% for AGIs $75k-100k, 0.5% for AGIs over 100k)
Net capital gain/loss: +$4,452 (reported on 15.2% of returns)
Here:
+$4,452
State:
+$8,532
(% of AGI for various income ranges: -1.8% for AGIs below $10k, 0.2% for AGIs $10k-25k, -0.0% for AGIs $25k-50k, 1.0% for AGIs $50k-75k, 0.2% for AGIs $75k-100k, 4.1% for AGIs over 100k)
Profit/loss from business: +$7,975 (reported on 14.9% of returns)
Here:
+$7,975
State:
+$9,547
(% of AGI for various income ranges: 6.9% for AGIs below $10k, 4.6% for AGIs $10k-25k, 2.6% for AGIs $25k-50k, 2.4% for AGIs $50k-75k, 2.7% for AGIs $75k-100k, 1.8% for AGIs over 100k)
IRA payment deduction: $3,060 (reported on 2.5% of returns)
48412:
$3,060
Michigan:
$2,875
(% of AGI for various income ranges: 0.3% for AGIs $25k-50k, 0.2% for AGIs $50k-75k, 0.2% for AGIs $75k-100k, 0.1% for AGIs over 100k)
Total itemized deductions: $16,371 (22% of AGI, reported on 41.8% of returns)
Here:
$16,371
State:
$18,509
Here:
22.0% of AGI
State:
20.7% of AGI
(% of AGI for various income ranges: 21.8% for AGIs below $10k, 10.7% for AGIs $10k-25k, 14.9% for AGIs $25k-50k, 15.2% for AGIs $50k-75k, 15.3% for AGIs $75k-100k, 14.2% for AGIs over 100k)
Charity contributions deductions: $2,117 (3% of AGI, reported on 35.7% of returns)
Here:
$2,117
State:
$3,365
Here:
2.7% of AGI
State:
3.6% of AGI
(% of AGI for various income ranges: 0.4% for AGIs below $10k, 0.8% for AGIs $10k-25k, 1.4% for AGIs $25k-50k, 1.6% for AGIs $50k-75k, 1.9% for AGIs $75k-100k, 1.8% for AGIs over 100k)
Total tax: $5,863 (reported on 79.8% of returns)
48412:
$5,863
State:
$7,691
(% of AGI for various income ranges: 4.2% for AGIs below $10k, 4.3% for AGIs $10k-25k, 6.5% for AGIs $25k-50k, 8.5% for AGIs $50k-75k, 10.1% for AGIs $75k-100k, 15.0% for AGIs over 100k)
Earned income credit: $1,506 (reported on 9.5% of returns)
Here:
$1,506
State:
$1,737
Percentage of individuals using paid preparers for their 2004 taxes: 61.5%
Here:
62%
State:
60%
(% for various income ranges: 49.4% for AGIs below $10k, 60.7% for AGIs $10k-25k, 65.8% for AGIs $25k-50k, 64.0% for AGIs $50k-75k, 65.4% for AGIs $75k-100k, 66.3% for AGIs over 100k)
Likely homosexual households (counted as self-reported same-sex unmarried-partner households)
Lesbian couples: 0.3% of all households
Gay men: 0.0% of all households
Household received Food Stamps/SNAP in the past 12 months: 236 Household did not receive Food Stamps/SNAP in the past 12 months: 1,970
Women who had a birth in the past 12 months: 122 (71 now married, 50 unmarried) Women who did not have a birth in the past 12 months: 1,028 (472 now married, 554 unmarried)
Housing units in zip code 48412 with a mortgage: 1,267 (77 second mortgage, 57 both second mortgage and home equity loan) Houses without a mortgage: 15
Median monthly owner costs for units with a mortgage: $1,401 Median monthly owner costs for units without a mortgage: $517
Residents with income below the poverty level in 2022:
This zip code:
9.1%
Whole state:
13.4%
Residents with income below 50% of the poverty level in 2022:
This zip code:
5.3%
Whole state:
6.9%
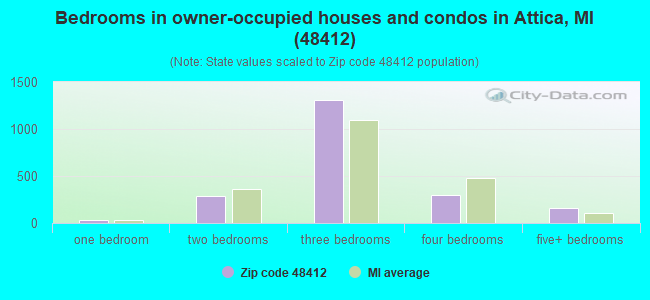
Median number of rooms in houses and condos:
Here:
6.5
State:
6.5
Median number of rooms in apartments:
Here:
5.0
State:
4.3
Notable locations in this zip code not listed on our city pages
Notable locations in zip code 48412: Almont Station (A), Castle Creek Golf Club (B), Arcadia Hills Golf Club (C), Five Lakes Rest Area (D), Attica Township Library (E), Attica Township Fire Department (F), Arcadia Township Fire Department (G). Display/hide their locations on the map
Churches in zip code 48412 include: Evangelical Wesleyan Church (A), New Life Christian Church (B), First Baptist Church of Attica (C), Almont United Methodist Church (D). Display/hide their locations on the map
Lakes: Lake Pleasant (A), Long Lake (B), Pierce Lake (C), Pickerel Lake (D), Mud Lake (E), Mitchell Lakes (F), Grass Lake (G), Elk Lake (H). Display/hide their locations on the map
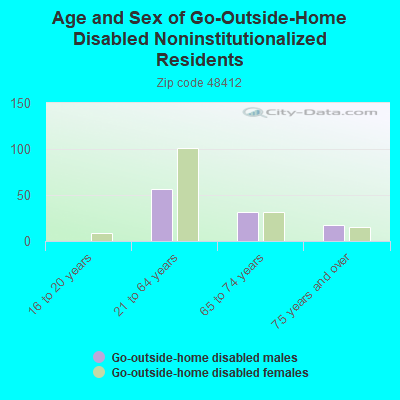
In group quarters: 8 (-1 institutionalized population)
Size of family households: 876 2-persons, 311 3-persons, 306 4-persons, 135 5-persons, 45 6-persons, 16 7-or-more-persons
Size of nonfamily households: 367 1-person, 144 2-persons
609 married couples with children.
183 single-parent households (11 men, 172 women).
97.5% of residents of 48412 zip code speak English at home.
1.9% of residents speak Spanish at home (23% very well, 41% well, 26% not well, 10% not at all).
0.4% of residents speak other Indo-European language at home (100% very well).
0.1% of residents speak Asian or Pacific Island language at home (100% well).
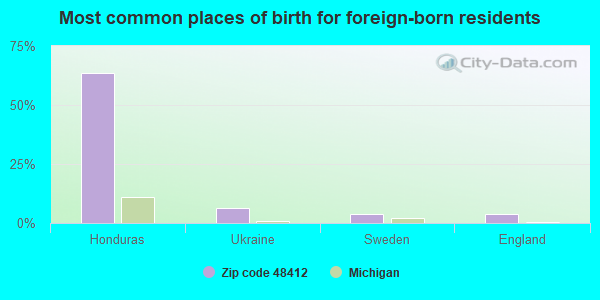
Foreign born population: 79 (1.4%) (51.3% of them are naturalized citizens)
This zip code:
1.4%
Whole state:
6.9%
64%Honduras
6%Ukraine
4%Sweden
4%England
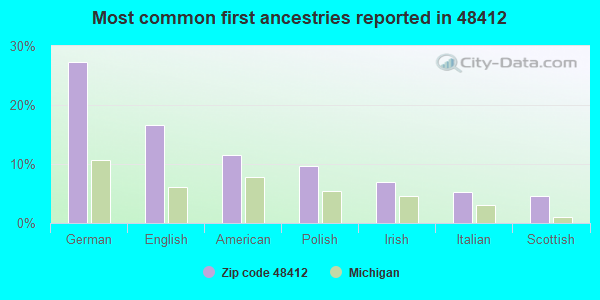
27%German
17%English
12%American
10%Polish
7%Irish
5%Italian
5%Scottish
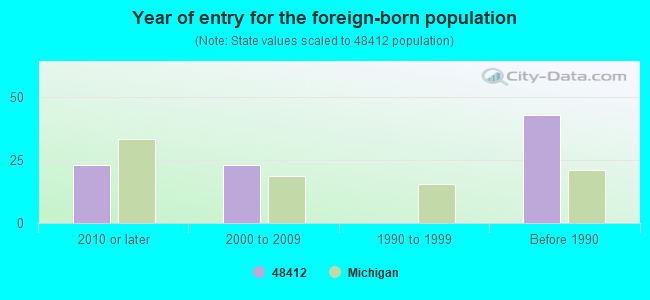
Year of entry for the foreign-born population
232010 or later
232000 to 2009
01990 to 1999
43Before 1990
Facilities with environmental interests located in this zip code:
ATTICA ELEMENTARY SCHOOL (80 N. LAKE PLEASANT ROAD in ATTICA, MI)
(National Center for Education Statistics) - STATE ID-00143 Organizations: LAPEER COMMUNITY SCHOOLS (SCHOOL DISTRICT)
BARRETT PAVING MATERIALS INC (1200 LAKE GEORGE RD in ATTICA, MI)
AIR SYNTHETIC MINOR (AIRS/AFS) CRITERIA AND HAZARDOUS AIR POLLUTANT INVENTORY (Inventory of air pollution sources) National Pollutant Discharge Elimination System NON-MAJOR (Tracking pollutant discharge elimination systems) - permit Business SIC classification: CONSTRUCTION SAND AND GRAVEL; ASPHALT PAVING MIXTURES AND BLOCKS Business NAICS classification: ASPHALT PAVING MIXTURE AND BLOCK MANUFACTURING. Organizations: BARRETT PAVING MATERIALS INC (CONTACT/OWNER)
Alternative names: BARRETT PAVING INC-ATTICA
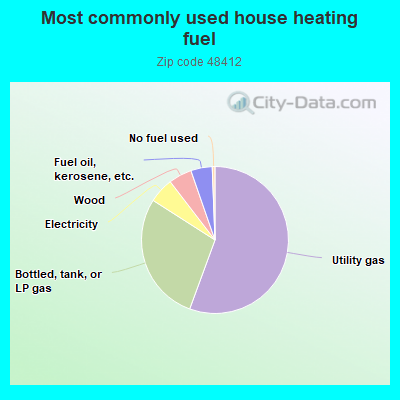
55.5%Utility gas
28.4%Bottled, tank, or LP gas
5.5%Electricity
5.1%Wood
4.7%Fuel oil, kerosene, etc.
0.6%No fuel used
Population in 1990: 5,780. Population change in the 1990s: +112 (+1.9%).
Place of birth for U.S.-born residents:
This state: 5,160
Northeast: 53
Midwest: 213
South: 117
West: 57
59% of the 48412 zip code residents lived in the same house 5 years ago. Out of people who lived in different houses, 49% lived in this county. Out of people who lived in different counties, 50% lived in Michigan.
92% of the 48412 zip code residents lived in the same house 1 year ago. Out of people who lived in different houses, 34% moved from this county. Out of people who lived in different houses, 38% moved from different county within same state. Out of people who lived in different houses, 31% moved from different state.
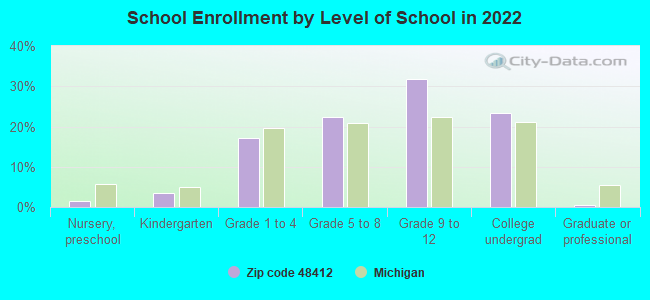
Private vs. public school enrollment:
Students in private schools in grades 1 to 8 (elementary and middle school): 6
Here:
1.6%
Michigan:
12.4%
Students in private schools in grades 9 to 12 (high school): 84
Here:
27.1%
Michigan:
9.8%
Students in private undergraduate colleges: 21
Here:
9.5%
Michigan:
14.9%
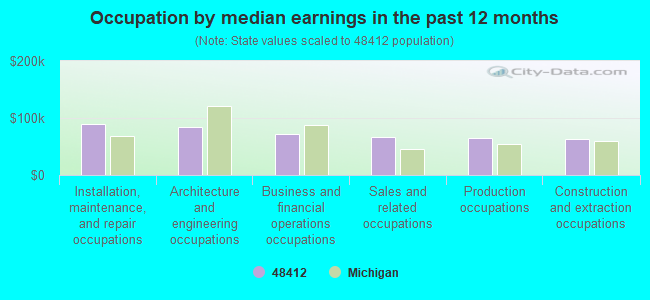
Occupation by median earnings in the past 12 months ($)
89,196Installation, maintenance, and repair occupations
84,925Architecture and engineering occupations
71,180Business and financial operations occupations
66,662Sales and related occupations
64,827Production occupations
62,760Construction and extraction occupations
Top industries in this zip code by the number of employees in 2005:
Administrative and Support and Waste Management and Remediation Services: Landscaping Services (20-49 employees: 1 establishment, 5-9 employees: 1 establishment, 1-4 employees: 2 establishments)
Construction: New Single-Family Housing Construction (except Operative Builders) (20-49: 1, 1-4: 2)
Construction: Framing Contractors (20-49: 1)
Accommodation and Food Services: Recreational and Vacation Camps (except Campgrounds) (20-49: 1)
Construction: Site Preparation Contractors (5-9: 1, 1-4: 5)
Wholesale Trade: Metal Service Centers and Other Metal Merchant Wholesalers (10-19: 1)
Health Care and Social Assistance: Services for the Elderly and Persons with Disabilities (5-9: 1, 1-4: 1)
Other Services (except Public Administration): Commercial and Industrial Machinery and Equipment (except Automotive and Electronic) Repair and Maintenance (5-9: 1, 1-4: 1)
People in group quarters in 2010:
19 people in group homes intended for adults
People in group quarters in 2000:
26 people in other group homes
Fatal accident statistics in 2014:
Fatal accident count: 1
Vehicles involved in fatal accidents: 2
Fatal accidents caused by drunken drivers: 1
Fatalities: 1
Persons involved in fatal accidents: 3
Pedestrians involved in fatal accidents: 0
Fatal accident statistics in 2012:
Fatal accident count: 1
Vehicles involved in fatal accidents: 3
Fatal accidents caused by drunken drivers: 0
Fatalities: 1
Persons involved in fatal accidents: 3
Pedestrians involved in fatal accidents: 0
Home Mortgage Disclosure Act Aggregated Statistics For Year 2009 (Based on 4 partial tracts)
A) FHA, FSA/RHS & VA Home Purchase Loans
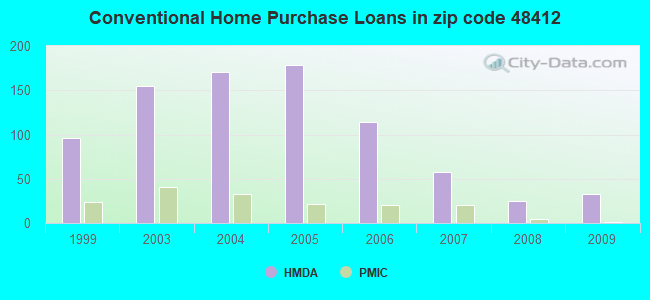
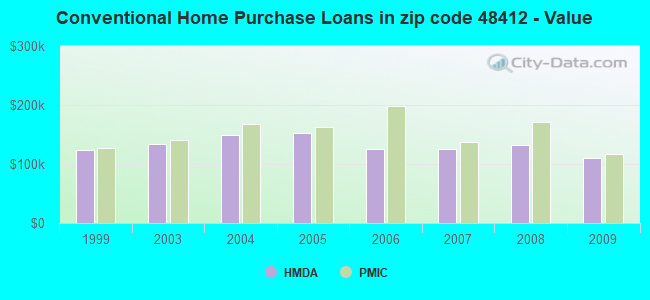
B) Conventional Home Purchase Loans
C) Refinancings
D) Home Improvement Loans
F) Non-occupant Loans on < 5 Family Dwellings (A B C & D)
G) Loans On Manufactured Home Dwelling (A B C & D)
Number
Average Value
Number
Average Value
Number
Average Value
Number
Average Value
Number
Average Value
Number
Average Value
LOANS ORIGINATED
32
$101,738
33
$110,894
190
$149,354
7
$91,979
13
$101,815
10
$72,794
APPLICATIONS APPROVED, NOT ACCEPTED
0
$0
0
$0
22
$135,955
1
$8,650
0
$0
0
$0
APPLICATIONS DENIED
17
$87,505
4
$104,795
100
$147,645
12
$121,248
4
$138,438
6
$62,622
APPLICATIONS WITHDRAWN
12
$70,191
1
$54,230
35
$174,981
3
$94,653
1
$102,590
3
$70,927
FILES CLOSED FOR INCOMPLETENESS
0
$0
1
$249,150
10
$148,488
0
$0
0
$0
0
$0
Aggregated Statistics For Year 2008 (Based on 4 partial tracts)
A) FHA, FSA/RHS & VA Home Purchase Loans
B) Conventional Home Purchase Loans
C) Refinancings
D) Home Improvement Loans
F) Non-occupant Loans on < 5 Family Dwellings (A B C & D)
G) Loans On Manufactured Home Dwelling (A B C & D)
Number
Average Value
Number
Average Value
Number
Average Value
Number
Average Value
Number
Average Value
Number
Average Value
LOANS ORIGINATED
25
$132,169
25
$132,744
145
$144,728
13
$37,370
15
$103,926
13
$96,835
APPLICATIONS APPROVED, NOT ACCEPTED
1
$142,160
3
$91,637
25
$143,916
9
$11,943
1
$103,780
1
$63,020
APPLICATIONS DENIED
6
$105,732
17
$160,634
100
$173,014
27
$76,928
6
$269,542
16
$78,342
APPLICATIONS WITHDRAWN
4
$123,002
7
$262,129
39
$180,354
3
$14,413
1
$554,940
1
$252,080
FILES CLOSED FOR INCOMPLETENESS
0
$0
3
$104,743
7
$148,103
0
$0
3
$104,743
0
$0
Aggregated Statistics For Year 2007 (Based on 4 partial tracts)
A) FHA, FSA/RHS & VA Home Purchase Loans
B) Conventional Home Purchase Loans
C) Refinancings
D) Home Improvement Loans
F) Non-occupant Loans on < 5 Family Dwellings (A B C & D)
G) Loans On Manufactured Home Dwelling (A B C & D)
Number
Average Value
Number
Average Value
Number
Average Value
Number
Average Value
Number
Average Value
Number
Average Value
LOANS ORIGINATED
15
$139,611
58
$125,069
258
$140,879
38
$50,488
17
$136,531
29
$105,789
APPLICATIONS APPROVED, NOT ACCEPTED
0
$0
13
$101,315
62
$166,000
15
$71,986
4
$172,800
7
$126,843
APPLICATIONS DENIED
4
$151,788
26
$117,754
190
$159,774
33
$96,246
7
$116,933
19
$98,086
APPLICATIONS WITHDRAWN
1
$191,710
4
$72,592
58
$162,585
12
$44,510
1
$129,730
0
$0
FILES CLOSED FOR INCOMPLETENESS
0
$0
3
$104,547
23
$140,092
1
$14,410
1
$93,690
1
$201,800
Aggregated Statistics For Year 2006 (Based on 4 partial tracts)
A) FHA, FSA/RHS & VA Home Purchase Loans
B) Conventional Home Purchase Loans
C) Refinancings
D) Home Improvement Loans
F) Non-occupant Loans on < 5 Family Dwellings (A B C & D)
G) Loans On Manufactured Home Dwelling (A B C & D)
Number
Average Value
Number
Average Value
Number
Average Value
Number
Average Value
Number
Average Value
Number
Average Value
LOANS ORIGINATED
7
$159,679
114
$126,186
325
$148,711
32
$24,333
22
$167,669
23
$94,000
APPLICATIONS APPROVED, NOT ACCEPTED
0
$0
14
$160,808
73
$148,510
9
$97,583
1
$311,340
1
$25,950
APPLICATIONS DENIED
7
$170,773
19
$124,735
210
$146,581
42
$59,278
3
$94,653
19
$159,390
APPLICATIONS WITHDRAWN
3
$129,047
10
$115,821
104
$147,872
7
$105,367
1
$311,340
6
$122,180
FILES CLOSED FOR INCOMPLETENESS
0
$0
1
$26,380
54
$168,191
0
$0
0
$0
1
$219,090
Aggregated Statistics For Year 2005 (Based on 4 partial tracts)
A) FHA, FSA/RHS & VA Home Purchase Loans
B) Conventional Home Purchase Loans
C) Refinancings
D) Home Improvement Loans
F) Non-occupant Loans on < 5 Family Dwellings (A B C & D)
G) Loans On Manufactured Home Dwelling (A B C & D)
Number
Average Value
Number
Average Value
Number
Average Value
Number
Average Value
Number
Average Value
Number
Average Value
LOANS ORIGINATED
16
$150,213
178
$152,503
492
$143,579
35
$65,018
20
$125,804
31
$90,350
APPLICATIONS APPROVED, NOT ACCEPTED
0
$0
36
$100,978
88
$148,347
9
$27,514
6
$97,832
10
$92,353
APPLICATIONS DENIED
1
$224,860
49
$84,623
263
$144,149
17
$72,839
3
$199,810
35
$97,075
APPLICATIONS WITHDRAWN
3
$152,307
43
$107,697
148
$167,406
17
$153,508
6
$144,138
7
$115,216
FILES CLOSED FOR INCOMPLETENESS
0
$0
3
$160,477
55
$162,366
1
$29,310
0
$0
4
$144,620
Aggregated Statistics For Year 2004 (Based on 4 partial tracts)
A) FHA, FSA/RHS & VA Home Purchase Loans
B) Conventional Home Purchase Loans
C) Refinancings
D) Home Improvement Loans
F) Non-occupant Loans on < 5 Family Dwellings (A B C & D)
G) Loans On Manufactured Home Dwelling (A B C & D)
Number
Average Value
Number
Average Value
Number
Average Value
Number
Average Value
Number
Average Value
Number
Average Value
LOANS ORIGINATED
23
$155,425
171
$149,164
467
$140,775
38
$78,560
25
$167,927
29
$94,257
APPLICATIONS APPROVED, NOT ACCEPTED
3
$123,110
26
$146,129
102
$155,513
6
$53,293
0
$0
9
$113,621
APPLICATIONS DENIED
4
$180,270
39
$73,435
219
$140,816
20
$66,630
9
$61,152
30
$90,465
APPLICATIONS WITHDRAWN
3
$137,413
9
$115,811
152
$146,514
13
$86,546
3
$187,027
9
$103,987
FILES CLOSED FOR INCOMPLETENESS
0
$0
7
$146,649
68
$165,919
1
$199,320
0
$0
0
$0
Aggregated Statistics For Year 2003 (Based on 4 partial tracts)
A) FHA, FSA/RHS & VA Home Purchase Loans
B) Conventional Home Purchase Loans
C) Refinancings
D) Home Improvement Loans
F) Non-occupant Loans on < 5 Family Dwellings (A B C & D)
Number
Average Value
Number
Average Value
Number
Average Value
Number
Average Value
Number
Average Value
LOANS ORIGINATED
13
$142,985
155
$133,873
946
$137,269
29
$27,533
25
$115,965
APPLICATIONS APPROVED, NOT ACCEPTED
0
$0
20
$114,602
147
$121,019
10
$18,737
9
$67,426
APPLICATIONS DENIED
3
$102,577
36
$81,485
290
$135,847
22
$34,878
12
$69,548
APPLICATIONS WITHDRAWN
0
$0
14
$122,507
144
$129,087
1
$50,450
0
$0
FILES CLOSED FOR INCOMPLETENESS
1
$142,700
3
$165,760
41
$150,145
3
$21,783
1
$172,970
Aggregated Statistics For Year 1999 (Based on 2 partial tracts)
A) FHA, FSA/RHS & VA Home Purchase Loans
B) Conventional Home Purchase Loans
C) Refinancings
D) Home Improvement Loans
F) Non-occupant Loans on < 5 Family Dwellings (A B C & D)
Detailed PMIC statistics for the following Tracts:3330.00
, 3385.00
2002 - 2018 National Fire Incident Reporting System (NFIRS) incidents
According to the data from the years 2002 - 2018 the average number of fires per year is 31. The highest number of fires - 56 took place in 2005, and the least - 18 in 2016. The data has a constant trend.
When looking into fire subcategories, the most reports belonged to: Structure Fires (56.6%), and Outside Fires (24.1%).
Fire incident types reported to NFIRS in Zip Code 48412


 Nearest zip codes: 48461, 48444, 48428, 48446, 48455, 48003.


 According to the data from the years 2002 - 2018 the average number of fires per year is 31. The highest number of fires - 56 took place in 2005, and the least - 18 in 2016. The data has a constant trend.
 When looking into fire subcategories, the most reports belonged to: Structure Fires (56.6%), and Outside Fires (24.1%).