Races in North Las Vegas, Nevada (NV) Detailed Stats
Data:
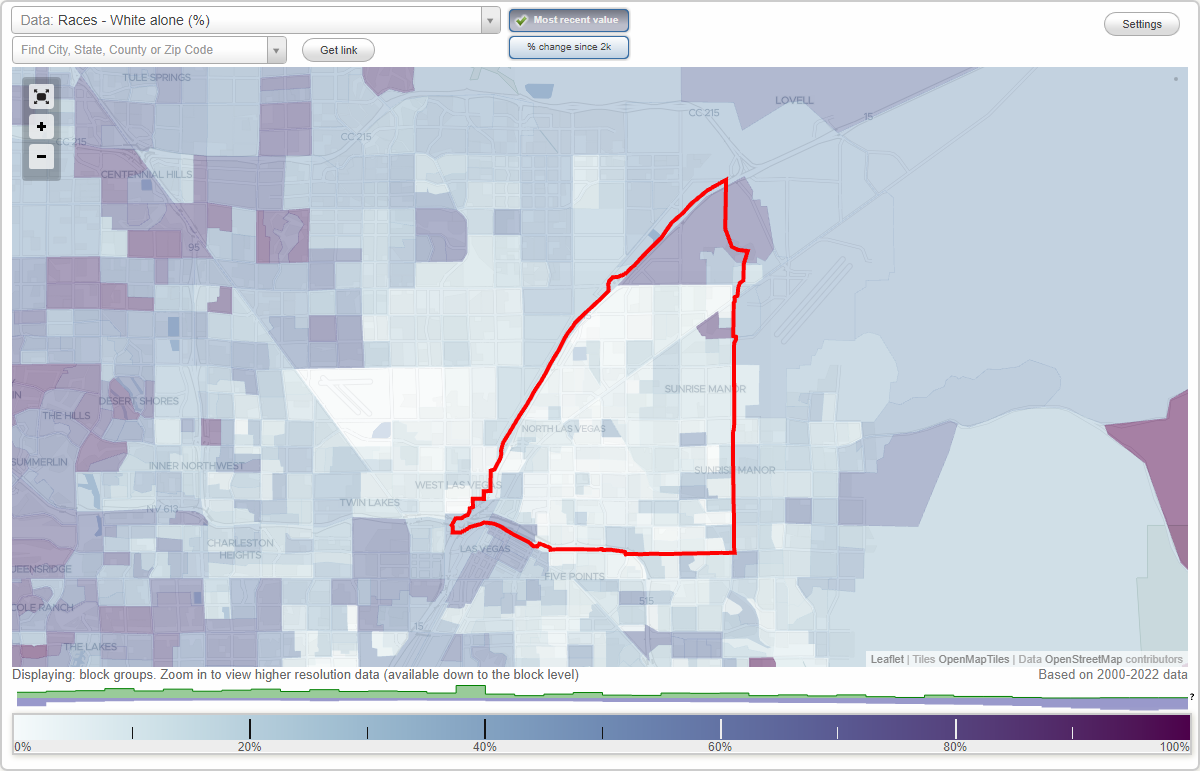
Races - White alone (%)
Races - White alone (% change since 2000)
Races - Black alone (%)
Races - Black alone (% change since 2000)
Races - American Indian alone (%)
Races - American Indian alone (% change since 2000)
Races - Asian alone (%)
Races - Asian alone (% change since 2000)
Races - Hispanic (%)
Races - Hispanic (% change since 2000)
Races - Native Hawaiian and Other Pacific Islander alone (%)
Races - Native Hawaiian and Other Pacific Islander alone (% change since 2000)
Races - Two or more races(%)
Races - Two or more races(% change since 2000)
Races - Other race alone (%)
Races - Other race alone (% change since 2000)
Racial diversity
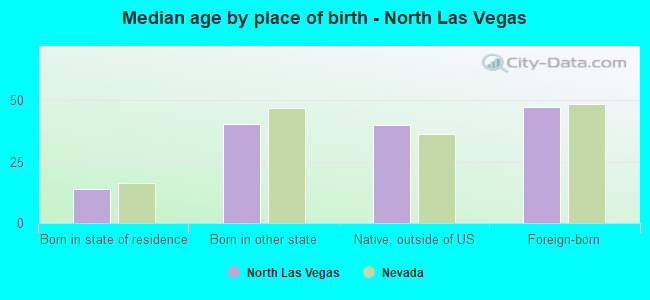
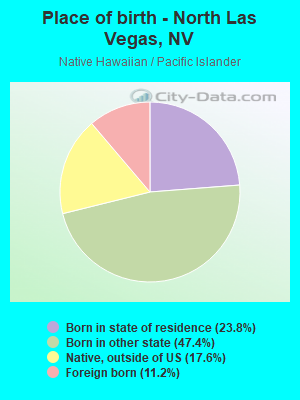
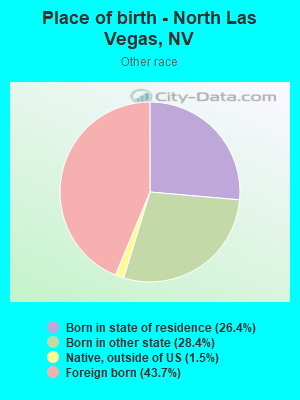
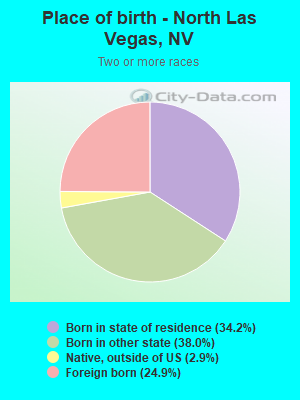
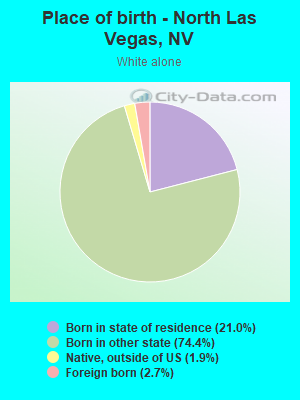
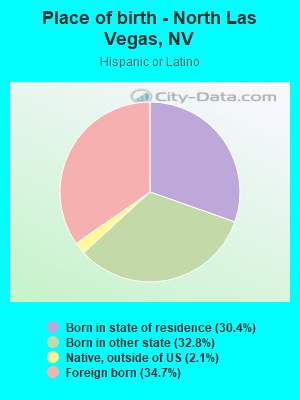
Place of birth - Born in state of residence (%)
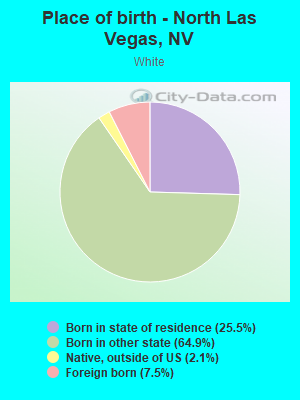
Place of birth - Born in state of residence (%) - White
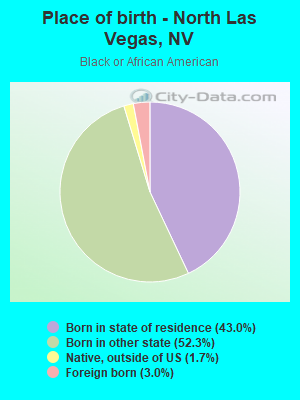
Place of birth - Born in state of residence (%) - Black or African American
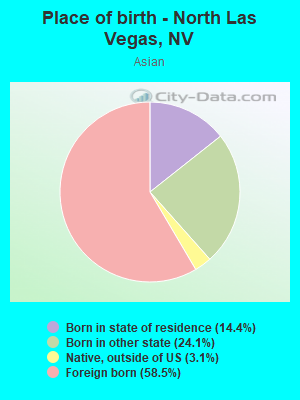
Place of birth - Born in state of residence (%) - Asian
Place of birth - Born in state of residence (%) - Hispanic or Latino
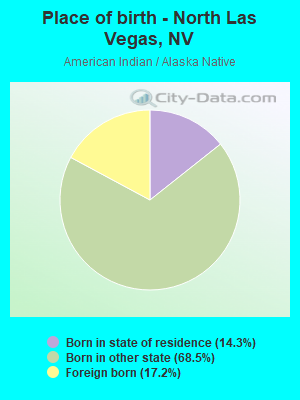
Place of birth - Born in state of residence (%) - American Indian and Alaska Native
Place of birth - Born in state of residence (%) - Multirace
Place of birth - Born in state of residence (%) - Other Race
Place of birth - Born in other state (%)
Place of birth - Born in other state (%) - White
Place of birth - Born in other state (%) - Black or African American
Place of birth - Born in other state (%) - Asian
Place of birth - Born in other state (%) - Hispanic or Latino
Place of birth - Born in other state (%) - American Indian and Alaska Native
Place of birth - Born in other state (%) - Multirace
Place of birth - Born in other state (%) - Other Race
Place of birth - Native, outside of US (%)
Place of birth - Native, outside of US (%) - White
Place of birth - Native, outside of US (%) - Black or African American
Place of birth - Native, outside of US (%) - Asian
Place of birth - Native, outside of US (%) - Hispanic or Latino
Place of birth - Native, outside of US (%) - American Indian and Alaska Native
Place of birth - Native, outside of US (%) - Multirace
Place of birth - Native, outside of US (%) - Other Race
Place of birth - Foreign born (%)
Place of birth - Foreign born (%) - White
Place of birth - Foreign born (%) - Black or African American
Place of birth - Foreign born (%) - Asian
Place of birth - Foreign born (%) - Hispanic or Latino
Place of birth - Foreign born (%) - American Indian and Alaska Native
Place of birth - Foreign born (%) - Multirace
Place of birth - Foreign born (%) - Other Race
Residents speaking English at home (%)
Residents speaking English at home - Born in the United States (%)
Residents speaking English at home - Native, born elsewhere (%)
Residents speaking English at home - Foreign born (%)
Residents speaking Spanish at home (%)
Residents speaking Spanish at home - Born in the United States (%)
Residents speaking Spanish at home - Native, born elsewhere (%)
Residents speaking Spanish at home - Foreign born (%)
Residents speaking other language at home (%)
Residents speaking other language at home - Born in the United States (%)
Residents speaking other language at home - Native, born elsewhere (%)
Residents speaking other language at home - Foreign born (%)
Marital status - Never married (%)
Marital status - Now married (%)
Marital status - Separated (%)
Marital status - Widowed (%)
Marital status - Divorced (%)
Ancestries Reported - Arab (%)
Ancestries Reported - Czech (%)
Ancestries Reported - Danish (%)
Ancestries Reported - Dutch (%)
Ancestries Reported - English (%)
Ancestries Reported - French (%)
Ancestries Reported - French Canadian (%)
Ancestries Reported - German (%)
Ancestries Reported - Greek (%)
Ancestries Reported - Hungarian (%)
Ancestries Reported - Irish (%)
Ancestries Reported - Italian (%)
Ancestries Reported - Lithuanian (%)
Ancestries Reported - Norwegian (%)
Ancestries Reported - Polish (%)
Ancestries Reported - Portuguese (%)
Ancestries Reported - Russian (%)
Ancestries Reported - Scotch-Irish (%)
Ancestries Reported - Scottish (%)
Ancestries Reported - Slovak (%)
Ancestries Reported - Subsaharan African (%)
Ancestries Reported - Swedish (%)
Ancestries Reported - Swiss (%)
Ancestries Reported - Ukrainian (%)
Ancestries Reported - United States (%)
Ancestries Reported - Welsh (%)
Ancestries Reported - West Indian (%)
Ancestries Reported - Other (%)
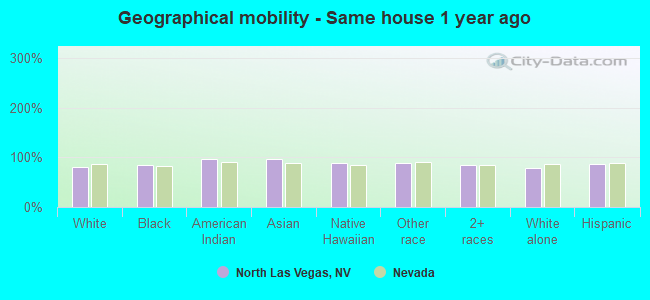
Geographical mobility - Same house 1 year ago (%)
Geographical mobility - Same house 1 year ago (%) - White
Geographical mobility - Same house 1 year ago (%) - Black or African American
Geographical mobility - Same house 1 year ago (%) - Asian
Geographical mobility - Same house 1 year ago (%) - Hispanic or Latino
Geographical mobility - Same house 1 year ago (%) - American Indian and Alaska Native
Geographical mobility - Same house 1 year ago (%) - Multirace
Geographical mobility - Same house 1 year ago (%) - Other Race
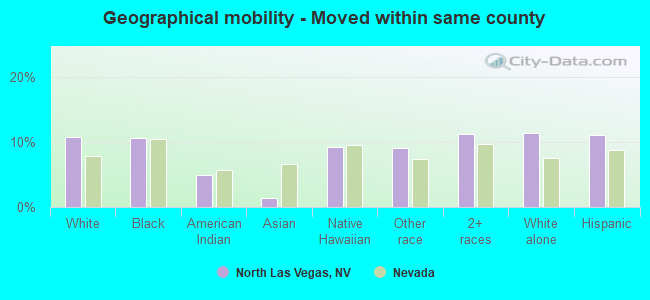
Geographical mobility - Moved within same county (%)
Geographical mobility - Moved within same county (%) - White
Geographical mobility - Moved within same county (%) - Black or African American
Geographical mobility - Moved within same county (%) - Asian
Geographical mobility - Moved within same county (%) - Hispanic or Latino
Geographical mobility - Moved within same county (%) - American Indian and Alaska Native
Geographical mobility - Moved within same county (%) - Multirace
Geographical mobility - Moved within same county (%) - Other Race
Geographical mobility - Moved from different county within same state (%)
Geographical mobility - Moved from different county within same state (%) - White
Geographical mobility - Moved from different county within same state (%) - Black or African American
Geographical mobility - Moved from different county within same state (%) - Asian
Geographical mobility - Moved from different county within same state (%) - Hispanic or Latino
Geographical mobility - Moved from different county within same state (%) - American Indian and Alaska Native
Geographical mobility - Moved from different county within same state (%) - Multirace
Geographical mobility - Moved from different county within same state (%) - Other Race
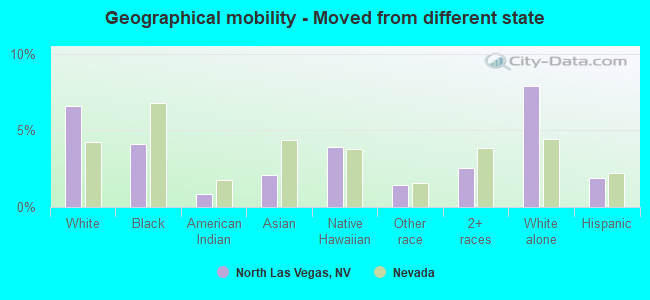
Geographical mobility - Moved from different state (%)
Geographical mobility - Moved from different state (%) - White
Geographical mobility - Moved from different state (%) - Black or African American
Geographical mobility - Moved from different state (%) - Asian
Geographical mobility - Moved from different state (%) - Hispanic or Latino
Geographical mobility - Moved from different state (%) - American Indian and Alaska Native
Geographical mobility - Moved from different state (%) - Multirace
Geographical mobility - Moved from different state (%) - Other Race
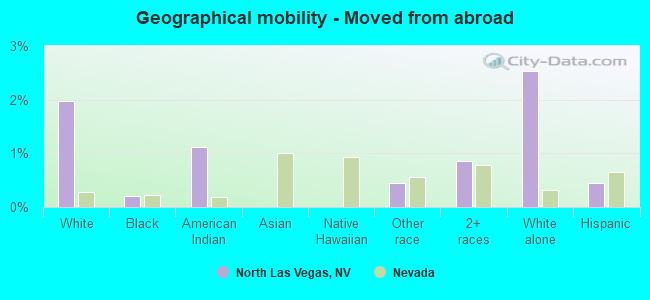
Geographical mobility - Moved from abroad (%)
Geographical mobility - Moved from abroad (%) - White
Geographical mobility - Moved from abroad (%) - Black or African American
Geographical mobility - Moved from abroad (%) - Asian
Geographical mobility - Moved from abroad (%) - Hispanic or Latino
Geographical mobility - Moved from abroad (%) - American Indian and Alaska Native
Geographical mobility - Moved from abroad (%) - Multirace
Geographical mobility - Moved from abroad (%) - Other Race
Place of birth for the foreign-born population - Ireland (%)
Place of birth for the foreign-born population - Denmark (%)
Place of birth for the foreign-born population - Norway (%)
Place of birth for the foreign-born population - Sweden (%)
Place of birth for the foreign-born population - United Kingdom (%)
Place of birth for the foreign-born population - England (%)
Place of birth for the foreign-born population - Scotland (%)
Place of birth for the foreign-born population - Other Northern Europe (%)
Place of birth for the foreign-born population - Austria (%)
Place of birth for the foreign-born population - Belgium (%)
Place of birth for the foreign-born population - France (%)
Place of birth for the foreign-born population - Germany (%)
Place of birth for the foreign-born population - Netherlands (%)
Place of birth for the foreign-born population - Switzerland (%)
Place of birth for the foreign-born population - Other Western Europe (%)
Place of birth for the foreign-born population - Greece (%)
Place of birth for the foreign-born population - Italy (%)
Place of birth for the foreign-born population - Portugal (%)
Place of birth for the foreign-born population - Spain (%)
Place of birth for the foreign-born population - Other Southern Europe (%)
Place of birth for the foreign-born population - Albania (%)
Place of birth for the foreign-born population - Belarus (%)
Place of birth for the foreign-born population - Bosnia and Herzegovina (%)
Place of birth for the foreign-born population - Bulgaria (%)
Place of birth for the foreign-born population - Croatia (%)
Place of birth for the foreign-born population - Czechoslovakia (%)
Place of birth for the foreign-born population - Hungary (%)
Place of birth for the foreign-born population - Latvia (%)
Place of birth for the foreign-born population - Lithuania (%)
Place of birth for the foreign-born population - North Macedonia (Macedonia) (%)
Place of birth for the foreign-born population - Moldova (%)
Place of birth for the foreign-born population - Poland (%)
Place of birth for the foreign-born population - Romania (%)
Place of birth for the foreign-born population - Russia (%)
Place of birth for the foreign-born population - Serbia (%)
Place of birth for the foreign-born population - Ukraine (%)
Place of birth for the foreign-born population - Other Eastern Europe (%)
Place of birth for the foreign-born population - China (%)
Place of birth for the foreign-born population - Hong Kong (%)
Place of birth for the foreign-born population - Taiwan (%)
Place of birth for the foreign-born population - Japan (%)
Place of birth for the foreign-born population - Korea (%)
Place of birth for the foreign-born population - Other Eastern Asia (%)
Place of birth for the foreign-born population - Afghanistan (%)
Place of birth for the foreign-born population - Bangladesh (%)
Place of birth for the foreign-born population - India (%)
Place of birth for the foreign-born population - Iran (%)
Place of birth for the foreign-born population - Kazakhstan (%)
Place of birth for the foreign-born population - Nepal (%)
Place of birth for the foreign-born population - Pakistan (%)
Place of birth for the foreign-born population - Sri Lanka (%)
Place of birth for the foreign-born population - Uzbekistan (%)
Place of birth for the foreign-born population - Other South Central Asia (%)
Place of birth for the foreign-born population - Burma (%)
Place of birth for the foreign-born population - Cambodia (%)
Place of birth for the foreign-born population - Indonesia (%)
Place of birth for the foreign-born population - Laos (%)
Place of birth for the foreign-born population - Malaysia (%)
Place of birth for the foreign-born population - Philippines (%)
Place of birth for the foreign-born population - Singapore (%)
Place of birth for the foreign-born population - Thailand (%)
Place of birth for the foreign-born population - Vietnam (%)
Place of birth for the foreign-born population - Other South Eastern Asia (%)
Place of birth for the foreign-born population - Armenia (%)
Place of birth for the foreign-born population - Iraq (%)
Place of birth for the foreign-born population - Israel (%)
Place of birth for the foreign-born population - Jordan (%)
Place of birth for the foreign-born population - Kuwait (%)
Place of birth for the foreign-born population - Lebanon (%)
Place of birth for the foreign-born population - Saudi Arabia (%)
Place of birth for the foreign-born population - Syria (%)
Place of birth for the foreign-born population - Turkey (%)
Place of birth for the foreign-born population - Yemen (%)
Place of birth for the foreign-born population - Other Western Asia (%)
Place of birth for the foreign-born population - Eritrea (%)
Place of birth for the foreign-born population - Ethiopia (%)
Place of birth for the foreign-born population - Kenya (%)
Place of birth for the foreign-born population - Somalia (%)
Place of birth for the foreign-born population - Uganda (%)
Place of birth for the foreign-born population - Zimbabwe (%)
Place of birth for the foreign-born population - Other Eastern Africa (%)
Place of birth for the foreign-born population - Cameroon (%)
Place of birth for the foreign-born population - Congo (%)
Place of birth for the foreign-born population - Democratic Republic of Congo (Zaire) (%)
Place of birth for the foreign-born population - Other Middle Africa (%)
Place of birth for the foreign-born population - Egypt (%)
Place of birth for the foreign-born population - Morocco (%)
Place of birth for the foreign-born population - Sudan (%)
Place of birth for the foreign-born population - Other Northern Africa (%)
Place of birth for the foreign-born population - South Africa (%)
Place of birth for the foreign-born population - Other Southern Africa (%)
Place of birth for the foreign-born population - Cabo Verde (%)
Place of birth for the foreign-born population - Ghana (%)
Place of birth for the foreign-born population - Liberia (%)
Place of birth for the foreign-born population - Nigeria (%)
Place of birth for the foreign-born population - Senegal (%)
Place of birth for the foreign-born population - Sierra Leone (%)
Place of birth for the foreign-born population - Other Western Africa (%)
Place of birth for the foreign-born population - Australia (%)
Place of birth for the foreign-born population - New Zealand (%)
Place of birth for the foreign-born population - Fiji (%)
Place of birth for the foreign-born population - Micronesia (%)
Place of birth for the foreign-born population - Bahamas (%)
Place of birth for the foreign-born population - Barbados (%)
Place of birth for the foreign-born population - Cuba (%)
Place of birth for the foreign-born population - Dominica (%)
Place of birth for the foreign-born population - Dominican Republic (%)
Place of birth for the foreign-born population - Grenada (%)
Place of birth for the foreign-born population - Haiti (%)
Place of birth for the foreign-born population - Jamaica (%)
Place of birth for the foreign-born population - St. Vincent and the Grenadines (%)
Place of birth for the foreign-born population - Trinidad and Tobago (%)
Place of birth for the foreign-born population - West Indies (%)
Place of birth for the foreign-born population - Other Caribbean (%)
Place of birth for the foreign-born population - Belize (%)
Place of birth for the foreign-born population - Costa Rica (%)
Place of birth for the foreign-born population - El Salvador (%)
Place of birth for the foreign-born population - Guatemala (%)
Place of birth for the foreign-born population - Honduras (%)
Place of birth for the foreign-born population - Mexico (%)
Place of birth for the foreign-born population - Nicaragua (%)
Place of birth for the foreign-born population - Panama (%)
Place of birth for the foreign-born population - Other Central America (%)
Place of birth for the foreign-born population - Argentina (%)
Place of birth for the foreign-born population - Bolivia (%)
Place of birth for the foreign-born population - Brazil (%)
Place of birth for the foreign-born population - Chile (%)
Place of birth for the foreign-born population - Colombia (%)
Place of birth for the foreign-born population - Ecuador (%)
Place of birth for the foreign-born population - Guyana (%)
Place of birth for the foreign-born population - Peru (%)
Place of birth for the foreign-born population - Uruguay (%)
Place of birth for the foreign-born population - Venezuela (%)
Place of birth for the foreign-born population - Other South America (%)
Place of birth for the foreign-born population - Canada (%)
Place of birth for the foreign-born population - Other Northern America (%)
Place of birth for the foreign-born population - Other (%)
According to 2022 data, the most numerous races in North Las Vegas, NV are White alone (66,001 residents), Hispanic (115,998 residents), and Black alone (56,153 residents). 61.9% of North Las Vegas residents speak English at home. 21.0% of North Las Vegas, NV residents are foreign-born (15.4% born in Latin America, 4.5% born in Asia), which is 14.3% greater than the foreign-born rate of 18.0% across the entire state of Nevada.
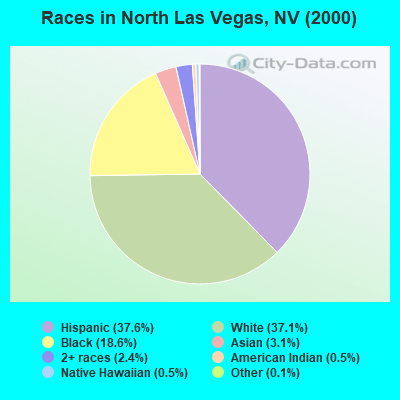
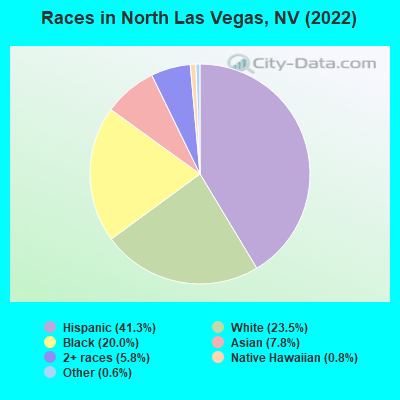
Race distribution in North Las Vegas
2000 2022
43,435 37.6% Hispanic 42,880 37.1% White alone 21,528 18.6% Black alone 3,604 3.1% Asian alone 2,786 2.4% Two or more races 547 0.5% Native Hawaiian and Other 565 0.5% American Indian alone 143 0.1% Other race alone
115,998 41.3% Hispanic 66,001 23.5% White alone 56,153 20.0% Black alone 21,838 7.8% Asian alone 16,402 5.8% Two or more races 2,108 0.8% Native Hawaiian and Other 1,782 0.6% Other race alone 257 0.09% American Indian alone
2000 2022
1,303,001 65.2% White alone 393,970 19.7% Hispanic 131,509 6.6% Black alone 88,593 4.4% Asian alone 49,231 2.5% Two or more races 21,397 1.1% American Indian alone 7,769 0.4% Native Hawaiian and Other 2,787 0.1% Other race alone
1,410,145 44.4% White alone 961,357 30.3% Hispanic 286,471 9.0% Black alone 281,149 8.8% Asian alone 182,151 5.7% Two or more races 20,102 0.6% Native Hawaiian and Other 18,781 0.6% Other race alone 17,616 0.6% American Indian alone
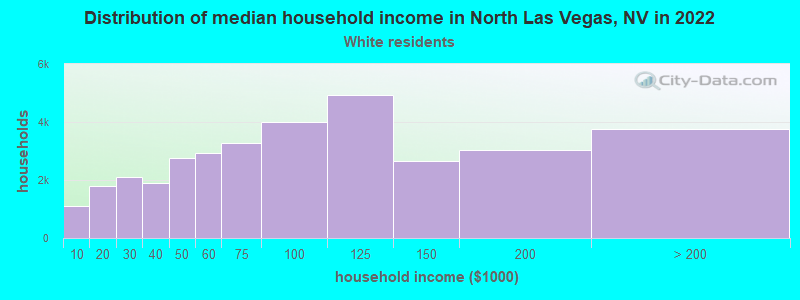
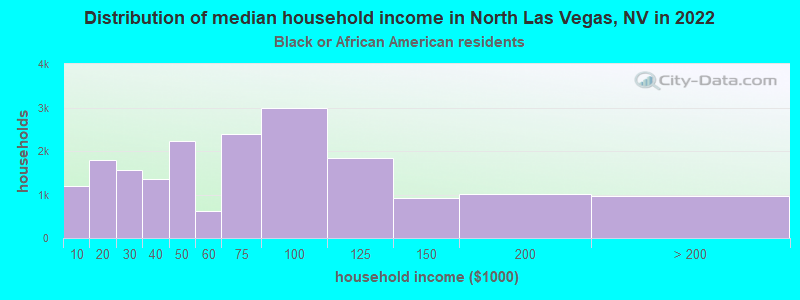
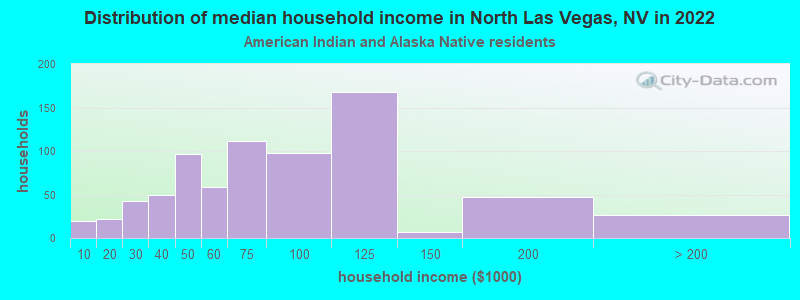
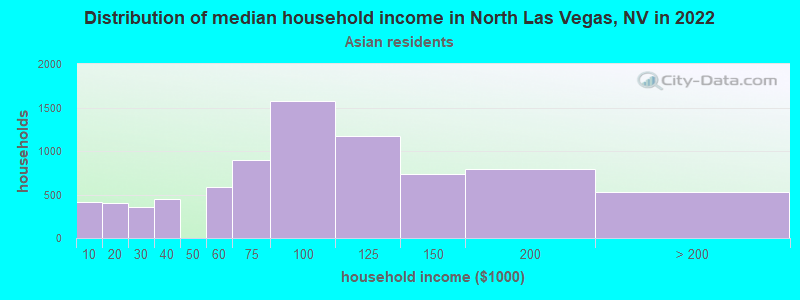
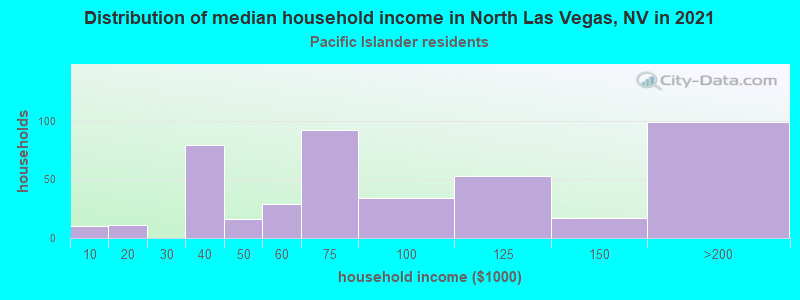
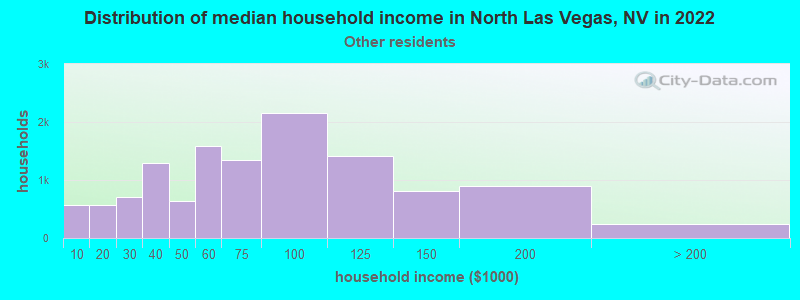
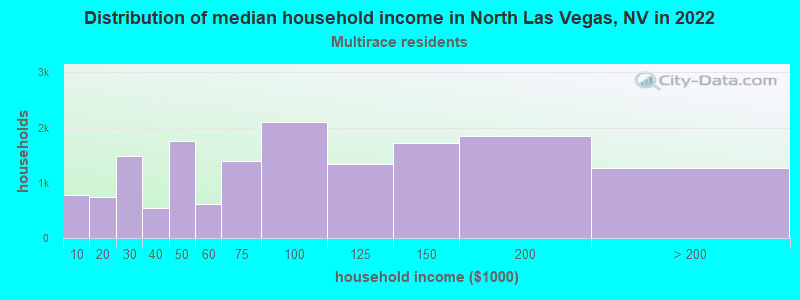
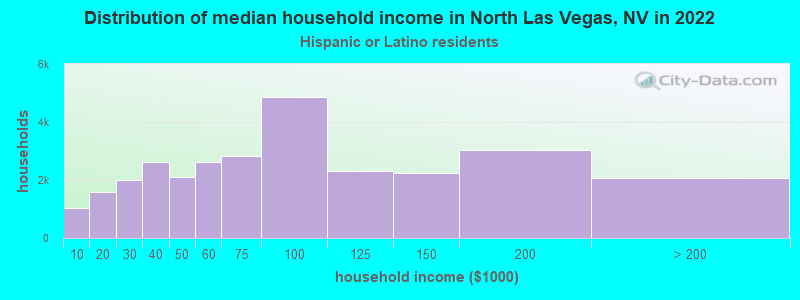
Income and house value in North Las Vegas Median household income in 2022 $80,283 White non-Hispanic householders$66,142 Black householders$70,997 American Indian and Alaska Native householders$84,170 Asian householders$89,719 Native Hawaiian and other Pacific Islander householders$71,846 Some other race householders$77,633 Two or more races householders$74,540 Hispanic or Latino race householdersMedian 2022 house value $441,673 White Non-Hispanic householders$394,156 Black or African American householders$417,060 American Indian or Alaska Native householders $457,399 Asian householders$522,351 Native Hawaiian and other Pacific Islander householders$327,153 Some other race householders$408,855 Two or more races householders$336,041 Hispanic or Latino householders
Median age by race in North Las Vegas
40.1 Median age for White residents41.0 39.4 31.6 Median age for Black or African American residents31.0 32.6 23.4 Median age for American Indian / Alaska Native residents23.1 39.4 45.2 Median age for Asian residents41.2 46.4 37.9 Median age for Native Hawaiian / Pacific Islander residents42.2 37.8 32.5 Median age for Other race residents32.8 32.3 29.0 Median age for Two or more races residents29.1 28.9 43.3 Median age for White alone residents43.5 42.9 30.5 Median age for Hispanic or Latino residents31.3 29.8
Owner/renter occupied households by race in North Las Vegas
House owners and renters - White residents 23,660 69.1% Owner occupied10,565 30.9% Renter occupiedHouse owners and renters - Black or African American residents 9,952 52.8% Owner occupied8,911 47.2% Renter occupiedHouse owners and renters - American Indian / Alaska Native residents 297 52.2% Owner occupied272 47.8% Renter occupiedHouse owners and renters - Asian residents 6,847 86.6% Owner occupied1,055 13.4% Renter occupiedHouse owners and renters - Native Hawaiian / Pacific Islander residents 378 58.3% Owner occupied270 41.7% Renter occupiedHouse owners and renters - Other race residents 7,143 58.5% Owner occupied5,076 41.5% Renter occupiedHouse owners and renters - Two or more races residents 10,273 65.9% Owner occupied5,326 34.1% Renter occupiedHouse owners and renters - White alone residents 19,490 68.4% Owner occupied8,996 31.6% Renter occupiedHouse owners and renters - Hispanic or Latino residents 18,183 62.0% Owner occupied11,140 38.0% Renter occupied
Language usage in North Las Vegas
English speakers - Total 61.9% of residents of North Las Vegas speak English at home.
30.6% of residents speak Spanish at home 50,991 63.0% Speak English very well29,981 37.0% Speak English less than very well7.4% of residents speak other language at home 14,638 74.8% Speak English very well4,936 25.2% Speak English less than very well
English speakers - Born in the United States 81.4% of residents of North Las Vegas speak English at home.
15.9% of residents speak Spanish at home 18,060 87.6% Speak English very well2,556 12.4% Speak English less than very well2.7% of residents speak other language at home 2,985 85.0% Speak English very well525 15.0% Speak English less than very well
English speakers - Native, born elsewhere 56.9% of residents of North Las Vegas speak English at home.
27.0% of residents speak Spanish at home 1,297 79.3% Speak English very well339 20.7% Speak English less than very well16.1% of residents speak other language at home 977 100.0% Speak English very well
English speakers - Foreign-born 8.9% of residents of North Las Vegas speak English at home.
67.3% of residents speak Spanish at home 14,500 37.4% Speak English very well24,246 62.6% Speak English less than very well23.8% of residents speak other language at home 9,372 68.4% Speak English very well4,324 31.6% Speak English less than very well
White (Caucasian) - Speak only English Native:
87.9% (65,341)Foreign-born:
18.4% (1,161)
White (Caucasian) - Speak another language Native:
12.1% (9,012)Foreign-born:
81.6% (5,136)
Black or African American - Speak only English Native:
95.2% (51,274)Foreign-born:
23.2% (401)
Black or African American - Speak another language Native:
4.8% (2,597)Foreign-born:
76.8% (1,327)
American Indian / Alaska Native - Speak only English Native:
74.4% (1,478)Foreign-born:
1.8% (13)
American Indian / Alaska Native - Speak another language Native:
23.8% (472)Foreign-born:
100.0% (729)
Asian - Speak only English Native:
74.0% (6,464)Foreign-born:
14.1% (1,894)
Asian - Speak another language Native:
26.0% (2,269)Foreign-born:
85.9% (11,530)
Native Hawaiian / Pacific Islander - Speak only English Native:
75.2% (1,348)Foreign-born:
73.8% (177)
Native Hawaiian / Pacific Islander - Speak another language Native:
23.9% (428)Foreign-born:
45.5% (109)
Other race - Speak only English Native:
29.8% (6,782)Foreign-born:
2.2% (438)
Other race - Speak another language Native:
70.2% (15,985)Foreign-born:
97.8% (19,301)
Two or more races - Speak only English Native:
60.3% (25,463)Foreign-born:
7.8% (1,218)
Two or more races - Speak another language Native:
39.7% (16,758)Foreign-born:
92.2% (14,427)
White alone - Speak only English Native:
95.9% (58,849)Foreign-born:
62.1% (1,109)
White alone - Speak another language Native:
4.1% (2,536)Foreign-born:
37.9% (678)
Hispanic or Latino - Speak only English Native:
42.4% (29,152)Foreign-born:
3.4% (1,368)
Hispanic or Latino - Speak another language Native:
57.6% (39,677)Foreign-born:
96.6% (38,675)
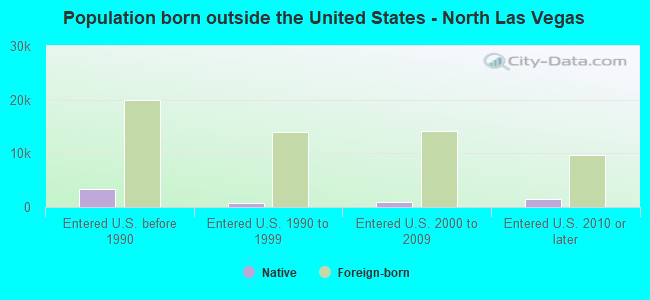
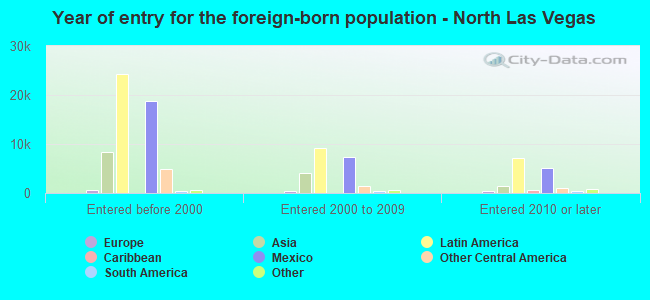
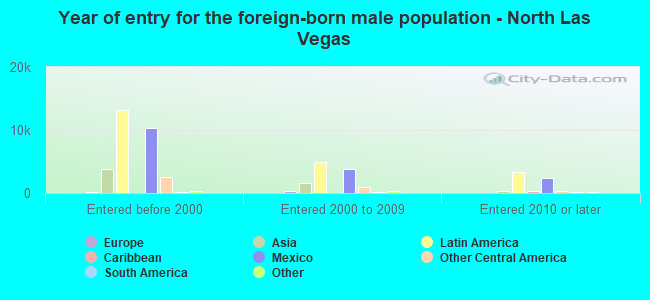
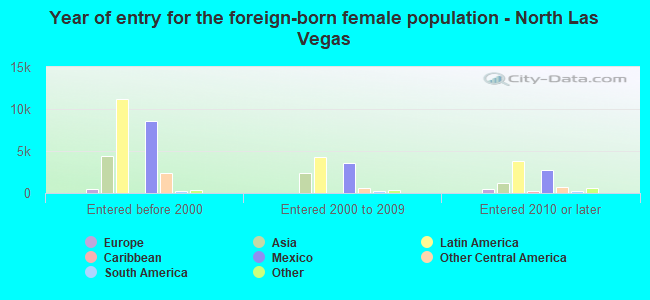
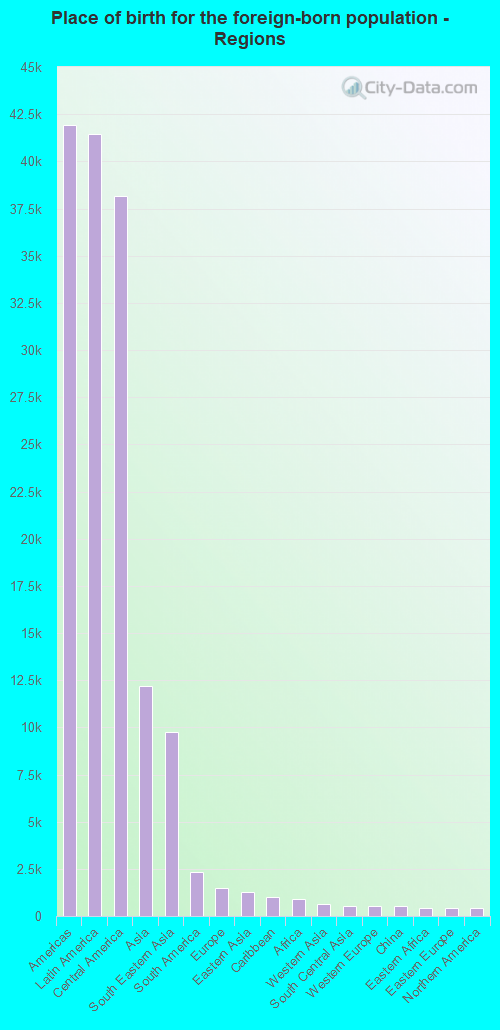
Foreign-born residents in North Las Vegas 56,831 residents are foreign born (15.4% Latin America , 4.5% Asia ).
This city:
21.0%Nevada:
19.1%
Marital status for residents in North Las Vegas Marital status - White (Caucasian) population 15 years and over
Males 27.8% Never married57.0% Now married0.6% Separated3.1% Widowed11.5% DivorcedFemales 25.0% Never married52.2% Now married2.3% Separated6.3% Widowed14.3% DivorcedWomen who gave birth in the past 12 months Now married:
61.6% (794)Unmarried:
38.4% (494)
Women who did not give birth in the past 12 months Now married:
50.3% (10,193)Unmarried:
49.7% (10,091)
Marital status - Black or African American population 15 years and over
Males 55.4% Never married33.4% Now married1.0% Separated2.3% Widowed8.0% DivorcedFemales 45.4% Never married24.3% Now married3.5% Separated11.9% Widowed14.8% DivorcedWomen who gave birth in the past 12 months Now married:
48.7% (553)Unmarried:
51.3% (583)
Women who did not give birth in the past 12 months Now married:
21.2% (2,834)Unmarried:
78.8% (10,521)
Marital status - American Indian / Alaska Native population 15 years and over
Males 38.9% Never married44.3% Now married2.6% Separated1.7% Widowed12.5% DivorcedFemales 33.8% Never married50.6% Now married3.4% Separated4.6% Widowed7.7% DivorcedWomen who gave birth in the past 12 months Now married:
63.6% (19)Unmarried:
36.4% (11)
Women who did not give birth in the past 12 months Now married:
57.1% (509)Unmarried:
42.9% (382)
Marital status - Asian population 15 years and over
Males 40.0% Never married52.3% Now married0.0% Separated1.0% Widowed6.6% DivorcedFemales 23.0% Never married52.0% Now married0.6% Separated17.0% Widowed7.4% DivorcedWomen who gave birth in the past 12 months Now married:
100.0% (101)Unmarried:
0.0% (0)
Women who did not give birth in the past 12 months Now married:
45.8% (2,584)Unmarried:
54.2% (3,058)
Marital status - Native Hawaiian / Pacific Islander population 15 years and over
Males 46.2% Never married40.7% Now married4.6% Separated4.5% Widowed4.0% DivorcedFemales 28.6% Never married35.6% Now married9.2% Separated8.5% Widowed18.2% DivorcedWomen who gave birth in the past 12 months Now married:
100.0% (5)Unmarried:
0.0% (0)
Women who did not give birth in the past 12 months Now married:
49.6% (360)Unmarried:
50.4% (366)
Marital status - Other race population 15 years and over
Males 42.4% Never married46.2% Now married1.1% Separated1.5% Widowed8.9% DivorcedFemales 37.9% Never married40.6% Now married4.7% Separated5.2% Widowed11.6% DivorcedWomen who gave birth in the past 12 months Now married:
74.2% (173)Unmarried:
25.8% (60)
Women who did not give birth in the past 12 months Now married:
43.3% (5,441)Unmarried:
56.7% (7,125)
Marital status - Two or more races population 15 years and over
Males 37.2% Never married52.7% Now married2.4% Separated1.2% Widowed6.4% DivorcedFemales 37.4% Never married40.8% Now married3.5% Separated7.5% Widowed10.7% DivorcedWomen who gave birth in the past 12 months Now married:
100.0% (495)Unmarried:
0.0% (0)
Women who did not give birth in the past 12 months Now married:
39.5% (5,988)Unmarried:
60.5% (9,178)
Marital status - White alone, not Hispanic / Latino population 15 years and over
Males 26.1% Never married57.7% Now married0.7% Separated3.5% Widowed12.1% DivorcedFemales 22.1% Never married54.2% Now married1.9% Separated5.4% Widowed16.4% DivorcedWomen who gave birth in the past 12 months Now married:
79.2% (687)Unmarried:
20.8% (180)
Women who did not give birth in the past 12 months Now married:
49.1% (7,056)Unmarried:
50.9% (7,318)
Marital status - Hispanic or Latino population 15 years and over
Males 41.4% Never married48.5% Now married1.7% Separated0.9% Widowed7.6% DivorcedFemales 36.5% Never married43.0% Now married4.3% Separated6.0% Widowed10.2% DivorcedWomen who gave birth in the past 12 months Now married:
67.6% (781)Unmarried:
32.4% (374)
Women who did not give birth in the past 12 months Now married:
45.4% (14,188)Unmarried:
54.6% (17,042)
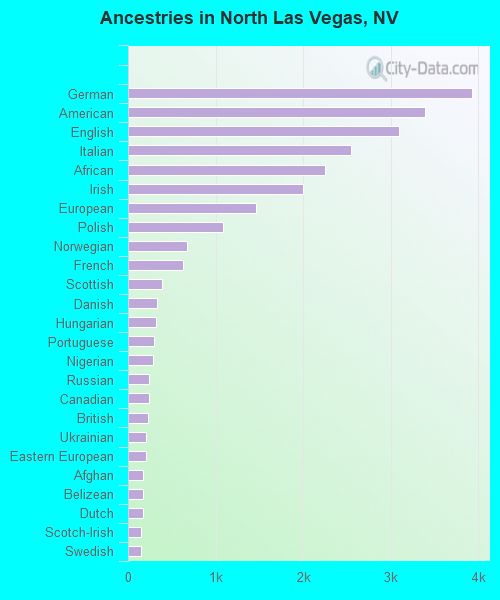
Ancestries in North Las Vegas
3,929 2.4% German3,392 2.1% American3,099 1.9% English2,543 1.6% Italian2,249 1.4% African1,998 1.2% Irish1,458 0.9% European1,085 0.7% Polish672 0.4% Norwegian625 0.4% French388 0.2% Scottish337 0.2% Danish321 0.2% Hungarian297 0.2% Portuguese285 0.2% Nigerian245 0.1% Russian241 0.1% Canadian230 0.1% British209 0.1% Ukrainian209 0.1% Eastern European176 0.1% Afghan171 0.1% Belizean171 0.1% Dutch151 0.09% Scotch-Irish150 0.09% Swedish130 0.08% Belgian99 0.06% French Canadian94 0.06% Slavic94 0.06% Jamaican93 0.06% Finnish93 0.06% Czech82 0.05% Iraqi80 0.05% Sudanese78 0.05% Northern European75 0.05% West Indian73 0.04% Scandinavian67 0.04% Australian65 0.04% Haitian62 0.04% Greek50 0.03% Croatian50 0.03% Armenian50 0.03% Turkish49 0.03% Kenyan49 0.03% Welsh47 0.03% Trinidadian and Tobagonian41 0.03% Zimbabwean36 0.02% Austrian32 0.02% Romanian30 0.02% Ethiopian27 0.02% Czechoslovakian27 0.02% Basque26 0.02% Cape Verdean23 0.01% Israeli21 0.01% Brazilian19 0.01% Assyrian17 0.01% Serbian16 0.01% Egyptian15 0.01% Bahamian15 0.01% New Zealander14 0.01% Iranian14 0.01% Swiss13 0.01% Slovak11 0.01% Barbadian10 0.01% Arab9 0.01% Slovene
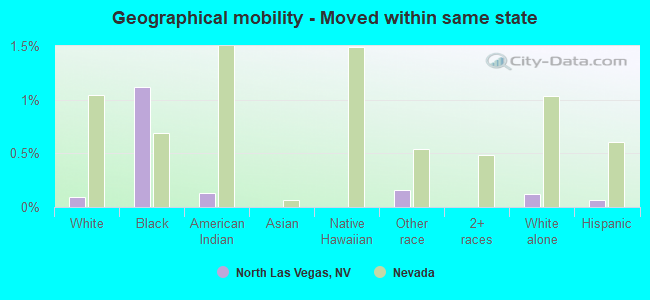
Geographical mobility in North Las Vegas Same house 1 year ago 67,706 80.6% White (Caucasian)48,234 83.9% Black or African American2,765 96.4% American Indian / Alaska Native22,135 96.6% Asian1,862 88.1% Native Hawaiian / Pacific Islander39,982 88.8% Other race53,774 85.3% Two or more races50,899 78.0% White alone, not Hispanic / Latino99,719 86.6% Hispanic or LatinoMoved within same county 9,026 10.7% White / Caucasian6,135 10.7% Black or African American140 4.9% American Indian / Alaska Native309 1.3% Asian194 9.2% Native Hawaiian / Pacific Islander4,104 9.1% Other race7,085 11.2% Two or more races7,483 11.5% White alone, not Hispanic / Latino12,740 11.1% Hispanic or LatinoMoved within same state 81 0.1% White / Caucasian644 1.1% Black or African American4 0.1% American Indian / Alaska Native73 0.2% Other race81 0.1% White alone, not Hispanic / Latino73 0.1% Hispanic or LatinoMoved from different state 5,528 6.6% White / Caucasian2,364 4.1% Black or African American24 0.9% American Indian / Alaska Native475 2.1% Asian82 3.9% Native Hawaiian / Pacific Islander645 1.4% Other race1,616 2.6% Two or more races5,167 7.9% White alone, not Hispanic / Latino2,165 1.9% Hispanic or LatinoMoved from abroad 1,659 2.0% White123 0.2% Black or African American32 1.1% American Indian / Alaska Native197 0.4% Other race538 0.9% Two or more races1,659 2.5% White alone, not Hispanic / Latino515 0.4% Hispanic or Latino
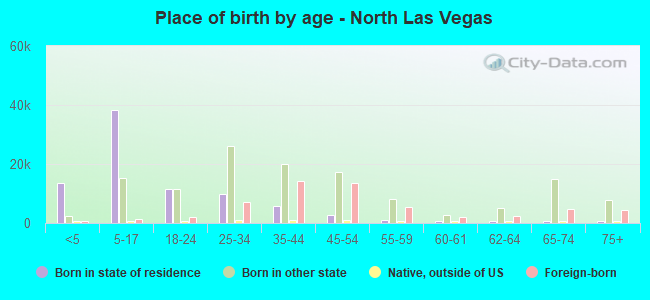
Children Nativity (place of birth) in North Las Vegas
Children under 6 years - Living with two parents Both parents native 6,711 100.0% NativeBoth parents foreign-born 2,056 100.0% NativeOne native, one foreign-born parent 2,968 100.0% NativeChildren under 6 years - Living with one parent Native parent 6,503 99.2% Native52 0.8% Foreign-bornForeign-born parent 981 91.7% Native89 8.3% Foreign-bornChildren 6 to 17 years - Living with two parents Both parents native 15,272 100.0% NativeBoth parents foreign-born 6,643 96.5% Native242 3.5% Foreign-bornOne native, one foreign-born parent 5,199 100.0% NativeChildren 6 to 17 years - Living with one parent Native parent 13,271 100.0% NativeForeign-born parent 6,846 53.6% Native5,924 46.4% Foreign-born
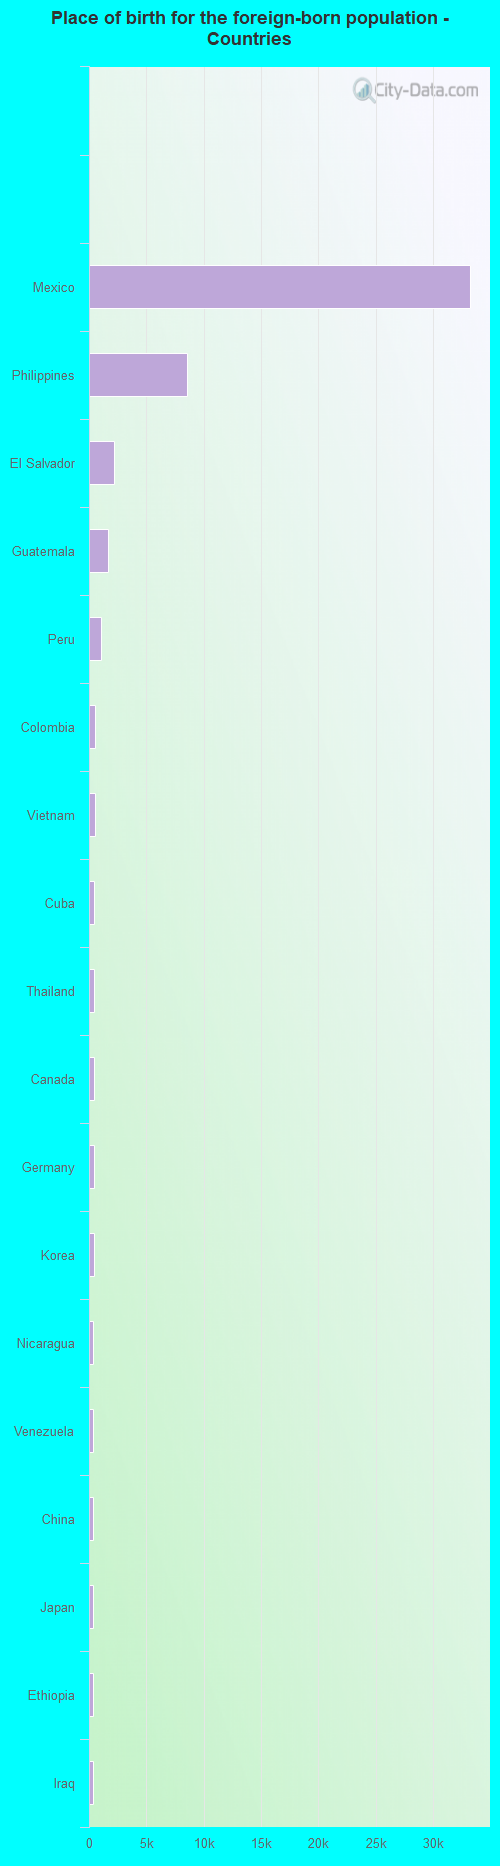
Place of birth for residents in North Las Vegas 41,901 Americas41,469 Latin America38,164 Central America12,179 Asia9,738 South Eastern Asia2,321 South America1,496 Europe1,264 Eastern Asia984 Caribbean889 Africa622 Western Asia542 South Central Asia534 Western Europe523 China441 Eastern Africa433 Eastern Europe432 Northern America364 Oceania282 Northern Europe238 Southern Europe164 Australia and New Zealand Subregion143 Western Africa116 Northern Africa62 Middle Africa47 Southern Africa33,201 Mexico8,543 Philippines2,208 El Salvador1,637 Guatemala1,042 Peru500 Colombia486 Vietnam468 Cuba447 Thailand432 Canada426 Germany411 Korea378 Nicaragua367 Venezuela362 China329 Japan311 Ethiopia311 Iraq281 Honduras217 Pakistan200 Belize176 Jamaica170 Turkey166 Argentina162 Italy162 Laos160 Panama147 England136 Dominican Republic135 Ecuador122 India110 United Kingdom98 Zimbabwe98 Ukraine96 Costa Rica94 Nepal89 Taiwan86 Nigeria85 New Zealand84 Poland82 Sudan79 West Indies78 Australia75 Netherlands70 Hong Kong69 Israel68 Micronesia57 Indonesia56 Ghana52 Afghanistan48 Czechoslovakia48 Russia47 South Africa44 Bolivia40 Haiti40 Iran37 Saudi Arabia37 Brazil36 Romania33 Portugal31 Kenya30 Hungary29 Croatia27 Moldova27 Cameroon26 Trinidad and Tobago26 Azores Islands25 Armenia24 Spain23 Scotland18 Singapore17 Egypt17 Greece16 Austria16 France15 Bhutan15 Bahamas15 Dominica14 Cambodia14 Belarus14 Uruguay10 Chile8 Morocco8 Serbia8 Algeria8 Malaysia7 Lebanon1 Norway
Grandparents responsible for own grandchildren in North Las Vegas
Grandparents (30 to 59 years) White / Caucasian 351 22.4% Responsible for grandchildren1,215 77.6% Not responsible for grandchildrenBlack or African American 141 20.2% Responsible for grandchildren558 79.8% Not responsible for grandchildrenAmerican Indian / Alaska Native 20 62.8% Responsible for grandchildren12 37.2% Not responsible for grandchildrenAsian 29 21.4% Responsible for grandchildren106 78.6% Not responsible for grandchildrenNative Hawaiian / Pacific Islander 12 18.6% Responsible for grandchildren51 81.4% Not responsible for grandchildrenOther race 520 29.0% Responsible for grandchildren1,274 71.0% Not responsible for grandchildrenTwo or more races 134 12.1% Responsible for grandchildren968 87.9% Not responsible for grandchildrenWhite alone, not Hispanic / Latino 411 49.1% Responsible for grandchildren426 50.9% Not responsible for grandchildrenHispanic or Latino 579 17.6% Responsible for grandchildren2,702 82.4% Not responsible for grandchildrenGrandparents (60 years and over) White / Caucasian 853 100.0% Not responsible for grandchildrenBlack or African American 231 34.1% Responsible for grandchildren447 65.9% Not responsible for grandchildrenAmerican Indian / Alaska Native 35 29.7% Responsible for grandchildren83 70.3% Not responsible for grandchildrenAsian 175 14.3% Responsible for grandchildren1,049 85.7% Not responsible for grandchildrenNative Hawaiian / Pacific Islander 10 10.8% Responsible for grandchildren84 89.2% Not responsible for grandchildrenOther race 93 7.8% Responsible for grandchildren1,091 92.2% Not responsible for grandchildrenTwo or more races 156 15.3% Responsible for grandchildren863 84.7% Not responsible for grandchildrenWhite alone, not Hispanic / Latino 171 26.6% Responsible for grandchildren474 73.4% Not responsible for grandchildrenHispanic or Latino 160 8.4% Responsible for grandchildren1,753 91.6% Not responsible for grandchildren