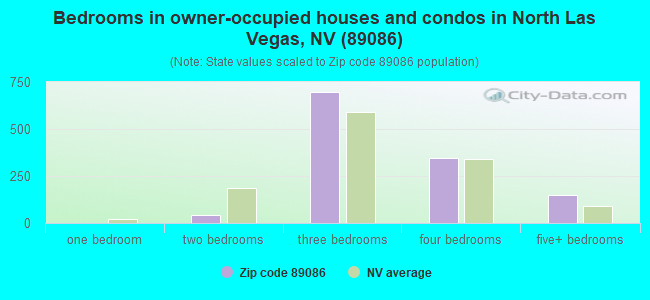
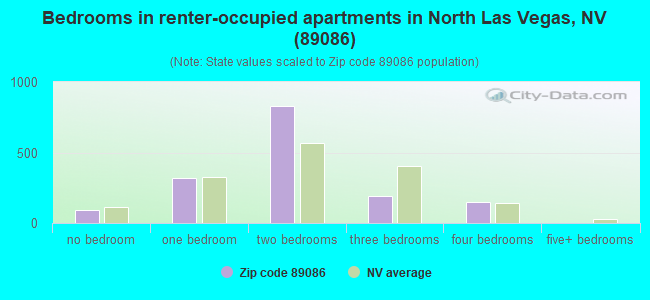
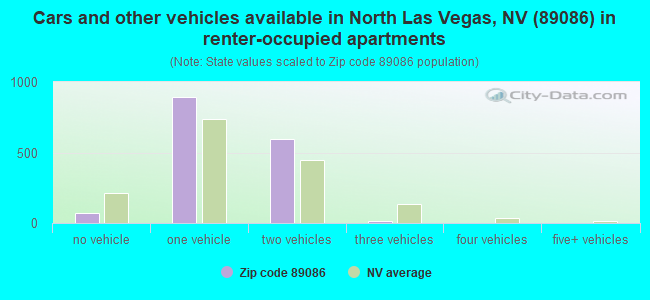
Houses and condos: 3,165 Renter-occupied apartments: 1,581
% of renters here:
56%
State:
40%
March 2022 cost of living index in zip code 89086: 96.2 (near average, U.S. average is 100)
Land area: 6.8 sq. mi. Water area: 0.0 sq. mi.
Population density: 1,076 people per square mile
(low).
OSM Map
Google Map
MSN Map
OSM Map
General Map
Google Map
MSN Map
OSM Map
Google Map
MSN Map
OSM Map
Google Map
MSN Map
Please wait while loading the map...
Real estate property taxes paid for housing units in 2022:
This zip code:
0.4% ($1,934)
Nevada:
0.4% ($1,889)
Median real estate property taxes paid for housing units with mortgages in 2022: $1,945 (0.4%) Median real estate property taxes paid for housing units with no mortgage in 2022: $1,797 (0.5%)
Business Search- 14 Million verified businesses
Males: 3,752
(51.3%)
Females: 3,557
(48.7%)
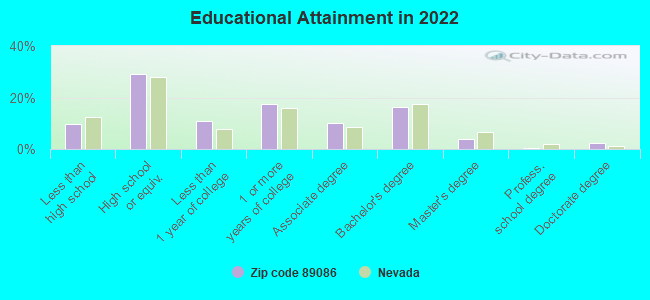
For population 25 years and over in 89086:
High school or higher: 90.0%
Bachelor's degree or higher: 22.7%
Graduate or professional degree: 6.6%
Unemployed: 10.0%
Mean travel time to work (commute): 23.8 minutes
For population 15 years and over in 89086:
Never married: 43.4%
Now married: 40.1%
Separated: 3.2%
Widowed: 3.9%
Divorced: 9.4%
Zip code 89086 compared to state average:
Unemployed percentage above state average.
Black race population percentage significantly above state average.
Median age below state average.
Length of stay since moving in significantly below state average.
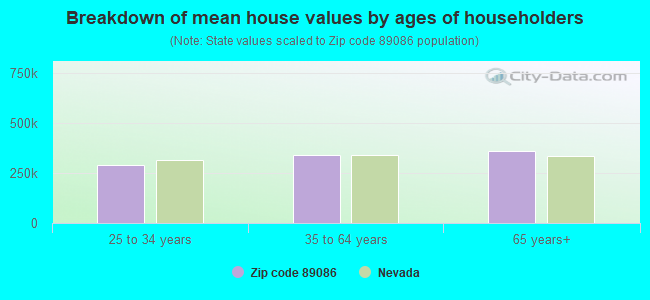
Estimated median house/condo value in 2022: $430,979
89086:
$430,979
Nevada:
$434,700
According to our research of Nevada and other state lists, there were 13 registered sex offenders living in 89086 zip code as of May 06, 2024. The ratio of all residents to sex offenders in zip code 89086 is 452 to 1. The ratio of registered sex offenders to all residents in this zip code is lower than the state average.
Median resident age:
This zip code:
32.2 years
Nevada median age:
39.0 years
Average household size:
This zip code:
2.6 people
Nevada:
2.6 people
Averages for the 2020 tax year for zip code 89086, filed in 2021:
Average Adjusted Gross Income (AGI) in 2020: $50,583 (Individual Income Tax Returns)
Here:
$50,583
State:
$78,964
Salary/wage: $45,872 (reported on 90.0% of returns)
Here:
$45,872
State:
$54,472
(% of AGI for various income ranges: 1268.2% for AGIs below $25k, 3627.1% for AGIs $25k-50k, 6838.0% for AGIs $50k-75k, 9598.0% for AGIs $75k-100k, 16370.0% for AGIs $100k-200k)
Taxable interest for individuals: $314 (reported on 13.4% of returns)
This zip code:
$314
Nevada:
$3,521
(% of AGI for various income ranges: 1.5% for AGIs below $25k, 1.9% for AGIs $25k-50k, 5.4% for AGIs $50k-75k, 10.4% for AGIs $75k-100k, 20.0% for AGIs $100k-200k)
Ordinary dividends: $596 (reported on 6.8% of returns)
Here:
$596
State:
$13,390
(% of AGI for various income ranges: 0.5% for AGIs below $25k, 1.8% for AGIs $25k-50k, 5.0% for AGIs $50k-75k, 3.2% for AGIs $75k-100k, 43.0% for AGIs $100k-200k)
Net capital gain/loss in AGI: +$2,984 (reported on 8.2% of returns)
Here:
+$2,984
State:
+$63,025
(% of AGI for various income ranges: 1.5% for AGIs below $25k, 1.0% for AGIs $25k-50k, 33.9% for AGIs $50k-75k, 52.0% for AGIs $75k-100k, 195.7% for AGIs $100k-200k)
Profit/loss from business: +$2,227 (reported on 14.7% of returns)
Here:
+$2,227
State:
+$11,500
(% of AGI for various income ranges: 2.1% for AGIs below $25k, 141.1% for AGIs $50k-75k, 56.4% for AGIs $75k-100k, 303.9% for AGIs $100k-200k)
Taxable individual retirement arrangement distribution: $15,409 (reported on 2.9% of returns)
89086:
$15,409
Nevada:
$23,628
(% of AGI for various income ranges: 36.0% for AGIs $25k-50k, 118.9% for AGIs $50k-75k, 328.7% for AGIs $100k-200k)
Total itemized deductions: $30,362 (reported on 5.5% of returns)
Here:
$30,362
State:
$44,173
(% of AGI for various income ranges: 106.1% for AGIs $25k-50k, 279.1% for AGIs $50k-75k, 364.4% for AGIs $75k-100k, 707.0% for AGIs $100k-200k)
Charity contributions: $5,700 (reported on 4.5% of returns)
Here:
$5,700
State:
$12,589
(% of AGI for various income ranges: 11.5% for AGIs $25k-50k, 38.7% for AGIs $50k-75k, 78.8% for AGIs $75k-100k, 203.9% for AGIs $100k-200k)
Taxes paid: $5,643 (reported on 5.5% of returns)
89086:
$5,643
State:
$6,112
(% of AGI for various income ranges: 21.8% for AGIs $25k-50k, 47.4% for AGIs $50k-75k, 86.4% for AGIs $75k-100k, 150.9% for AGIs $100k-200k)
Earned income credit: $2,493 (reported on 21.8% of returns)
Here:
$2,493
State:
$2,214
(% of AGI for various income ranges: 115.5% for AGIs below $25k, 86.0% for AGIs $25k-50k)
Percentage of individuals using paid preparers for their 2020 taxes: 95.8%
Here:
96%
State:
93%
(% for various income ranges: 95.6% for AGIs below $25k, 96.9% for AGIs $25k-50k, 95.1% for AGIs $50k-75k, 94.1% for AGIs $75k-100k, 94.4% for AGIs $100k-200k, 100.0% for AGIs over 200k)
Averages for the 2012 tax year for zip code 89086, filed in 2013:
Average Adjusted Gross Income (AGI) in 2012: $39,054 (Individual Income Tax Returns)
Here:
$39,054
State:
$61,164
Salary/wage: $37,205 (reported on 91.4% of returns)
Here:
$37,205
State:
$45,924
(% of AGI for various income ranges: 86.4% for AGIs below $25k, 90.0% for AGIs $25k-50k, 87.2% for AGIs $50k-75k, 88.2% for AGIs $75k-100k, 81.7% for AGIs $100k-200k)
Taxable interest for individuals: $180 (reported on 12.9% of returns)
This zip code:
$180
Nevada:
$3,137
(% of AGI for various income ranges: )
Ordinary dividends: $1,479 (reported on 6.0% of returns)
Here:
$1,479
State:
$11,762
(% of AGI for various income ranges: 0.6% for AGIs $25k-50k, 0.1% for AGIs $50k-75k)
Profit/loss from business: +$6,968 (reported on 10.7% of returns)
Here:
+$6,968
State:
+$12,567
(% of AGI for various income ranges: 6.0% for AGIs below $25k, 1.9% for AGIs $25k-50k, 0.9% for AGIs $50k-75k, 1.5% for AGIs $75k-100k)
Taxable individual retirement arrangement distribution: $11,950 (reported on 2.6% of returns)
89086:
$11,950
Nevada:
$20,808
Total itemized deductions: $18,877 (27% of AGI, reported on 20.2% of returns)
Here:
$18,877
State:
$26,148
Here:
26.7% of AGI
State:
20.0% of AGI
(% of AGI for various income ranges: 3.8% for AGIs below $25k, 7.7% for AGIs $25k-50k, 11.3% for AGIs $50k-75k, 11.8% for AGIs $75k-100k, 14.6% for AGIs $100k-200k)
Charity contributions: $3,038 (reported on 15.9% of returns)
Here:
$3,038
State:
$4,329
(% of AGI for various income ranges: 1.0% for AGIs $25k-50k, 1.5% for AGIs $50k-75k, 1.6% for AGIs $75k-100k, 2.1% for AGIs $100k-200k)
Taxes paid: $3,951 (reported on 20.2% of returns)
89086:
$3,951
State:
$5,116
(% of AGI for various income ranges: 0.6% for AGIs below $25k, 2.0% for AGIs $25k-50k, 2.2% for AGIs $50k-75k, 2.3% for AGIs $75k-100k, 3.1% for AGIs $100k-200k)
Earned income credit: $2,529 (reported on 26.6% of returns)
Here:
$2,529
State:
$2,279
(% of AGI for various income ranges: 7.9% for AGIs below $25k, 1.7% for AGIs $25k-50k)
Percentage of individuals using paid preparers for their 2012 taxes: 48.9%
Here:
49%
State:
55%
(% for various income ranges: 51.6% for AGIs below $25k, 45.5% for AGIs $25k-50k, 48.5% for AGIs $50k-75k, 50.0% for AGIs $75k-100k, 50.0% for AGIs $100k-200k)
Averages for the 2004 tax year for zip code 89086, filed in 2005:
Average Adjusted Gross Income (AGI) in 2004: $46,279 (Individual Income Tax Returns)
Here:
$46,279
State:
$58,367
Salary/wage: $43,359 (reported on 95.6% of returns)
Here:
$43,359
State:
$42,695
(% of AGI for various income ranges: 112.5% for AGIs below $10k, 93.2% for AGIs $10k-25k, 94.3% for AGIs $25k-50k, 93.5% for AGIs $50k-75k, 86.7% for AGIs $75k-100k, 79.5% for AGIs over 100k)
Taxable interest for individuals: $329 (reported on 33.4% of returns)
This zip code:
$329
Nevada:
$3,867
(% of AGI for various income ranges: 0.5% for AGIs $10k-25k, 0.1% for AGIs $25k-50k, 0.1% for AGIs $50k-75k, 0.5% for AGIs $75k-100k, 0.2% for AGIs over 100k)
Taxable dividends: $151 (reported on 11.1% of returns)
Here:
$151
State:
$5,770
(% of AGI for various income ranges: 0.3% for AGIs below $10k, 0.0% for AGIs $25k-50k, 0.0% for AGIs $50k-75k, 0.1% for AGIs $75k-100k, 0.0% for AGIs over 100k)
Net capital gain/loss: +$10,700 (reported on 12.2% of returns)
Here:
+$10,700
State:
+$50,644
(% of AGI for various income ranges: -0.3% for AGIs $25k-50k, -0.1% for AGIs $50k-75k, 4.5% for AGIs $75k-100k, 9.5% for AGIs over 100k)
Profit/loss from business: +$2,200 (reported on 12.2% of returns)
Here:
+$2,200
State:
+$13,618
(% of AGI for various income ranges: 4.5% for AGIs $10k-25k, -0.7% for AGIs $25k-50k, 0.7% for AGIs $50k-75k, 0.9% for AGIs $75k-100k)
Total itemized deductions: $19,044 (30% of AGI, reported on 48.2% of returns)
Here:
$19,044
State:
$22,990
Here:
30.4% of AGI
State:
21.8% of AGI
(% of AGI for various income ranges: 22.7% for AGIs $10k-25k, 19.8% for AGIs $25k-50k, 23.6% for AGIs $50k-75k, 19.2% for AGIs $75k-100k, 15.8% for AGIs over 100k)
Charity contributions deductions: $2,504 (4% of AGI, reported on 38.8% of returns)
Here:
$2,504
State:
$3,443
Here:
3.9% of AGI
State:
3.1% of AGI
(% of AGI for various income ranges: 1.7% for AGIs $10k-25k, 1.8% for AGIs $25k-50k, 2.9% for AGIs $50k-75k, 2.3% for AGIs $75k-100k, 1.6% for AGIs over 100k)
Total tax: $5,164 (reported on 74.7% of returns)
89086:
$5,164
State:
$10,585
(% of AGI for various income ranges: 1.4% for AGIs below $10k, 4.5% for AGIs $10k-25k, 5.4% for AGIs $25k-50k, 7.3% for AGIs $50k-75k, 9.1% for AGIs $75k-100k, 14.0% for AGIs over 100k)
Earned income credit: $1,902 (reported on 18.6% of returns)
Here:
$1,902
State:
$1,676
Percentage of individuals using paid preparers for their 2004 taxes: 58.2%
Here:
58%
State:
60%
(% for various income ranges: 58.3% for AGIs below $10k, 56.4% for AGIs $10k-25k, 57.4% for AGIs $25k-50k, 58.6% for AGIs $50k-75k, 56.9% for AGIs $75k-100k, 66.0% for AGIs over 100k)
Household received Food Stamps/SNAP in the past 12 months: 565 Household did not receive Food Stamps/SNAP in the past 12 months: 2,307
Women who had a birth in the past 12 months: 43 (0 now married, 33 unmarried) Women who did not have a birth in the past 12 months: 2,043 (919 now married, 1,120 unmarried)
Housing units in zip code 89086 with a mortgage: 1,130 Median monthly owner costs for units with a mortgage: $1,887 Median monthly owner costs for units without a mortgage: $416
Residents with income below the poverty level in 2022:
This zip code:
10.8%
Whole state:
12.5%
Residents with income below 50% of the poverty level in 2022:
This zip code:
3.5%
Whole state:
5.9%
Median number of rooms in houses and condos:
Here:
6.0
State:
6.0
Median number of rooms in apartments:
Here:
3.9
State:
4.2
Notable locations in this zip code not listed on our city pages
Size of family households: 1,027 2-persons, 358 3-persons, 322 4-persons, 54 5-persons, 90 6-persons, 48 7-or-more-persons
Size of nonfamily households: 775 1-person, 158 2-persons, 23 3-persons
440 married couples with children.
802 single-parent households (197 men, 605 women).
75.6% of residents of 89086 zip code speak English at home.
15.5% of residents speak Spanish at home (59% very well, 38% well, 3% not well).
0.7% of residents speak other Indo-European language at home (67% very well, 33% well).
7.8% of residents speak Asian or Pacific Island language at home (41% very well, 47% well, 11% not well).
0.3% of residents speak other language at home (100% very well).
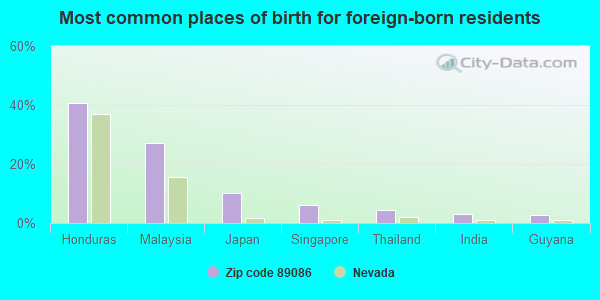
Foreign born population: 1,115 (15.3%) (67.0% of them are naturalized citizens)
This zip code:
15.3%
Whole state:
18.9%
41%Honduras
27%Malaysia
10%Japan
6%Singapore
4%Thailand
3%India
3%Guyana
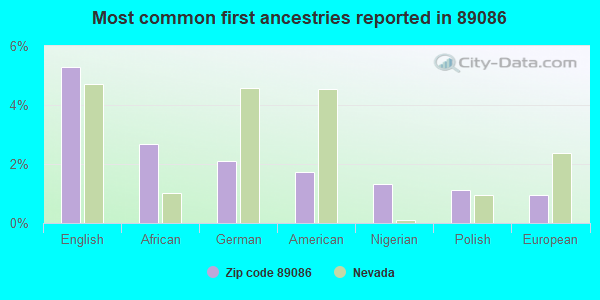
5%English
3%African
2%German
2%American
1%Nigerian
1%Polish
1%European
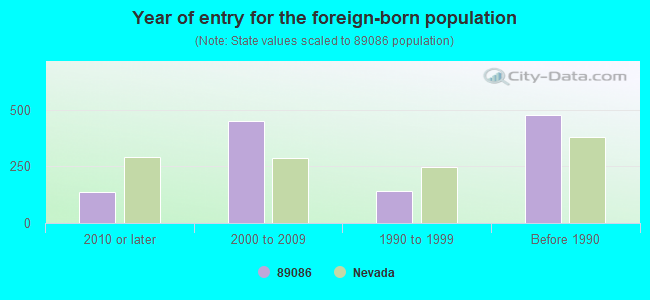
Year of entry for the foreign-born population
1352010 or later
4492000 to 2009
1401990 to 1999
476Before 1990
Housing units lacking complete kitchen facilities: 1.5%
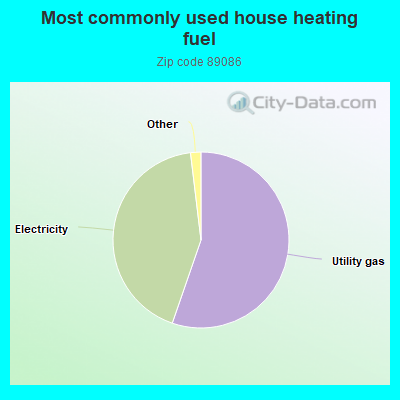
55.3%Utility gas
42.8%Electricity
1.0%Bottled, tank, or LP gas
0.6%Solar energy
Place of birth for U.S.-born residents:
This state: 2,538
Northeast: 194
Midwest: 935
South: 876
West: 1,516
72% of the 89086 zip code residents lived in the same house 1 year ago. Out of people who lived in different houses, 65% moved from this county. Out of people who lived in different houses, 24% moved from different state. Out of people who lived in different houses, 4% moved from abroad.
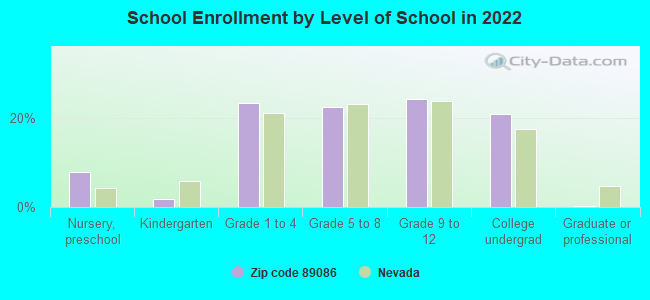
Private vs. public school enrollment:
Students in private schools in grades 1 to 8 (elementary and middle school): 32
Here:
4.0%
Nevada:
12.9%
Students in private schools in grades 9 to 12 (high school): 1
Here:
0.4%
Nevada:
6.9%
Students in private undergraduate colleges: 20
Here:
5.2%
Nevada:
16.0%
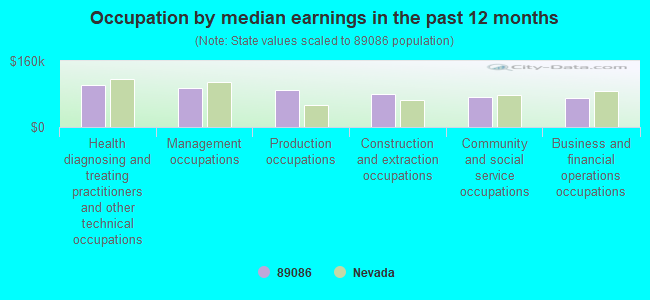
Occupation by median earnings in the past 12 months ($)
101,660Health diagnosing and treating practitioners and other technical occupations
95,580Management occupations
89,501Production occupations
80,970Construction and extraction occupations
73,703Community and social service occupations
69,697Business and financial operations occupations
Top industries in this zip code by the number of employees in 2005:
Information: Internet Publishing and Broadcasting (1-4 employees: 1 establishment)
Fatal accident statistics in 2012:
Fatal accident count: 1
Vehicles involved in fatal accidents: 1
Fatal accidents caused by drunken drivers: 1
Fatalities: 1
Persons involved in fatal accidents: 1
Pedestrians involved in fatal accidents: 0
Fatal accident statistics in 2011:
Fatal accident count: 1
Vehicles involved in fatal accidents: 2
Fatal accidents caused by drunken drivers: 0
Fatalities: 1
Persons involved in fatal accidents: 4
Pedestrians involved in fatal accidents: 0
2004 - 2018 National Fire Incident Reporting System (NFIRS) incidents
According to the data from the years 2004 - 2018 the average number of fires per year is 15. The highest number of fires - 26 took place in 2017, and the least - 9 in 2009. The data has a rising trend.
When looking into fire subcategories, the most incidents belonged to: Outside Fires (36.8%), and Mobile Property/Vehicle Fires (32.9%).
Fire incident types reported to NFIRS in Zip Code 89086


 According to the data from the years 2004 - 2018 the average number of fires per year is 15. The highest number of fires - 26 took place in 2017, and the least - 9 in 2009. The data has a rising trend.
 When looking into fire subcategories, the most incidents belonged to: Outside Fires (36.8%), and Mobile Property/Vehicle Fires (32.9%).