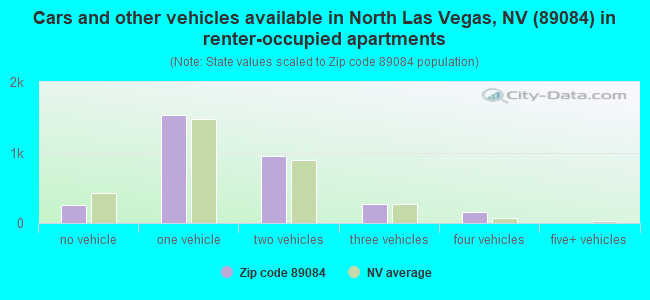
Houses and condos: 12,449 Renter-occupied apartments: 3,165
% of renters here:
27%
State:
40%
March 2022 cost of living index in zip code 89084: 94.5 (less than average, U.S. average is 100)
Land area: 10.9 sq. mi. Water area: 0.0 sq. mi.
Population density: 3,209 people per square mile
(average).
OSM Map
Google Map
MSN Map
OSM Map
General Map
Google Map
MSN Map
OSM Map
Google Map
MSN Map
OSM Map
Google Map
MSN Map
Please wait while loading the map...
Real estate property taxes paid for housing units in 2022:
This zip code:
0.5% ($2,533)
Nevada:
0.4% ($1,889)
Median real estate property taxes paid for housing units with mortgages in 2022: $2,534 (0.5%) Median real estate property taxes paid for housing units with no mortgage in 2022: $2,520 (0.6%)
Estimated median house/condo value in 2022: $483,078
89084:
$483,078
Nevada:
$434,700
According to our research of Nevada and other state lists, there were 55 registered sex offenders living in 89084 zip code as of May 06, 2024. The ratio of all residents to sex offenders in zip code 89084 is 453 to 1. The ratio of registered sex offenders to all residents in this zip code is lower than the state average.
Median resident age:
This zip code:
34.9 years
Nevada median age:
39.0 years
Average household size:
This zip code:
3.0 people
Nevada:
2.6 people
Averages for the 2020 tax year for zip code 89084, filed in 2021:
Average Adjusted Gross Income (AGI) in 2020: $66,690 (Individual Income Tax Returns)
Here:
$66,690
State:
$78,964
Salary/wage: $58,618 (reported on 81.7% of returns)
Here:
$58,618
State:
$54,472
(% of AGI for various income ranges: 1138.6% for AGIs below $25k, 3353.6% for AGIs $25k-50k, 6086.6% for AGIs $50k-75k, 8783.2% for AGIs $75k-100k, 17009.5% for AGIs $100k-200k, 52413.2% for AGIs over 200k)
Taxable interest for individuals: $1,019 (reported on 25.2% of returns)
This zip code:
$1,019
Nevada:
$3,521
(% of AGI for various income ranges: 14.8% for AGIs below $25k, 17.6% for AGIs $25k-50k, 24.4% for AGIs $50k-75k, 48.5% for AGIs $75k-100k, 65.9% for AGIs $100k-200k, 459.5% for AGIs over 200k)
Ordinary dividends: $3,411 (reported on 13.7% of returns)
Here:
$3,411
State:
$13,390
(% of AGI for various income ranges: 12.5% for AGIs below $25k, 18.6% for AGIs $25k-50k, 40.0% for AGIs $50k-75k, 56.4% for AGIs $75k-100k, 112.8% for AGIs $100k-200k, 1730.0% for AGIs over 200k)
Net capital gain/loss in AGI: +$11,109 (reported on 14.5% of returns)
Here:
+$11,109
State:
+$63,025
(% of AGI for various income ranges: 3.4% for AGIs below $25k, 9.6% for AGIs $25k-50k, 45.4% for AGIs $50k-75k, 98.9% for AGIs $75k-100k, 352.1% for AGIs $100k-200k, 9903.2% for AGIs over 200k)
Profit/loss from business: +$5,810 (reported on 14.2% of returns)
Here:
+$5,810
State:
+$11,500
(% of AGI for various income ranges: 58.8% for AGIs below $25k, 33.3% for AGIs $25k-50k, 89.4% for AGIs $50k-75k, 103.0% for AGIs $75k-100k, 199.2% for AGIs $100k-200k, 2145.3% for AGIs over 200k)
Taxable individual retirement arrangement distribution: $19,724 (reported on 7.8% of returns)
89084:
$19,724
Nevada:
$23,628
(% of AGI for various income ranges: 54.6% for AGIs below $25k, 77.4% for AGIs $25k-50k, 181.3% for AGIs $50k-75k, 269.6% for AGIs $75k-100k, 519.3% for AGIs $100k-200k, 2450.0% for AGIs over 200k)
Total itemized deductions: $30,036 (reported on 10.9% of returns)
Here:
$30,036
State:
$44,173
(% of AGI for various income ranges: 58.5% for AGIs below $25k, 191.8% for AGIs $25k-50k, 416.4% for AGIs $50k-75k, 584.9% for AGIs $75k-100k, 1063.6% for AGIs $100k-200k, 5803.2% for AGIs over 200k)
Charity contributions: $6,947 (reported on 8.9% of returns)
Here:
$6,947
State:
$12,589
(% of AGI for various income ranges: 5.2% for AGIs below $25k, 23.6% for AGIs $25k-50k, 66.9% for AGIs $50k-75k, 96.7% for AGIs $75k-100k, 215.2% for AGIs $100k-200k, 1522.6% for AGIs over 200k)
Taxes paid: $5,881 (reported on 10.9% of returns)
89084:
$5,881
State:
$6,112
(% of AGI for various income ranges: 9.2% for AGIs below $25k, 36.0% for AGIs $25k-50k, 92.0% for AGIs $50k-75k, 125.7% for AGIs $75k-100k, 226.5% for AGIs $100k-200k, 788.9% for AGIs over 200k)
Earned income credit: $2,260 (reported on 13.3% of returns)
Here:
$2,260
State:
$2,214
(% of AGI for various income ranges: 85.2% for AGIs below $25k, 61.9% for AGIs $25k-50k, 1.0% for AGIs $50k-75k)
Percentage of individuals using paid preparers for their 2020 taxes: 93.7%
Here:
94%
State:
93%
(% for various income ranges: 93.0% for AGIs below $25k, 94.8% for AGIs $25k-50k, 93.8% for AGIs $50k-75k, 93.3% for AGIs $75k-100k, 93.4% for AGIs $100k-200k, 94.5% for AGIs over 200k)
Averages for the 2012 tax year for zip code 89084, filed in 2013:
Average Adjusted Gross Income (AGI) in 2012: $59,884 (Individual Income Tax Returns)
Here:
$59,884
State:
$61,164
Salary/wage: $53,672 (reported on 83.5% of returns)
Here:
$53,672
State:
$45,924
(% of AGI for various income ranges: 76.0% for AGIs below $25k, 80.0% for AGIs $25k-50k, 75.1% for AGIs $50k-75k, 75.4% for AGIs $75k-100k, 78.6% for AGIs $100k-200k, 55.7% for AGIs over 200k)
Taxable interest for individuals: $987 (reported on 29.5% of returns)
This zip code:
$987
Nevada:
$3,137
(% of AGI for various income ranges: 1.0% for AGIs below $25k, 0.4% for AGIs $25k-50k, 0.5% for AGIs $50k-75k, 0.4% for AGIs $75k-100k, 0.4% for AGIs $100k-200k, 0.7% for AGIs over 200k)
Ordinary dividends: $2,896 (reported on 15.5% of returns)
Here:
$2,896
State:
$11,762
(% of AGI for various income ranges: 1.7% for AGIs below $25k, 0.8% for AGIs $25k-50k, 0.7% for AGIs $50k-75k, 0.5% for AGIs $75k-100k, 0.5% for AGIs $100k-200k, 1.2% for AGIs over 200k)
Net capital gain/loss in AGI: +$3,780 (reported on 14.0% of returns)
Here:
+$3,780
State:
+$33,127
(% of AGI for various income ranges: 0.2% for AGIs $50k-75k, 0.4% for AGIs $75k-100k, 0.6% for AGIs $100k-200k, 5.4% for AGIs over 200k)
Profit/loss from business: +$7,440 (reported on 12.4% of returns)
Here:
+$7,440
State:
+$12,567
(% of AGI for various income ranges: 5.0% for AGIs below $25k, 1.4% for AGIs $25k-50k, 1.2% for AGIs $50k-75k, 0.8% for AGIs $75k-100k, 1.2% for AGIs $100k-200k, 2.3% for AGIs over 200k)
Taxable individual retirement arrangement distribution: $19,697 (reported on 9.4% of returns)
89084:
$19,697
Nevada:
$20,808
(% of AGI for various income ranges: 3.1% for AGIs below $25k, 2.3% for AGIs $25k-50k, 2.7% for AGIs $50k-75k, 3.0% for AGIs $75k-100k, 3.0% for AGIs $100k-200k, 5.0% for AGIs over 200k)
Total itemized deductions: $22,293 (25% of AGI, reported on 38.1% of returns)
Here:
$22,293
State:
$26,148
Here:
24.7% of AGI
State:
20.0% of AGI
(% of AGI for various income ranges: 12.4% for AGIs below $25k, 12.7% for AGIs $25k-50k, 14.5% for AGIs $50k-75k, 14.0% for AGIs $75k-100k, 15.0% for AGIs $100k-200k, 14.8% for AGIs over 200k)
Charity contributions: $3,507 (reported on 31.7% of returns)
Here:
$3,507
State:
$4,329
(% of AGI for various income ranges: 0.9% for AGIs below $25k, 1.3% for AGIs $25k-50k, 1.7% for AGIs $50k-75k, 1.6% for AGIs $75k-100k, 2.1% for AGIs $100k-200k, 3.0% for AGIs over 200k)
Taxes paid: $4,470 (reported on 37.6% of returns)
89084:
$4,470
State:
$5,116
(% of AGI for various income ranges: 2.1% for AGIs below $25k, 2.4% for AGIs $25k-50k, 3.0% for AGIs $50k-75k, 2.8% for AGIs $75k-100k, 3.1% for AGIs $100k-200k, 2.7% for AGIs over 200k)
Earned income credit: $2,193 (reported on 14.0% of returns)
Here:
$2,193
State:
$2,279
(% of AGI for various income ranges: 5.4% for AGIs below $25k, 1.1% for AGIs $25k-50k)
Percentage of individuals using paid preparers for their 2012 taxes: 48.4%
Here:
48%
State:
55%
(% for various income ranges: 45.1% for AGIs below $25k, 45.9% for AGIs $25k-50k, 49.5% for AGIs $50k-75k, 48.5% for AGIs $75k-100k, 55.7% for AGIs $100k-200k, 68.2% for AGIs over 200k)
Averages for the 2004 tax year for zip code 89084, filed in 2005:
Average Adjusted Gross Income (AGI) in 2004: $55,801 (Individual Income Tax Returns)
Here:
$55,801
State:
$58,367
Salary/wage: $49,475 (reported on 88.9% of returns)
Here:
$49,475
State:
$42,695
(% of AGI for various income ranges: 146.2% for AGIs below $10k, 82.1% for AGIs $10k-25k, 84.6% for AGIs $25k-50k, 83.7% for AGIs $50k-75k, 84.7% for AGIs $75k-100k, 68.2% for AGIs over 100k)
Taxable interest for individuals: $1,284 (reported on 43.1% of returns)
This zip code:
$1,284
Nevada:
$3,867
(% of AGI for various income ranges: 6.0% for AGIs below $10k, 1.5% for AGIs $10k-25k, 1.2% for AGIs $25k-50k, 0.5% for AGIs $50k-75k, 0.7% for AGIs $75k-100k, 1.2% for AGIs over 100k)
Taxable dividends: $1,542 (reported on 19.1% of returns)
Here:
$1,542
State:
$5,770
(% of AGI for various income ranges: 2.7% for AGIs below $10k, 0.9% for AGIs $10k-25k, 0.5% for AGIs $25k-50k, 0.4% for AGIs $50k-75k, 0.4% for AGIs $75k-100k, 0.6% for AGIs over 100k)
Net capital gain/loss: +$18,253 (reported on 17.4% of returns)
Here:
+$18,253
State:
+$50,644
(% of AGI for various income ranges: 5.5% for AGIs below $10k, -0.8% for AGIs $10k-25k, 0.3% for AGIs $25k-50k, 1.5% for AGIs $50k-75k, 1.9% for AGIs $75k-100k, 14.1% for AGIs over 100k)
Profit/loss from business: +$8,207 (reported on 15.2% of returns)
Here:
+$8,207
State:
+$13,618
(% of AGI for various income ranges: 8.6% for AGIs below $10k, 3.5% for AGIs $10k-25k, 2.2% for AGIs $25k-50k, 2.4% for AGIs $50k-75k, 1.7% for AGIs $75k-100k, 2.1% for AGIs over 100k)
IRA payment deduction: $3,242 (reported on 2.2% of returns)
89084:
$3,242
Nevada:
$3,054
(% of AGI for various income ranges: 0.2% for AGIs $10k-25k, 0.3% for AGIs $25k-50k, 0.1% for AGIs $50k-75k, 0.2% for AGIs $75k-100k)
Self-employed pension: $8,400 (reported on 0.2% of returns)
Here:
$8,400
Nevada:
$16,706
Total itemized deductions: $20,889 (28% of AGI, reported on 55.1% of returns)
Here:
$20,889
State:
$22,990
Here:
28.1% of AGI
State:
21.8% of AGI
(% of AGI for various income ranges: 51.1% for AGIs below $10k, 19.5% for AGIs $10k-25k, 22.7% for AGIs $25k-50k, 23.1% for AGIs $50k-75k, 21.2% for AGIs $75k-100k, 17.4% for AGIs over 100k)
Charity contributions deductions: $2,661 (3% of AGI, reported on 48.3% of returns)
Here:
$2,661
State:
$3,443
Here:
3.5% of AGI
State:
3.1% of AGI
(% of AGI for various income ranges: 2.8% for AGIs below $10k, 1.5% for AGIs $10k-25k, 2.0% for AGIs $25k-50k, 2.6% for AGIs $50k-75k, 2.4% for AGIs $75k-100k, 2.3% for AGIs over 100k)
Total tax: $7,100 (reported on 80.0% of returns)
89084:
$7,100
State:
$10,585
(% of AGI for various income ranges: 4.3% for AGIs below $10k, 4.0% for AGIs $10k-25k, 6.1% for AGIs $25k-50k, 8.0% for AGIs $50k-75k, 9.6% for AGIs $75k-100k, 15.0% for AGIs over 100k)
Earned income credit: $1,588 (reported on 11.0% of returns)
Here:
$1,588
State:
$1,676
Percentage of individuals using paid preparers for their 2004 taxes: 55.2%
Here:
55%
State:
60%
(% for various income ranges: 48.4% for AGIs below $10k, 55.1% for AGIs $10k-25k, 53.4% for AGIs $25k-50k, 54.8% for AGIs $50k-75k, 56.8% for AGIs $75k-100k, 64.4% for AGIs over 100k)
Likely homosexual households (counted as self-reported same-sex unmarried-partner households)
Lesbian couples: 0.1% of all households
Gay men: 0.1% of all households
Household received Food Stamps/SNAP in the past 12 months: 975 Household did not receive Food Stamps/SNAP in the past 12 months: 10,583
Women who had a birth in the past 12 months: 532 (318 now married, 197 unmarried) Women who did not have a birth in the past 12 months: 8,239 (3,834 now married, 4,385 unmarried)
Housing units in zip code 89084 with a mortgage: 6,573 (231 second mortgage, 36 home equity loan, 131 both second mortgage and home equity loan) Houses without a mortgage: 28
Median monthly owner costs for units with a mortgage: $1,874 Median monthly owner costs for units without a mortgage: $468
Residents with income below the poverty level in 2022:
This zip code:
7.0%
Whole state:
12.5%
Residents with income below 50% of the poverty level in 2022:
This zip code:
2.6%
Whole state:
5.9%
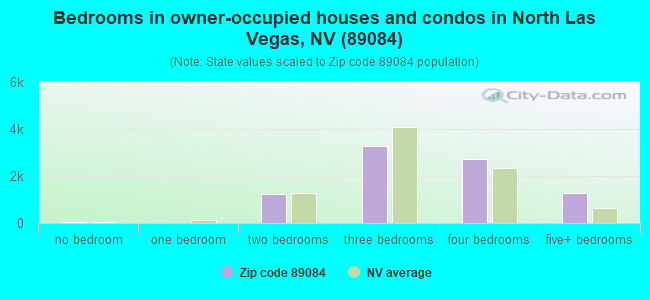
Median number of rooms in houses and condos:
Here:
6.2
State:
6.0
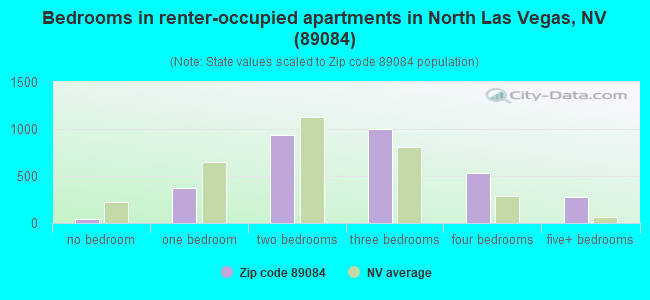
Median number of rooms in apartments:
Here:
5.3
State:
4.2
Notable locations in this zip code not listed on our city pages
5,434 married couples with children.
2,419 single-parent households (787 men, 1,632 women).
77.3% of residents of 89084 zip code speak English at home.
12.3% of residents speak Spanish at home (80% very well, 12% well, 4% not well, 3% not at all).
1.6% of residents speak other Indo-European language at home (75% very well, 21% well, 4% not well).
8.9% of residents speak Asian or Pacific Island language at home (77% very well, 20% well, 3% not well).
0.2% of residents speak other language at home (66% very well, 34% not well).
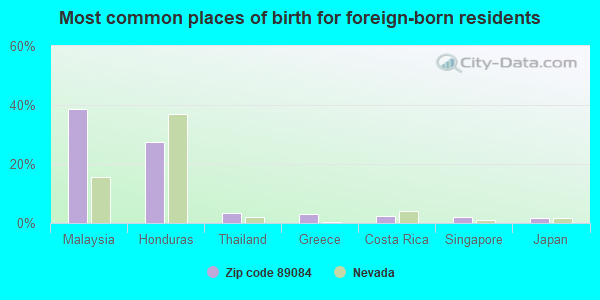
Foreign born population: 4,759 (13.6%) (67.2% of them are naturalized citizens)
This zip code:
13.6%
Whole state:
18.9%
39%Malaysia
28%Honduras
4%Thailand
3%Greece
2%Costa Rica
2%Singapore
2%Japan
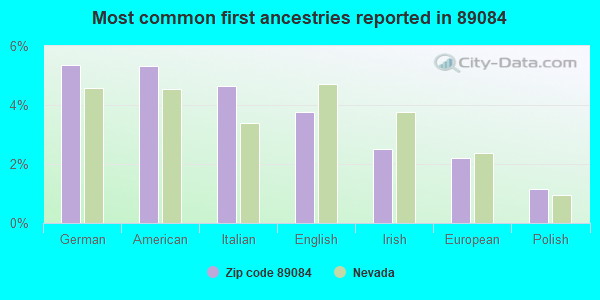
5%German
5%American
5%Italian
4%English
3%Irish
2%European
1%Polish
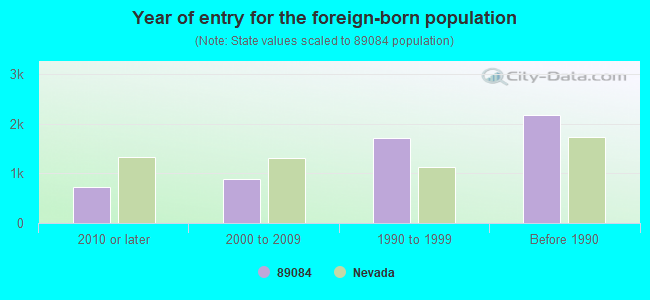
Year of entry for the foreign-born population
7262010 or later
8792000 to 2009
1,7011990 to 1999
2,173Before 1990
Housing units lacking complete plumbing facilities: 0.2% Housing units lacking complete kitchen facilities: 0.6%
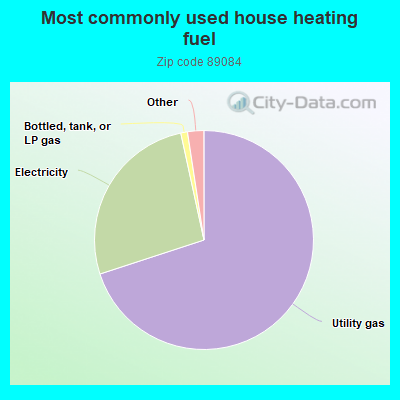
69.9%Utility gas
26.6%Electricity
1.0%Bottled, tank, or LP gas
0.8%Solar energy
0.7%Wood
0.6%Fuel oil, kerosene, etc.
Place of birth for U.S.-born residents:
This state: 9,383
Northeast: 2,299
Midwest: 4,926
South: 4,223
West: 8,513
86% of the 89084 zip code residents lived in the same house 1 year ago. Out of people who lived in different houses, 67% moved from this county. Out of people who lived in different houses, 2% moved from different county within same state. Out of people who lived in different houses, 28% moved from different state. Out of people who lived in different houses, 2% moved from abroad.
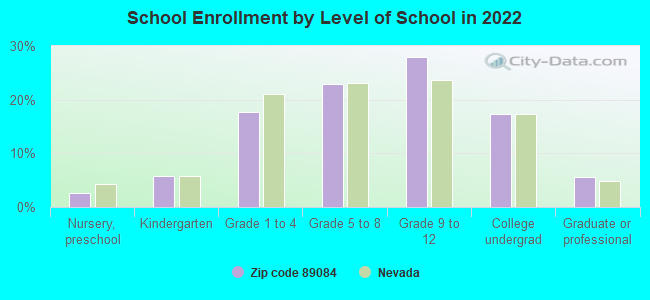
Private vs. public school enrollment:
Students in private schools in grades 1 to 8 (elementary and middle school): 570
Here:
15.3%
Nevada:
12.9%
Students in private schools in grades 9 to 12 (high school): 97
Here:
3.8%
Nevada:
6.9%
Students in private undergraduate colleges: 462
Here:
29.8%
Nevada:
16.0%
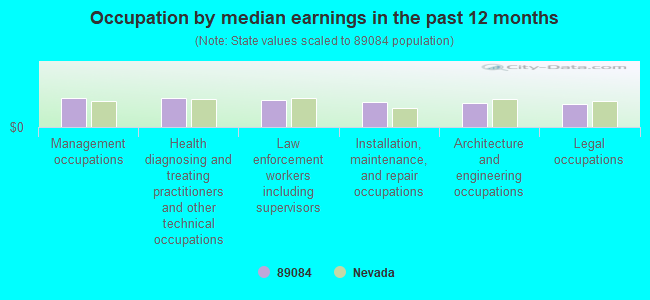
Occupation by median earnings in the past 12 months ($)
85,889Management occupations
85,737Health diagnosing and treating practitioners and other technical occupations
79,544Law enforcement workers including supervisors
72,698Installation, maintenance, and repair occupations
71,181Architecture and engineering occupations
69,349Legal occupations
Top industries in this zip code by the number of employees in 2005:
Construction: Other Building Equipment Contractors (10-19 employees: 1 establishment)
Real Estate and Rental and Leasing: Offices of Real Estate Agents and Brokers (1-4: 5)
Construction: All Other Specialty Trade Contractors (5-9: 1)
Accommodation and Food Services: Snack and Nonalcoholic Beverage Bars (5-9: 1)
Accommodation and Food Services: Full-Service Restaurants (5-9: 1)
Other Services (except Public Administration): Appliance Repair and Maintenance (5-9: 1)
Real Estate and Rental and Leasing: Other Activities Related to Real Estate (1-4: 2)
Professional, Scientific, and Technical Services: Other Scientific and Technical Consulting Services (1-4: 2)
Other Services (except Public Administration): Religious Organizations (1-4: 2)
Finance and Insurance: Mortgage and Nonmortgage Loan Brokers (1-4: 2)
Fatal accident statistics in 2014:
Fatal accident count: 2
Vehicles involved in fatal accidents: 4
Fatal accidents caused by drunken drivers: 1
Fatalities: 4
Persons involved in fatal accidents: 6
Pedestrians involved in fatal accidents: 0
Fatal accident statistics in 2013:
Fatal accident count: 1
Vehicles involved in fatal accidents: 1
Fatal accidents caused by drunken drivers: 1
Fatalities: 1
Persons involved in fatal accidents: 2
Pedestrians involved in fatal accidents: 2
2004 - 2018 National Fire Incident Reporting System (NFIRS) incidents
According to the data from the years 2004 - 2018 the average number of fires per year is 27. The highest number of fires - 55 took place in 2011, and the least - 9 in 2006. The data has a rising trend.
When looking into fire subcategories, the most incidents belonged to: Outside Fires (41.6%), and Structure Fires (35.6%).
Fire incident types reported to NFIRS in Zip Code 89084


 According to the data from the years 2004 - 2018 the average number of fires per year is 27. The highest number of fires - 55 took place in 2011, and the least - 9 in 2006. The data has a rising trend.
 When looking into fire subcategories, the most incidents belonged to: Outside Fires (41.6%), and Structure Fires (35.6%).