Races in Dallas, Texas (TX) Detailed Stats
Data:
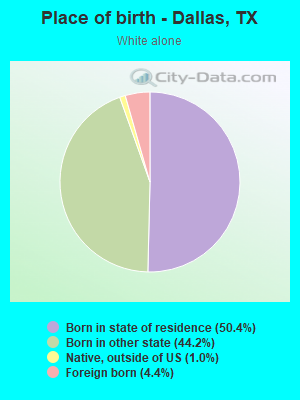
Races - White alone (%)
Races - White alone (% change since 2000)
Races - Black alone (%)
Races - Black alone (% change since 2000)
Races - American Indian alone (%)
Races - American Indian alone (% change since 2000)
Races - Asian alone (%)
Races - Asian alone (% change since 2000)
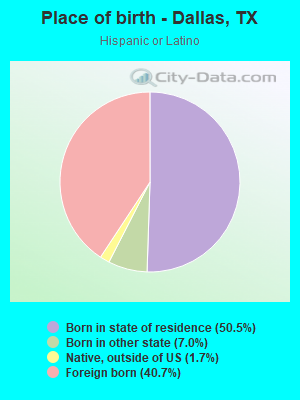
Races - Hispanic (%)
Races - Hispanic (% change since 2000)
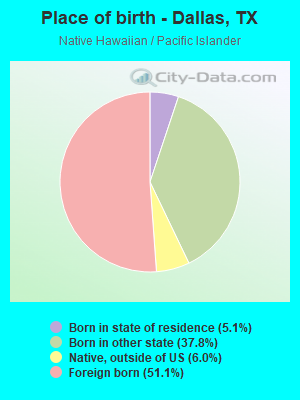
Races - Native Hawaiian and Other Pacific Islander alone (%)
Races - Native Hawaiian and Other Pacific Islander alone (% change since 2000)
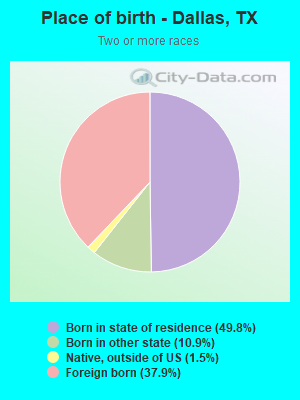
Races - Two or more races(%)
Races - Two or more races(% change since 2000)
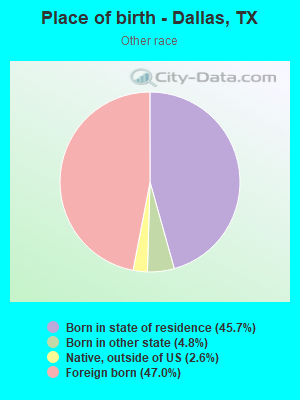
Races - Other race alone (%)
Races - Other race alone (% change since 2000)
Racial diversity
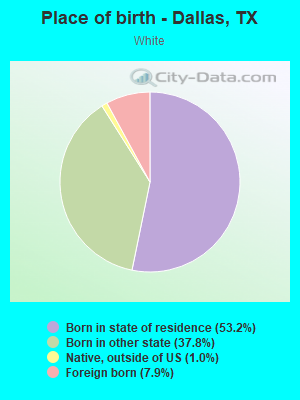
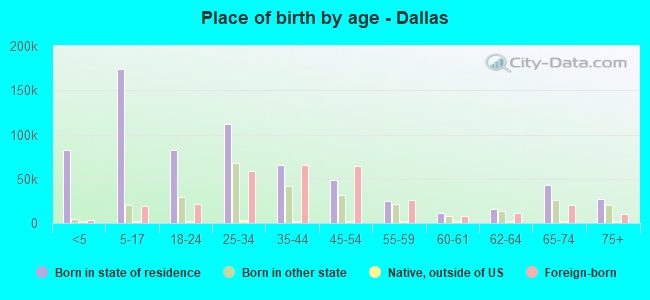
Place of birth - Born in state of residence (%)
Place of birth - Born in state of residence (%) - White
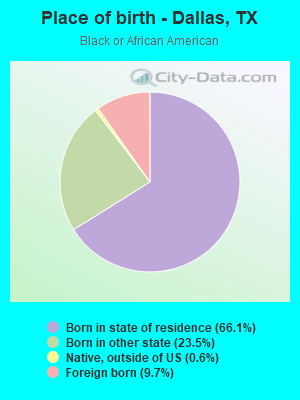
Place of birth - Born in state of residence (%) - Black or African American
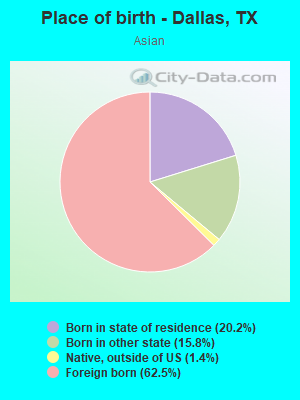
Place of birth - Born in state of residence (%) - Asian
Place of birth - Born in state of residence (%) - Hispanic or Latino
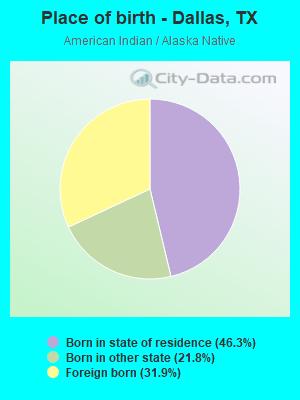
Place of birth - Born in state of residence (%) - American Indian and Alaska Native
Place of birth - Born in state of residence (%) - Multirace
Place of birth - Born in state of residence (%) - Other Race
Place of birth - Born in other state (%)
Place of birth - Born in other state (%) - White
Place of birth - Born in other state (%) - Black or African American
Place of birth - Born in other state (%) - Asian
Place of birth - Born in other state (%) - Hispanic or Latino
Place of birth - Born in other state (%) - American Indian and Alaska Native
Place of birth - Born in other state (%) - Multirace
Place of birth - Born in other state (%) - Other Race
Place of birth - Native, outside of US (%)
Place of birth - Native, outside of US (%) - White
Place of birth - Native, outside of US (%) - Black or African American
Place of birth - Native, outside of US (%) - Asian
Place of birth - Native, outside of US (%) - Hispanic or Latino
Place of birth - Native, outside of US (%) - American Indian and Alaska Native
Place of birth - Native, outside of US (%) - Multirace
Place of birth - Native, outside of US (%) - Other Race
Place of birth - Foreign born (%)
Place of birth - Foreign born (%) - White
Place of birth - Foreign born (%) - Black or African American
Place of birth - Foreign born (%) - Asian
Place of birth - Foreign born (%) - Hispanic or Latino
Place of birth - Foreign born (%) - American Indian and Alaska Native
Place of birth - Foreign born (%) - Multirace
Place of birth - Foreign born (%) - Other Race
Residents speaking English at home (%)
Residents speaking English at home - Born in the United States (%)
Residents speaking English at home - Native, born elsewhere (%)
Residents speaking English at home - Foreign born (%)
Residents speaking Spanish at home (%)
Residents speaking Spanish at home - Born in the United States (%)
Residents speaking Spanish at home - Native, born elsewhere (%)
Residents speaking Spanish at home - Foreign born (%)
Residents speaking other language at home (%)
Residents speaking other language at home - Born in the United States (%)
Residents speaking other language at home - Native, born elsewhere (%)
Residents speaking other language at home - Foreign born (%)
Marital status - Never married (%)
Marital status - Now married (%)
Marital status - Separated (%)
Marital status - Widowed (%)
Marital status - Divorced (%)
Ancestries Reported - Arab (%)
Ancestries Reported - Czech (%)
Ancestries Reported - Danish (%)
Ancestries Reported - Dutch (%)
Ancestries Reported - English (%)
Ancestries Reported - French (%)
Ancestries Reported - French Canadian (%)
Ancestries Reported - German (%)
Ancestries Reported - Greek (%)
Ancestries Reported - Hungarian (%)
Ancestries Reported - Irish (%)
Ancestries Reported - Italian (%)
Ancestries Reported - Lithuanian (%)
Ancestries Reported - Norwegian (%)
Ancestries Reported - Polish (%)
Ancestries Reported - Portuguese (%)
Ancestries Reported - Russian (%)
Ancestries Reported - Scotch-Irish (%)
Ancestries Reported - Scottish (%)
Ancestries Reported - Slovak (%)
Ancestries Reported - Subsaharan African (%)
Ancestries Reported - Swedish (%)
Ancestries Reported - Swiss (%)
Ancestries Reported - Ukrainian (%)
Ancestries Reported - United States (%)
Ancestries Reported - Welsh (%)
Ancestries Reported - West Indian (%)
Ancestries Reported - Other (%)
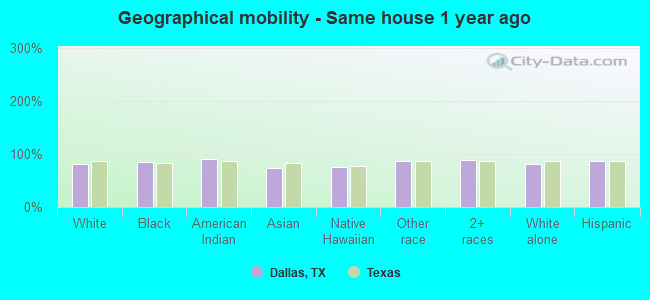
Geographical mobility - Same house 1 year ago (%)
Geographical mobility - Same house 1 year ago (%) - White
Geographical mobility - Same house 1 year ago (%) - Black or African American
Geographical mobility - Same house 1 year ago (%) - Asian
Geographical mobility - Same house 1 year ago (%) - Hispanic or Latino
Geographical mobility - Same house 1 year ago (%) - American Indian and Alaska Native
Geographical mobility - Same house 1 year ago (%) - Multirace
Geographical mobility - Same house 1 year ago (%) - Other Race
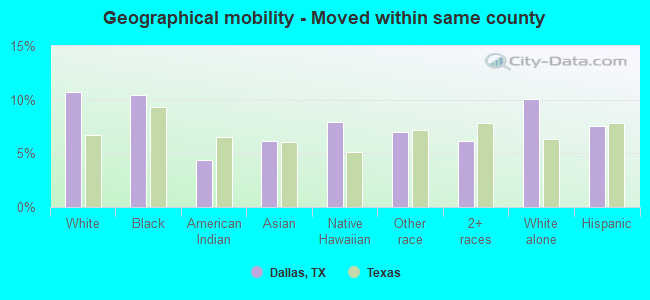
Geographical mobility - Moved within same county (%)
Geographical mobility - Moved within same county (%) - White
Geographical mobility - Moved within same county (%) - Black or African American
Geographical mobility - Moved within same county (%) - Asian
Geographical mobility - Moved within same county (%) - Hispanic or Latino
Geographical mobility - Moved within same county (%) - American Indian and Alaska Native
Geographical mobility - Moved within same county (%) - Multirace
Geographical mobility - Moved within same county (%) - Other Race
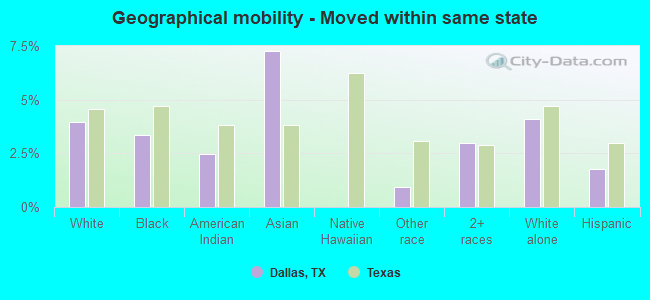
Geographical mobility - Moved from different county within same state (%)
Geographical mobility - Moved from different county within same state (%) - White
Geographical mobility - Moved from different county within same state (%) - Black or African American
Geographical mobility - Moved from different county within same state (%) - Asian
Geographical mobility - Moved from different county within same state (%) - Hispanic or Latino
Geographical mobility - Moved from different county within same state (%) - American Indian and Alaska Native
Geographical mobility - Moved from different county within same state (%) - Multirace
Geographical mobility - Moved from different county within same state (%) - Other Race
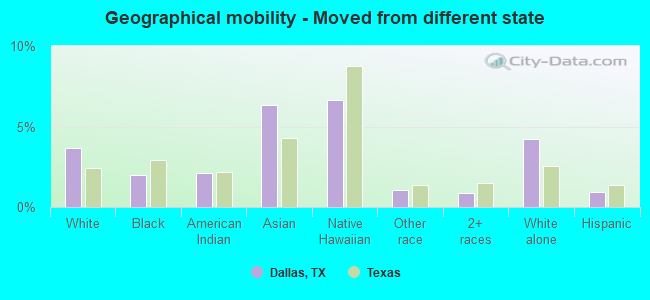
Geographical mobility - Moved from different state (%)
Geographical mobility - Moved from different state (%) - White
Geographical mobility - Moved from different state (%) - Black or African American
Geographical mobility - Moved from different state (%) - Asian
Geographical mobility - Moved from different state (%) - Hispanic or Latino
Geographical mobility - Moved from different state (%) - American Indian and Alaska Native
Geographical mobility - Moved from different state (%) - Multirace
Geographical mobility - Moved from different state (%) - Other Race
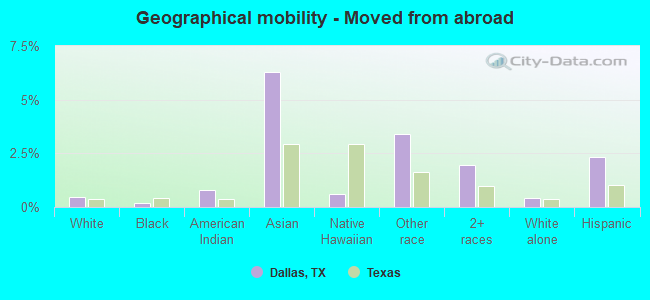
Geographical mobility - Moved from abroad (%)
Geographical mobility - Moved from abroad (%) - White
Geographical mobility - Moved from abroad (%) - Black or African American
Geographical mobility - Moved from abroad (%) - Asian
Geographical mobility - Moved from abroad (%) - Hispanic or Latino
Geographical mobility - Moved from abroad (%) - American Indian and Alaska Native
Geographical mobility - Moved from abroad (%) - Multirace
Geographical mobility - Moved from abroad (%) - Other Race
Place of birth for the foreign-born population - Ireland (%)
Place of birth for the foreign-born population - Denmark (%)
Place of birth for the foreign-born population - Norway (%)
Place of birth for the foreign-born population - Sweden (%)
Place of birth for the foreign-born population - United Kingdom (%)
Place of birth for the foreign-born population - England (%)
Place of birth for the foreign-born population - Scotland (%)
Place of birth for the foreign-born population - Other Northern Europe (%)
Place of birth for the foreign-born population - Austria (%)
Place of birth for the foreign-born population - Belgium (%)
Place of birth for the foreign-born population - France (%)
Place of birth for the foreign-born population - Germany (%)
Place of birth for the foreign-born population - Netherlands (%)
Place of birth for the foreign-born population - Switzerland (%)
Place of birth for the foreign-born population - Other Western Europe (%)
Place of birth for the foreign-born population - Greece (%)
Place of birth for the foreign-born population - Italy (%)
Place of birth for the foreign-born population - Portugal (%)
Place of birth for the foreign-born population - Spain (%)
Place of birth for the foreign-born population - Other Southern Europe (%)
Place of birth for the foreign-born population - Albania (%)
Place of birth for the foreign-born population - Belarus (%)
Place of birth for the foreign-born population - Bosnia and Herzegovina (%)
Place of birth for the foreign-born population - Bulgaria (%)
Place of birth for the foreign-born population - Croatia (%)
Place of birth for the foreign-born population - Czechoslovakia (%)
Place of birth for the foreign-born population - Hungary (%)
Place of birth for the foreign-born population - Latvia (%)
Place of birth for the foreign-born population - Lithuania (%)
Place of birth for the foreign-born population - North Macedonia (Macedonia) (%)
Place of birth for the foreign-born population - Moldova (%)
Place of birth for the foreign-born population - Poland (%)
Place of birth for the foreign-born population - Romania (%)
Place of birth for the foreign-born population - Russia (%)
Place of birth for the foreign-born population - Serbia (%)
Place of birth for the foreign-born population - Ukraine (%)
Place of birth for the foreign-born population - Other Eastern Europe (%)
Place of birth for the foreign-born population - China (%)
Place of birth for the foreign-born population - Hong Kong (%)
Place of birth for the foreign-born population - Taiwan (%)
Place of birth for the foreign-born population - Japan (%)
Place of birth for the foreign-born population - Korea (%)
Place of birth for the foreign-born population - Other Eastern Asia (%)
Place of birth for the foreign-born population - Afghanistan (%)
Place of birth for the foreign-born population - Bangladesh (%)
Place of birth for the foreign-born population - India (%)
Place of birth for the foreign-born population - Iran (%)
Place of birth for the foreign-born population - Kazakhstan (%)
Place of birth for the foreign-born population - Nepal (%)
Place of birth for the foreign-born population - Pakistan (%)
Place of birth for the foreign-born population - Sri Lanka (%)
Place of birth for the foreign-born population - Uzbekistan (%)
Place of birth for the foreign-born population - Other South Central Asia (%)
Place of birth for the foreign-born population - Burma (%)
Place of birth for the foreign-born population - Cambodia (%)
Place of birth for the foreign-born population - Indonesia (%)
Place of birth for the foreign-born population - Laos (%)
Place of birth for the foreign-born population - Malaysia (%)
Place of birth for the foreign-born population - Philippines (%)
Place of birth for the foreign-born population - Singapore (%)
Place of birth for the foreign-born population - Thailand (%)
Place of birth for the foreign-born population - Vietnam (%)
Place of birth for the foreign-born population - Other South Eastern Asia (%)
Place of birth for the foreign-born population - Armenia (%)
Place of birth for the foreign-born population - Iraq (%)
Place of birth for the foreign-born population - Israel (%)
Place of birth for the foreign-born population - Jordan (%)
Place of birth for the foreign-born population - Kuwait (%)
Place of birth for the foreign-born population - Lebanon (%)
Place of birth for the foreign-born population - Saudi Arabia (%)
Place of birth for the foreign-born population - Syria (%)
Place of birth for the foreign-born population - Turkey (%)
Place of birth for the foreign-born population - Yemen (%)
Place of birth for the foreign-born population - Other Western Asia (%)
Place of birth for the foreign-born population - Eritrea (%)
Place of birth for the foreign-born population - Ethiopia (%)
Place of birth for the foreign-born population - Kenya (%)
Place of birth for the foreign-born population - Somalia (%)
Place of birth for the foreign-born population - Uganda (%)
Place of birth for the foreign-born population - Zimbabwe (%)
Place of birth for the foreign-born population - Other Eastern Africa (%)
Place of birth for the foreign-born population - Cameroon (%)
Place of birth for the foreign-born population - Congo (%)
Place of birth for the foreign-born population - Democratic Republic of Congo (Zaire) (%)
Place of birth for the foreign-born population - Other Middle Africa (%)
Place of birth for the foreign-born population - Egypt (%)
Place of birth for the foreign-born population - Morocco (%)
Place of birth for the foreign-born population - Sudan (%)
Place of birth for the foreign-born population - Other Northern Africa (%)
Place of birth for the foreign-born population - South Africa (%)
Place of birth for the foreign-born population - Other Southern Africa (%)
Place of birth for the foreign-born population - Cabo Verde (%)
Place of birth for the foreign-born population - Ghana (%)
Place of birth for the foreign-born population - Liberia (%)
Place of birth for the foreign-born population - Nigeria (%)
Place of birth for the foreign-born population - Senegal (%)
Place of birth for the foreign-born population - Sierra Leone (%)
Place of birth for the foreign-born population - Other Western Africa (%)
Place of birth for the foreign-born population - Australia (%)
Place of birth for the foreign-born population - New Zealand (%)
Place of birth for the foreign-born population - Fiji (%)
Place of birth for the foreign-born population - Micronesia (%)
Place of birth for the foreign-born population - Bahamas (%)
Place of birth for the foreign-born population - Barbados (%)
Place of birth for the foreign-born population - Cuba (%)
Place of birth for the foreign-born population - Dominica (%)
Place of birth for the foreign-born population - Dominican Republic (%)
Place of birth for the foreign-born population - Grenada (%)
Place of birth for the foreign-born population - Haiti (%)
Place of birth for the foreign-born population - Jamaica (%)
Place of birth for the foreign-born population - St. Vincent and the Grenadines (%)
Place of birth for the foreign-born population - Trinidad and Tobago (%)
Place of birth for the foreign-born population - West Indies (%)
Place of birth for the foreign-born population - Other Caribbean (%)
Place of birth for the foreign-born population - Belize (%)
Place of birth for the foreign-born population - Costa Rica (%)
Place of birth for the foreign-born population - El Salvador (%)
Place of birth for the foreign-born population - Guatemala (%)
Place of birth for the foreign-born population - Honduras (%)
Place of birth for the foreign-born population - Mexico (%)
Place of birth for the foreign-born population - Nicaragua (%)
Place of birth for the foreign-born population - Panama (%)
Place of birth for the foreign-born population - Other Central America (%)
Place of birth for the foreign-born population - Argentina (%)
Place of birth for the foreign-born population - Bolivia (%)
Place of birth for the foreign-born population - Brazil (%)
Place of birth for the foreign-born population - Chile (%)
Place of birth for the foreign-born population - Colombia (%)
Place of birth for the foreign-born population - Ecuador (%)
Place of birth for the foreign-born population - Guyana (%)
Place of birth for the foreign-born population - Peru (%)
Place of birth for the foreign-born population - Uruguay (%)
Place of birth for the foreign-born population - Venezuela (%)
Place of birth for the foreign-born population - Other South America (%)
Place of birth for the foreign-born population - Canada (%)
Place of birth for the foreign-born population - Other Northern America (%)
Place of birth for the foreign-born population - Other (%)
Latest news about races in Dallas, TX collected exclusively by city-data.com from local newspapers, TV, and radio stations
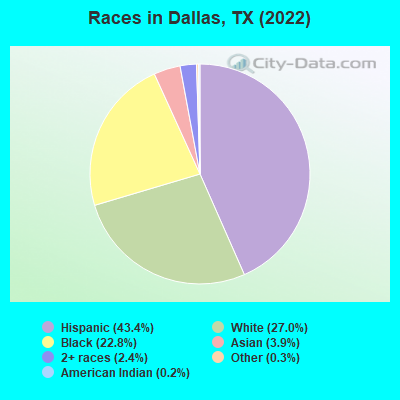
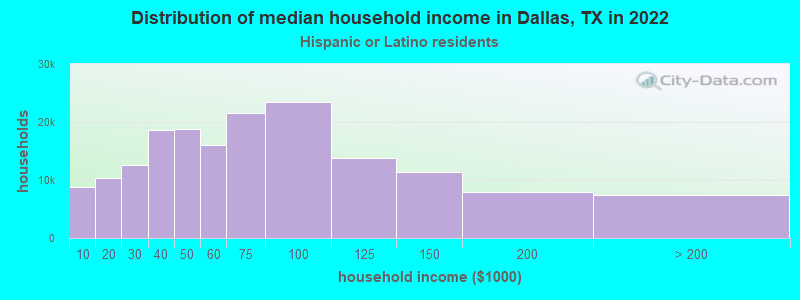
According to 2022 data, the most numerous races in Dallas, TX are Hispanic (564,453 residents), White alone (351,044 residents), and Black alone (296,839 residents). 57.4% of Dallas residents speak English at home. 24.7% of Dallas, TX residents are foreign-born (17.9% born in Latin America, 2.8% born in Asia), which is 31.1% greater than the foreign-born rate of 17.0% across the entire state of Texas.
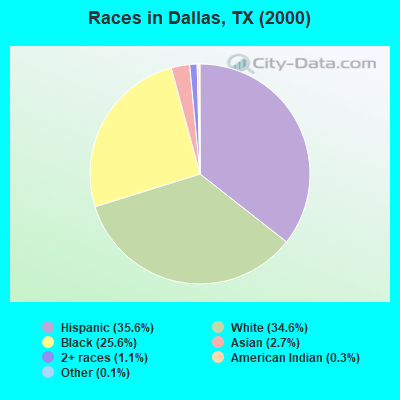
Race distribution in Dallas
2000 2022
422,587 35.6% Hispanic 410,777 34.6% White alone 304,824 25.6% Black alone 31,626 2.7% Asian alone 13,440 1.1% Two or more races 3,705 0.3% American Indian alone 1,254 0.1% Other race alone 367 0.03% Native Hawaiian and Other
564,453 43.4% Hispanic 351,044 27.0% White alone 296,839 22.8% Black alone 50,045 3.9% Asian alone 31,222 2.4% Two or more races 3,346 0.3% Other race alone 2,202 0.2% American Indian alone 402 0.03% Native Hawaiian and Other
2000 2022
10,933,313 52.4% White alone 6,669,666 32.0% Hispanic 2,364,255 11.3% Black alone 554,445 2.7% Asian alone 230,567 1.1% Two or more races 68,859 0.3% American Indian alone 19,958 0.10% Other race alone 10,757 0.05% Native Hawaiian and Other
12,070,642 40.2% Hispanic 11,683,430 38.9% White alone 3,508,706 11.7% Black alone 1,608,173 5.4% Asian alone 956,560 3.2% Two or more races 125,763 0.4% Other race alone 47,023 0.2% American Indian alone 29,275 0.10% Native Hawaiian and Other
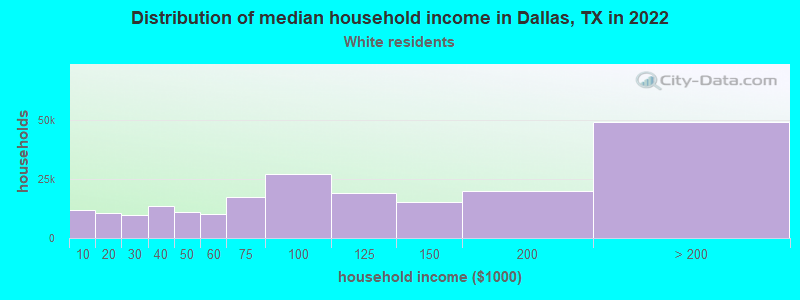
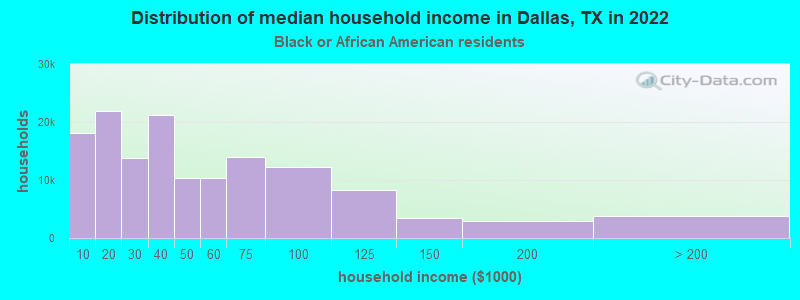
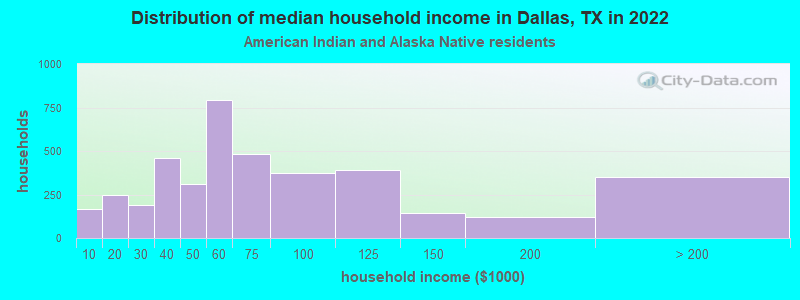
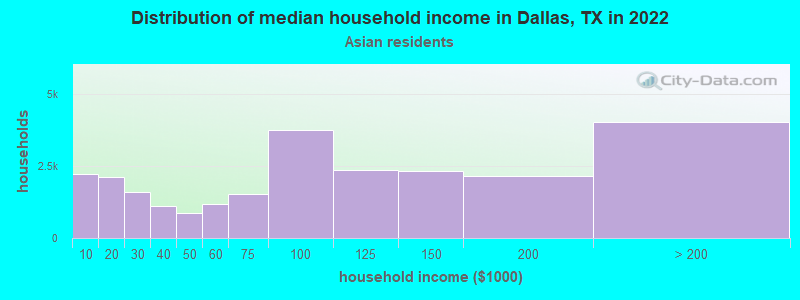
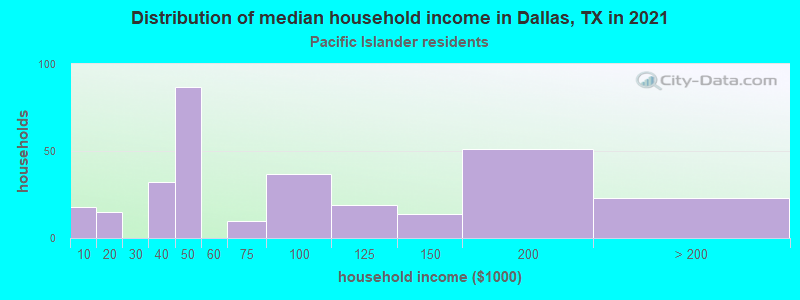
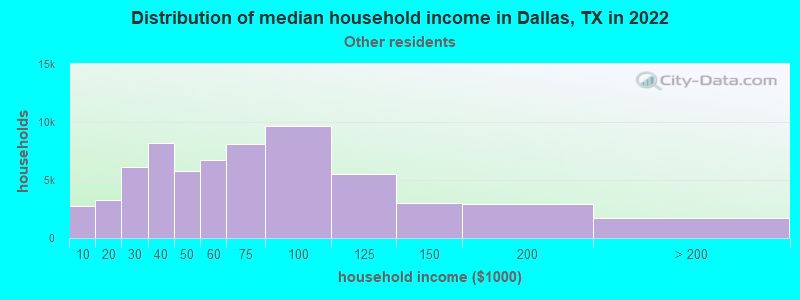
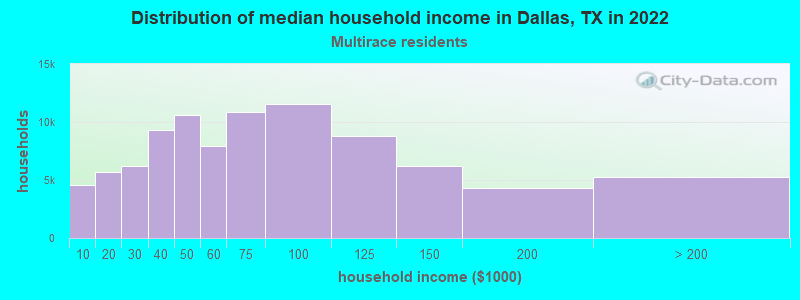
Income and house value in Dallas Median household income in 2022 $102,932 White non-Hispanic householders$36,336 Black householders$63,742 American Indian and Alaska Native householders$86,169 Asian householders$58,890 Some other race householders$62,560 Two or more races householders$60,198 Hispanic or Latino race householdersMedian 2022 house value $547,319 White Non-Hispanic householders$220,320 Black or African American householders$286,673 American Indian or Alaska Native householders $436,609 Asian householders$319,300 Native Hawaiian and other Pacific Islander householders$208,956 Some other race householders$246,348 Two or more races householders$216,654 Hispanic or Latino householders
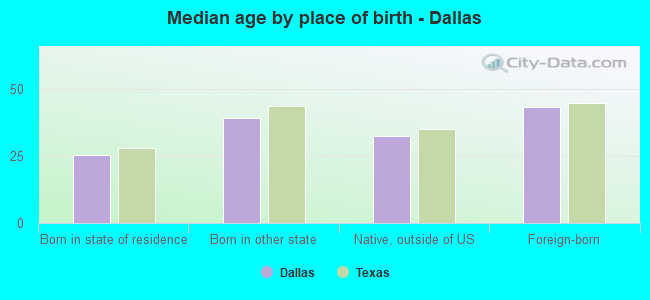
Median age by race in Dallas
37.1 Median age for White residents37.0 37.2 33.9 Median age for Black or African American residents32.4 35.6 33.9 Median age for American Indian / Alaska Native residents34.7 33.2 33.3 Median age for Asian residents32.8 34.1 26.5 Median age for Native Hawaiian / Pacific Islander residents-666,666,666.0 -666,666,666.0 28.3 Median age for Other race residents29.6 26.6 29.2 Median age for Two or more races residents29.2 29.2 40.8 Median age for White alone residents40.3 41.3 28.0 Median age for Hispanic or Latino residents27.9 28.1
Owner/renter occupied households by race in Dallas
House owners and renters - White residents 112,026 52.3% Owner occupied102,057 47.7% Renter occupiedHouse owners and renters - Black or African American residents 36,192 25.7% Owner occupied104,487 74.3% Renter occupiedHouse owners and renters - American Indian / Alaska Native residents 2,395 54.4% Owner occupied2,004 45.6% Renter occupiedHouse owners and renters - Asian residents 7,757 30.8% Owner occupied17,428 69.2% Renter occupiedHouse owners and renters - Native Hawaiian / Pacific Islander residents 126 33.8% Owner occupied248 66.2% Renter occupiedHouse owners and renters - Other race residents 25,364 39.8% Owner occupied38,401 60.2% Renter occupiedHouse owners and renters - Two or more races residents 40,203 43.9% Owner occupied51,276 56.1% Renter occupiedHouse owners and renters - White alone residents 100,117 53.3% Owner occupied87,759 46.7% Renter occupiedHouse owners and renters - Hispanic or Latino residents 74,467 43.7% Owner occupied95,930 56.3% Renter occupied
Language usage in Dallas
English speakers - Total 57.4% of residents of Dallas speak English at home.
36.3% of residents speak Spanish at home 238,519 54.5% Speak English very well199,420 45.5% Speak English less than very well6.3% of residents speak other language at home 55,303 72.6% Speak English very well20,899 27.4% Speak English less than very well
English speakers - Born in the United States 88.3% of residents of Dallas speak English at home.
9.2% of residents speak Spanish at home 21,258 81.8% Speak English very well4,744 18.2% Speak English less than very well2.4% of residents speak other language at home 6,641 96.9% Speak English very well215 3.1% Speak English less than very well
English speakers - Native, born elsewhere 42.9% of residents of Dallas speak English at home.
45.2% of residents speak Spanish at home 4,561 66.3% Speak English very well2,314 33.7% Speak English less than very well11.9% of residents speak other language at home 1,809 100.0% Speak English very well
English speakers - Foreign-born 9.8% of residents of Dallas speak English at home.
71.0% of residents speak Spanish at home 57,677 26.5% Speak English very well160,374 73.5% Speak English less than very well19.2% of residents speak other language at home 38,522 65.3% Speak English very well20,437 34.7% Speak English less than very well
White (Caucasian) - Speak only English Native:
87.6% (325,652)Foreign-born:
22.7% (7,677)
White (Caucasian) - Speak another language Native:
12.4% (45,913)Foreign-born:
77.3% (26,172)
Black or African American - Speak only English Native:
97.4% (241,391)Foreign-born:
24.7% (7,186)
Black or African American - Speak another language Native:
2.6% (6,480)Foreign-born:
75.3% (21,954)
American Indian / Alaska Native - Speak only English Native:
62.8% (4,814)Foreign-born:
2.1% (78)
American Indian / Alaska Native - Speak another language Native:
37.2% (2,846)Foreign-born:
97.9% (3,575)
Asian - Speak only English Native:
57.3% (9,740)Foreign-born:
17.7% (5,607)
Asian - Speak another language Native:
42.7% (7,271)Foreign-born:
82.3% (26,127)
Native Hawaiian / Pacific Islander - Speak only English Native:
55.9% (122)Foreign-born:
48.2% (123)
Native Hawaiian / Pacific Islander - Speak another language Native:
45.0% (98)Foreign-born:
7.6% (19)
Other race - Speak only English Native:
20.0% (19,736)Foreign-born:
3.8% (3,762)
Other race - Speak another language Native:
80.0% (78,920)Foreign-born:
96.2% (96,266)
Two or more races - Speak only English Native:
39.1% (61,436)Foreign-born:
5.2% (5,608)
Two or more races - Speak another language Native:
60.9% (95,701)Foreign-born:
94.8% (102,916)
White alone - Speak only English Native:
96.2% (305,982)Foreign-born:
39.7% (6,170)
White alone - Speak another language Native:
3.8% (12,117)Foreign-born:
60.3% (9,366)
Hispanic or Latino - Speak only English Native:
27.7% (80,286)Foreign-born:
4.5% (10,228)
Hispanic or Latino - Speak another language Native:
72.3% (209,339)Foreign-born:
95.5% (217,277)
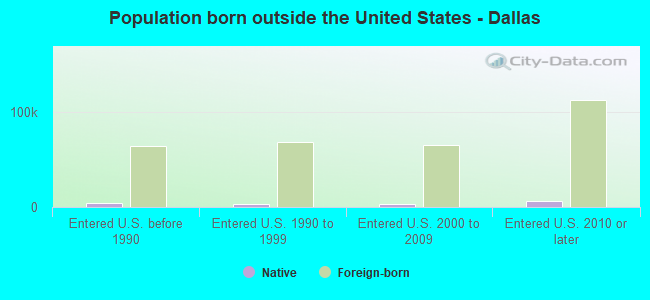
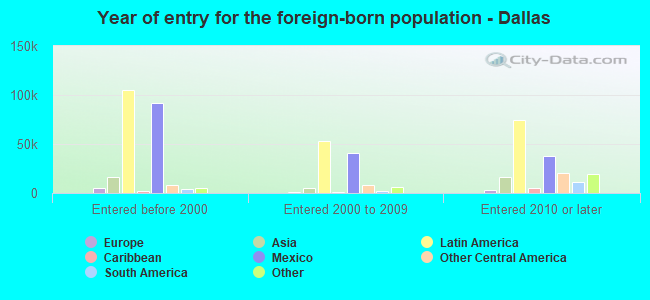
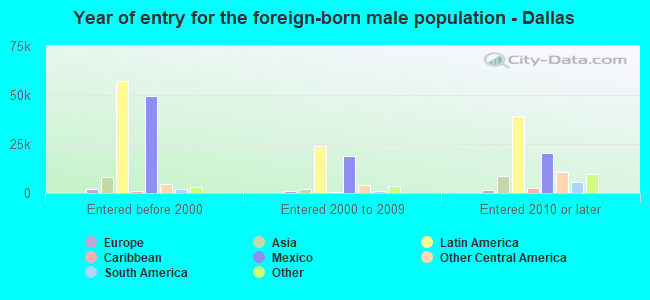
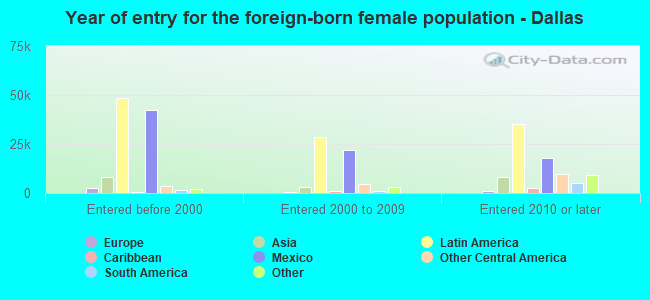
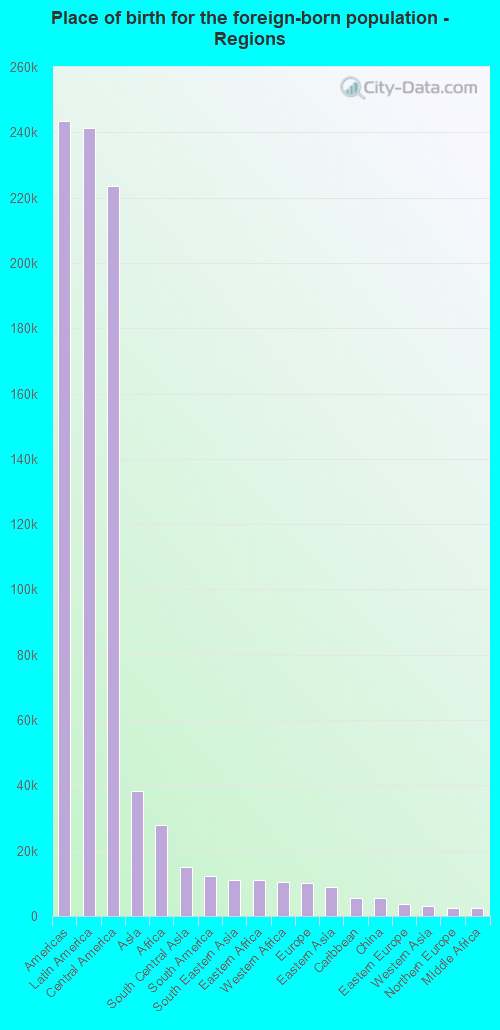
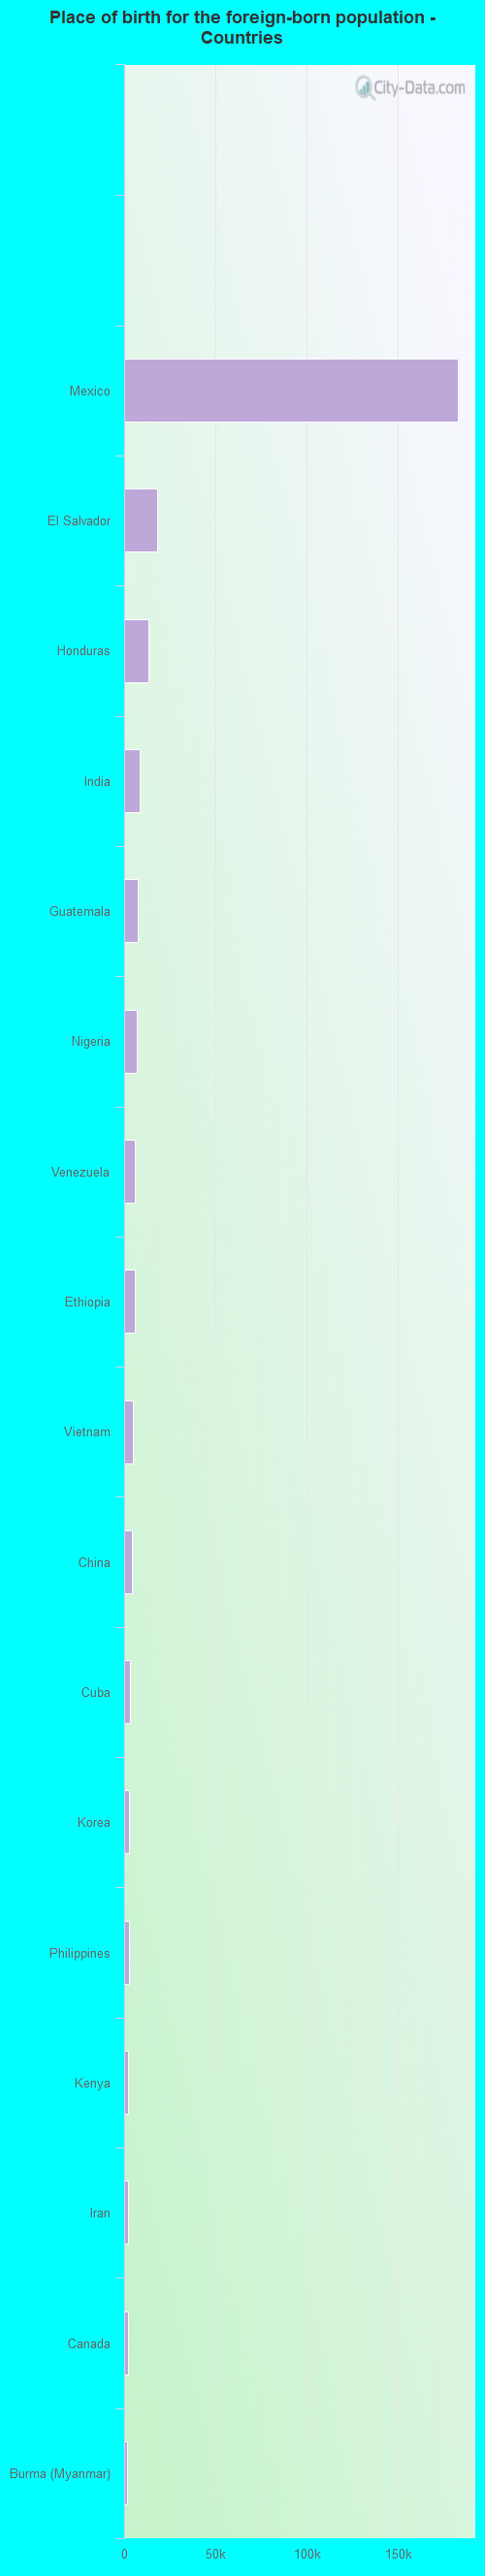
Foreign-born residents in Dallas 320,358 residents are foreign born (17.9% Latin America , 2.8% Asia ).
This city:
24.7%Texas:
17.1%
Marital status for residents in Dallas Marital status - White (Caucasian) population 15 years and over
Males 38.3% Never married49.0% Now married0.9% Separated2.3% Widowed9.5% DivorcedFemales 34.4% Never married44.4% Now married1.2% Separated7.5% Widowed12.4% DivorcedWomen who gave birth in the past 12 months Now married:
72.4% (4,440)Unmarried:
27.6% (1,693)
Women who did not give birth in the past 12 months Now married:
39.3% (40,279)Unmarried:
60.7% (62,284)
Marital status - Black or African American population 15 years and over
Males 52.4% Never married28.0% Now married2.7% Separated4.4% Widowed12.5% DivorcedFemales 52.8% Never married20.4% Now married4.1% Separated7.8% Widowed14.9% DivorcedWomen who gave birth in the past 12 months Now married:
49.3% (2,564)Unmarried:
50.7% (2,635)
Women who did not give birth in the past 12 months Now married:
19.1% (14,679)Unmarried:
80.9% (62,178)
Marital status - American Indian / Alaska Native population 15 years and over
Males 47.5% Never married36.0% Now married0.0% Separated1.5% Widowed15.1% DivorcedFemales 32.9% Never married35.8% Now married8.5% Separated20.3% Widowed2.5% DivorcedWomen who gave birth in the past 12 months Now married:
25.0% (5)Unmarried:
75.0% (14)
Women who did not give birth in the past 12 months Now married:
42.6% (1,081)Unmarried:
57.4% (1,459)
Marital status - Asian population 15 years and over
Males 50.5% Never married42.9% Now married0.9% Separated0.4% Widowed5.3% DivorcedFemales 34.2% Never married48.7% Now married3.1% Separated2.7% Widowed11.3% DivorcedWomen who gave birth in the past 12 months Now married:
93.1% (765)Unmarried:
6.9% (57)
Women who did not give birth in the past 12 months Now married:
44.0% (6,224)Unmarried:
56.0% (7,935)
Marital status - Native Hawaiian / Pacific Islander population 15 years and over
Males 25.9% Never married46.4% Now married0.0% Separated0.0% Widowed27.7% DivorcedFemales 45.3% Never married32.3% Now married22.4% Separated0.0% Widowed0.0% DivorcedWomen who did not give birth in the past 12 months Now married:
36.5% (51)Unmarried:
63.5% (88)
Marital status - Other race population 15 years and over
Males 48.0% Never married42.3% Now married4.2% Separated1.2% Widowed4.4% DivorcedFemales 47.2% Never married39.3% Now married4.4% Separated3.0% Widowed6.0% DivorcedWomen who gave birth in the past 12 months Now married:
65.2% (3,116)Unmarried:
34.8% (1,663)
Women who did not give birth in the past 12 months Now married:
35.9% (18,946)Unmarried:
64.1% (33,772)
Marital status - Two or more races population 15 years and over
Males 46.2% Never married44.3% Now married2.6% Separated0.6% Widowed6.3% DivorcedFemales 43.6% Never married41.7% Now married2.8% Separated3.4% Widowed8.5% DivorcedWomen who gave birth in the past 12 months Now married:
66.2% (3,176)Unmarried:
33.8% (1,623)
Women who did not give birth in the past 12 months Now married:
36.9% (28,473)Unmarried:
63.1% (48,751)
Marital status - White alone, not Hispanic / Latino population 15 years and over
Males 37.4% Never married49.9% Now married0.7% Separated2.4% Widowed9.7% DivorcedFemales 33.3% Never married44.3% Now married0.9% Separated8.4% Widowed13.1% DivorcedWomen who gave birth in the past 12 months Now married:
83.4% (3,548)Unmarried:
16.6% (704)
Women who did not give birth in the past 12 months Now married:
37.6% (30,354)Unmarried:
62.4% (50,301)
Marital status - Hispanic or Latino population 15 years and over
Males 46.0% Never married44.0% Now married3.2% Separated1.1% Widowed5.7% DivorcedFemales 43.5% Never married42.0% Now married3.6% Separated3.7% Widowed7.1% DivorcedWomen who gave birth in the past 12 months Now married:
62.7% (7,183)Unmarried:
37.3% (4,282)
Women who did not give birth in the past 12 months Now married:
38.9% (56,003)Unmarried:
61.1% (88,100)
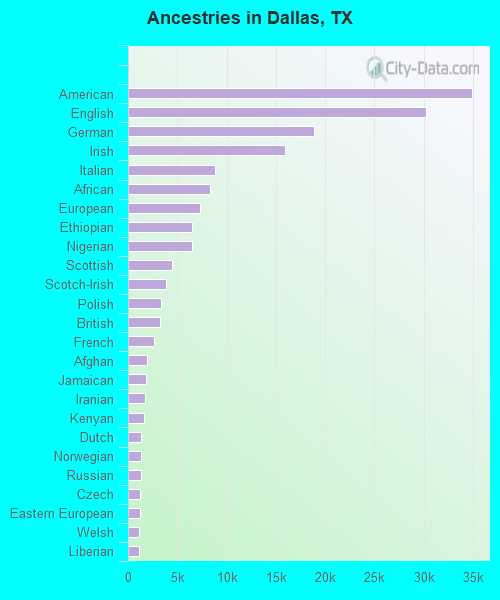
Ancestries in Dallas
34,892 4.0% American30,221 3.5% English18,881 2.2% German15,916 1.8% Irish8,841 1.0% Italian8,358 1.0% African7,320 0.8% European6,524 0.8% Ethiopian6,469 0.7% Nigerian4,437 0.5% Scottish3,818 0.4% Scotch-Irish3,299 0.4% Polish3,214 0.4% British2,641 0.3% French1,910 0.2% Afghan1,836 0.2% Jamaican1,710 0.2% Iranian1,575 0.2% Kenyan1,370 0.2% Dutch1,348 0.2% Norwegian1,302 0.1% Russian1,215 0.1% Czech1,183 0.1% Eastern European1,154 0.1% Welsh1,127 0.1% Liberian1,031 0.1% French Canadian981 0.1% Northern European943 0.1% Brazilian883 0.1% Lebanese805 0.09% Swedish735 0.08% Portuguese688 0.08% Turkish615 0.07% Ghanaian608 0.07% Greek585 0.07% Romanian571 0.07% Ukrainian509 0.06% Egyptian498 0.06% Albanian412 0.05% Haitian398 0.05% U.S. Virgin Islander390 0.04% South African389 0.04% Israeli366 0.04% Hungarian358 0.04% West Indian353 0.04% Armenian351 0.04% Arab326 0.04% Canadian320 0.04% Scandinavian320 0.04% Somali283 0.03% Lithuanian265 0.03% Cajun253 0.03% Serbian244 0.03% Slovene235 0.03% Australian220 0.03% Belgian200 0.02% Danish189 0.02% Czechoslovakian178 0.02% Basque178 0.02% Swiss165 0.02% Austrian157 0.02% Guyanese156 0.02% Moroccan155 0.02% Belizean153 0.02% Ugandan153 0.02% Trinidadian and Tobagonian152 0.02% Zimbabwean147 0.02% Finnish137 0.02% Jordanian136 0.02% Palestinian133 0.02% Bulgarian125 0.01% Iraqi118 0.01% Yugoslavian114 0.01% British West Indian106 0.01% Slovak98 0.01% Sierra Leonean89 0.01% Icelander86 0.01% Barbadian86 0.01% Syrian75 0.01% Senegalese67 0.01% Sudanese62 0.01% Celtic
Geographical mobility in Dallas Same house 1 year ago 345,201 81.2% White (Caucasian)248,938 84.0% Black or African American8,620 90.8% American Indian / Alaska Native37,408 74.0% Asian373 76.0% Native Hawaiian / Pacific Islander185,866 87.6% Other race249,940 88.0% Two or more races282,142 81.2% White alone, not Hispanic / Latino484,310 87.4% Hispanic or LatinoMoved within same county 45,533 10.7% White / Caucasian30,994 10.5% Black or African American413 4.3% American Indian / Alaska Native3,104 6.1% Asian39 7.9% Native Hawaiian / Pacific Islander14,738 6.9% Other race17,477 6.2% Two or more races34,955 10.1% White alone, not Hispanic / Latino41,629 7.5% Hispanic or LatinoMoved within same state 16,886 4.0% White / Caucasian9,875 3.3% Black or African American234 2.5% American Indian / Alaska Native3,670 7.3% Asian1,960 0.9% Other race8,444 3.0% Two or more races14,273 4.1% White alone, not Hispanic / Latino9,744 1.8% Hispanic or LatinoMoved from different state 15,555 3.7% White / Caucasian5,881 2.0% Black or African American201 2.1% American Indian / Alaska Native3,212 6.4% Asian33 6.7% Native Hawaiian / Pacific Islander2,252 1.1% Other race2,544 0.9% Two or more races14,623 4.2% White alone, not Hispanic / Latino5,243 0.9% Hispanic or LatinoMoved from abroad 2,033 0.5% White573 0.2% Black or African American73 0.8% American Indian / Alaska Native3,168 6.3% Asian3 0.6% Native Hawaiian / Pacific Islander7,255 3.4% Other race5,583 2.0% Two or more races1,424 0.4% White alone, not Hispanic / Latino12,907 2.3% Hispanic or Latino
Children Nativity (place of birth) in Dallas
Children under 6 years - Living with two parents Both parents native 28,451 100.0% NativeBoth parents foreign-born 19,626 86.3% Native3,122 13.7% Foreign-bornOne native, one foreign-born parent 10,324 100.0% NativeChildren under 6 years - Living with one parent Native parent 33,375 100.0% NativeForeign-born parent 10,387 93.0% Native786 7.0% Foreign-bornChildren 6 to 17 years - Living with two parents Both parents native 33,693 99.5% Native165 0.5% Foreign-bornBoth parents foreign-born 40,473 80.8% Native9,588 19.2% Foreign-bornOne native, one foreign-born parent 15,624 98.8% Native189 1.2% Foreign-bornChildren 6 to 17 years - Living with one parent Native parent 48,909 100.0% NativeForeign-born parent 30,837 55.9% Native24,338 44.1% Foreign-born
Place of birth for residents in Dallas 243,317 Americas241,357 Latin America223,506 Central America38,390 Asia28,011 Africa15,020 South Central Asia12,221 South America11,167 South Eastern Asia11,037 Eastern Africa10,371 Western Africa10,053 Europe8,934 Eastern Asia5,629 Caribbean5,499 China3,674 Eastern Europe3,083 Western Asia2,559 Northern Europe2,457 Middle Africa2,057 Western Europe1,959 Northern America1,761 Southern Europe1,165 Northern Africa1,047 Southern Africa585 Oceania366 Australia and New Zealand Subregion182,847 Mexico18,014 El Salvador13,302 Honduras8,524 India7,335 Guatemala7,132 Nigeria5,806 Venezuela5,638 Ethiopia4,644 Vietnam4,194 China2,946 Cuba2,520 Korea2,404 Philippines2,312 Kenya1,965 Iran1,914 Canada1,736 Burma (Myanmar)1,471 Colombia1,389 Pakistan1,302 Peru1,291 Thailand1,289 Brazil1,094 Taiwan1,092 Cameroon1,081 Liberia1,015 Jamaica1,010 Afghanistan1,009 Nicaragua1,008 Eritrea1,002 England966 South Africa955 Ivory Coast904 Russia903 France879 United Kingdom813 Germany805 Spain752 Japan745 Iraq733 Bangladesh673 Dominican Republic644 Ukraine601 Israel582 Italy574 Argentina538 Turkey507 Ghana506 Zimbabwe503 Sri Lanka500 Nepal490 Tanzania474 Costa Rica436 Chile425 Congo423 Panama419 Ecuador408 Democratic Republic of Congo (Zaire)396 Sudan375 Cambodia351 Morocco343 Poland318 Romania312 Bolivia310 Haiti278 Bulgaria277 Jordan270 Ireland263 Australia242 Lebanon241 Albania231 Laos223 Greece214 Saudi Arabia211 Hong Kong208 Guyana207 Egypt196 Malaysia194 Bhutan183 Sierra Leone172 Indonesia156 Fiji156 Belarus152 Bosnia and Herzegovina150 Portugal138 Switzerland137 Czechoslovakia128 Syria124 Netherlands108 Singapore103 New Zealand101 Hungary98 Yemen95 Uganda94 Algeria93 Bahamas91 Moldova90 Togo90 Somalia81 Serbia76 Scotland74 Belize69 Dominica65 Senegal64 Sweden61 Trinidad and Tobago55 Belgium54 Kazakhstan47 Uruguay45 Kuwait43 Norway38 Uzbekistan38 Azores Islands36 United Arab Emirates36 Azerbaijan36 Cabo Verde35 West Indies33 Armenia26 Georgia24 Croatia21 Denmark20 Austria14 Barbados9 Lithuania5 Latvia
Grandparents responsible for own grandchildren in Dallas
Grandparents (30 to 59 years) White / Caucasian 754 22.9% Responsible for grandchildren2,534 77.1% Not responsible for grandchildrenBlack or African American 2,339 59.0% Responsible for grandchildren1,625 41.0% Not responsible for grandchildrenAmerican Indian / Alaska Native 88 51.9% Responsible for grandchildren81 48.1% Not responsible for grandchildrenAsian 97 68.0% Responsible for grandchildren46 32.0% Not responsible for grandchildrenOther race 1,656 31.2% Responsible for grandchildren3,654 68.8% Not responsible for grandchildrenTwo or more races 1,194 25.8% Responsible for grandchildren3,434 74.2% Not responsible for grandchildrenWhite alone, not Hispanic / Latino 296 48.5% Responsible for grandchildren315 51.5% Not responsible for grandchildrenHispanic or Latino 2,850 25.3% Responsible for grandchildren8,431 74.7% Not responsible for grandchildrenGrandparents (60 years and over) White / Caucasian 1,209 36.6% Responsible for grandchildren2,094 63.4% Not responsible for grandchildrenBlack or African American 2,926 56.2% Responsible for grandchildren2,277 43.8% Not responsible for grandchildrenAmerican Indian / Alaska Native 13 8.5% Responsible for grandchildren144 91.5% Not responsible for grandchildrenAsian 107 30.5% Responsible for grandchildren243 69.5% Not responsible for grandchildrenOther race 649 21.9% Responsible for grandchildren2,308 78.1% Not responsible for grandchildrenTwo or more races 78 2.2% Responsible for grandchildren3,475 97.8% Not responsible for grandchildrenWhite alone, not Hispanic / Latino 795 41.0% Responsible for grandchildren1,145 59.0% Not responsible for grandchildrenHispanic or Latino 862 12.1% Responsible for grandchildren6,261 87.9% Not responsible for grandchildren
Zip codes: 75032 , 75039 , 75041 , 75043 , 75060 , 75061 , 75062 , 75075 , 75080 , 75081 , 75087 , 75088 , 75089 , 75098 , 75116 , 75126 , 75134 , 75141 , 75150 , 75166 , 75182 , 75201 , 75202 , 75203 , 75204 , 75205 , 75206 , 75207 , 75208 , 75209 , 75210 , 75212 , 75214 , 75215 , 75216 , 75218 , 75219 , 75220 , 75223 , 75224 , 75225 , 75226 , 75227 , 75228 , 75229 , 75230 , 75231 , 75232 , 75233 , 75234 , 75235 , 75236 , 75237 , 75238 , 75240 , 75241 , 75243 , 75246 , 75247 , 75251 , 75252 , 75270, 75390.