Estimated zip code population in 2022: 66,024
Zip code population in 2010: 58,094
Zip code population in 2000: 53,343
Houses and condos: 24,235
Renter-occupied apartments: 9,354
% of renters here:
40%State:
38%
March 2022 cost of living index in zip code 75043: 95.0
(less than average, U.S. average is 100)
Land area: 14.5
sq. mi.
Water area: 5.2
sq. mi.
Population density: 4,545 people per square mile (average).
OSM Map
General Map
Google Map
MSN Map
OSM Map
General Map
Google Map
MSN Map
OSM Map
General Map
Google Map
MSN Map
OSM Map
General Map
Google Map
MSN Map
Please wait while loading the map...
Real estate property taxes paid for housing units in 2022:
This zip code:
1.5% ($4,237)Texas:
1.5% ($4,050)
Median real estate property taxes paid for housing units with mortgages in 2022: $4,779 (1.6%)
Median real estate property taxes paid for housing units with no mortgage in 2022: $3,538 (1.4%)
Profiles of local businesses
Business Search - 14 Million verified businesses
Males: 32,052 Females: 33,972
For population 25 years and over in 75043:
High school or higher: 83.0%Bachelor's degree or higher: 24.3%Graduate or professional degree: 8.9%Unemployed: 5.5%Mean travel time to work (commute): 31.7 minutes
For population 15 years and over in 75043:
Never married: 35.5%Now married: 47.1%Separated: 2.5%Widowed: 4.9%Divorced: 10.0%
Zip code 75043 compared to state average:
Black race population percentage above state average. Length of stay since moving in significantly above state average. 23,193 35.1% Hispanic or Latino 19,892 30.1% White 15,087 22.9% Black 4,396 6.7% Asian 2,254 3.4% Two or more races 1,050 1.6% Some other race 143 0.2% American Indian 7 0.01% Native Hawaiian and Other
Data:
Median household income ($)
Median household income (% change since 2000)
Household income diversity
Ratio of average income to average house value (%)
Ratio of average income to average rent
Median household income ($) - White
Median household income ($) - Black or African American
Median household income ($) - Asian
Median household income ($) - Hispanic or Latino
Median household income ($) - American Indian and Alaska Native
Median household income ($) - Multirace
Median household income ($) - Other Race
Median household income for houses/condos with a mortgage ($)
Median household income for apartments without a mortgage ($)
Races - White alone (%)
Races - White alone (% change since 2000)
Races - Black alone (%)
Races - Black alone (% change since 2000)
Races - American Indian alone (%)
Races - American Indian alone (% change since 2000)
Races - Asian alone (%)
Races - Asian alone (% change since 2000)
Races - Hispanic (%)
Races - Hispanic (% change since 2000)
Races - Native Hawaiian and Other Pacific Islander alone (%)
Races - Native Hawaiian and Other Pacific Islander alone (% change since 2000)
Races - Two or more races (%)
Races - Two or more races (% change since 2000)
Races - Other race alone (%)
Races - Other race alone (% change since 2000)
Racial diversity
Unemployment (%)
Unemployment (% change since 2000)
Unemployment (%) - White
Unemployment (%) - Black or African American
Unemployment (%) - Asian
Unemployment (%) - Hispanic or Latino
Unemployment (%) - American Indian and Alaska Native
Unemployment (%) - Multirace
Unemployment (%) - Other Race
Population density (people per square mile)
Population - Males (%)
Population - Females (%)
Population - Males (%) - White
Population - Males (%) - Black or African American
Population - Males (%) - Asian
Population - Males (%) - Hispanic or Latino
Population - Males (%) - American Indian and Alaska Native
Population - Males (%) - Multirace
Population - Males (%) - Other Race
Population - Females (%) - White
Population - Females (%) - Black or African American
Population - Females (%) - Asian
Population - Females (%) - Hispanic or Latino
Population - Females (%) - American Indian and Alaska Native
Population - Females (%) - Multirace
Population - Females (%) - Other Race
Coronavirus confirmed cases (May 11, 2024)
Deaths caused by coronavirus (May 11, 2024)
Coronavirus confirmed cases (per 100k population) (May 11, 2024)
Deaths caused by coronavirus (per 100k population) (May 11, 2024)
Daily increase in number of cases (May 11, 2024)
Weekly increase in number of cases (May 11, 2024)
Cases doubled (in days) (May 11, 2024)
Hospitalized patients (Apr 18, 2022)
Negative test results (Apr 18, 2022)
Total test results (Apr 18, 2022)
COVID Vaccine doses distributed (per 100k population) (Sep 19, 2023)
COVID Vaccine doses administered (per 100k population) (Sep 19, 2023)
COVID Vaccine doses distributed (Sep 19, 2023)
COVID Vaccine doses administered (Sep 19, 2023)
Likely homosexual households (%)
Likely homosexual households (% change since 2000)
Likely homosexual households - Lesbian couples (%)
Likely homosexual households - Lesbian couples (% change since 2000)
Likely homosexual households - Gay men (%)
Likely homosexual households - Gay men (% change since 2000)
Cost of living index
Median gross rent ($)
Median contract rent ($)
Median monthly housing costs ($)
Median house or condo value ($)
Median house or condo value ($ change since 2000)
Mean house or condo value by units in structure - 1, detached ($)
Mean house or condo value by units in structure - 1, attached ($)
Mean house or condo value by units in structure - 2 ($)
Mean house or condo value by units in structure by units in structure - 3 or 4 ($)
Mean house or condo value by units in structure - 5 or more ($)
Mean house or condo value by units in structure - Boat, RV, van, etc. ($)
Mean house or condo value by units in structure - Mobile home ($)
Median house or condo value ($) - White
Median house or condo value ($) - Black or African American
Median house or condo value ($) - Asian
Median house or condo value ($) - Hispanic or Latino
Median house or condo value ($) - American Indian and Alaska Native
Median house or condo value ($) - Multirace
Median house or condo value ($) - Other Race
Median resident age
Resident age diversity
Median resident age - Males
Median resident age - Females
Median resident age - White
Median resident age - Black or African American
Median resident age - Asian
Median resident age - Hispanic or Latino
Median resident age - American Indian and Alaska Native
Median resident age - Multirace
Median resident age - Other Race
Median resident age - Males - White
Median resident age - Males - Black or African American
Median resident age - Males - Asian
Median resident age - Males - Hispanic or Latino
Median resident age - Males - American Indian and Alaska Native
Median resident age - Males - Multirace
Median resident age - Males - Other Race
Median resident age - Females - White
Median resident age - Females - Black or African American
Median resident age - Females - Asian
Median resident age - Females - Hispanic or Latino
Median resident age - Females - American Indian and Alaska Native
Median resident age - Females - Multirace
Median resident age - Females - Other Race
Commute - mean travel time to work (minutes)
Travel time to work - Less than 5 minutes (%)
Travel time to work - Less than 5 minutes (% change since 2000)
Travel time to work - 5 to 9 minutes (%)
Travel time to work - 5 to 9 minutes (% change since 2000)
Travel time to work - 10 to 19 minutes (%)
Travel time to work - 10 to 19 minutes (% change since 2000)
Travel time to work - 20 to 29 minutes (%)
Travel time to work - 20 to 29 minutes (% change since 2000)
Travel time to work - 30 to 39 minutes (%)
Travel time to work - 30 to 39 minutes (% change since 2000)
Travel time to work - 40 to 59 minutes (%)
Travel time to work - 40 to 59 minutes (% change since 2000)
Travel time to work - 60 to 89 minutes (%)
Travel time to work - 60 to 89 minutes (% change since 2000)
Travel time to work - 90 or more minutes (%)
Travel time to work - 90 or more minutes (% change since 2000)
Marital status - Never married (%)
Marital status - Now married (%)
Marital status - Separated (%)
Marital status - Widowed (%)
Marital status - Divorced (%)
Median family income ($)
Median family income (% change since 2000)
Median non-family income ($)
Median non-family income (% change since 2000)
Median per capita income ($)
Median per capita income (% change since 2000)
Median family income ($) - White
Median family income ($) - Black or African American
Median family income ($) - Asian
Median family income ($) - Hispanic or Latino
Median family income ($) - American Indian and Alaska Native
Median family income ($) - Multirace
Median family income ($) - Other Race
Median year house/condo built
Median year apartment built
Year house built - Built 2005 or later (%)
Year house built - Built 2000 to 2004 (%)
Year house built - Built 1990 to 1999 (%)
Year house built - Built 1980 to 1989 (%)
Year house built - Built 1970 to 1979 (%)
Year house built - Built 1960 to 1969 (%)
Year house built - Built 1950 to 1959 (%)
Year house built - Built 1940 to 1949 (%)
Year house built - Built 1939 or earlier (%)
Average household size
Household density (households per square mile)
Average household size - White
Average household size - Black or African American
Average household size - Asian
Average household size - Hispanic or Latino
Average household size - American Indian and Alaska Native
Average household size - Multirace
Average household size - Other Race
Occupied housing units (%)
Vacant housing units (%)
Owner occupied housing units (%)
Renter occupied housing units (%)
Vacancy status - For rent (%)
Vacancy status - For sale only (%)
Vacancy status - Rented or sold, not occupied (%)
Vacancy status - For seasonal, recreational, or occasional use (%)
Vacancy status - For migrant workers (%)
Vacancy status - Other vacant (%)
Residents with income below the poverty level (%)
Residents with income below 50% of the poverty level (%)
Children below poverty level (%)
Poor families by family type - Married-couple family (%)
Poor families by family type - Male, no wife present (%)
Poor families by family type - Female, no husband present (%)
Poverty status for native-born residents (%)
Poverty status for foreign-born residents (%)
Poverty among high school graduates not in families (%)
Poverty among people who did not graduate high school not in families (%)
Residents with income below the poverty level (%) - White
Residents with income below the poverty level (%) - Black or African American
Residents with income below the poverty level (%) - Asian
Residents with income below the poverty level (%) - Hispanic or Latino
Residents with income below the poverty level (%) - American Indian and Alaska Native
Residents with income below the poverty level (%) - Multirace
Residents with income below the poverty level (%) - Other Race
Air pollution - Air Quality Index (AQI)
Air pollution - CO
Air pollution - NO2
Air pollution - SO2
Air pollution - Ozone
Air pollution - PM10
Air pollution - PM25
Air pollution - Pb
Crime - Murders per 100,000 population
Crime - Rapes per 100,000 population
Crime - Robberies per 100,000 population
Crime - Assaults per 100,000 population
Crime - Burglaries per 100,000 population
Crime - Thefts per 100,000 population
Crime - Auto thefts per 100,000 population
Crime - Arson per 100,000 population
Crime - City-data.com crime index
Crime - Violent crime index
Crime - Property crime index
Crime - Murders per 100,000 population (5 year average)
Crime - Rapes per 100,000 population (5 year average)
Crime - Robberies per 100,000 population (5 year average)
Crime - Assaults per 100,000 population (5 year average)
Crime - Burglaries per 100,000 population (5 year average)
Crime - Thefts per 100,000 population (5 year average)
Crime - Auto thefts per 100,000 population (5 year average)
Crime - Arson per 100,000 population (5 year average)
Crime - City-data.com crime index (5 year average)
Crime - Violent crime index (5 year average)
Crime - Property crime index (5 year average)
1996 Presidential Elections Results (%) - Democratic Party (Clinton)
1996 Presidential Elections Results (%) - Republican Party (Dole)
1996 Presidential Elections Results (%) - Other
2000 Presidential Elections Results (%) - Democratic Party (Gore)
2000 Presidential Elections Results (%) - Republican Party (Bush)
2000 Presidential Elections Results (%) - Other
2004 Presidential Elections Results (%) - Democratic Party (Kerry)
2004 Presidential Elections Results (%) - Republican Party (Bush)
2004 Presidential Elections Results (%) - Other
2008 Presidential Elections Results (%) - Democratic Party (Obama)
2008 Presidential Elections Results (%) - Republican Party (McCain)
2008 Presidential Elections Results (%) - Other
2012 Presidential Elections Results (%) - Democratic Party (Obama)
2012 Presidential Elections Results (%) - Republican Party (Romney)
2012 Presidential Elections Results (%) - Other
2016 Presidential Elections Results (%) - Democratic Party (Clinton)
2016 Presidential Elections Results (%) - Republican Party (Trump)
2016 Presidential Elections Results (%) - Other
2020 Presidential Elections Results (%) - Democratic Party (Biden)
2020 Presidential Elections Results (%) - Republican Party (Trump)
2020 Presidential Elections Results (%) - Other
Ancestries Reported - Arab (%)
Ancestries Reported - Czech (%)
Ancestries Reported - Danish (%)
Ancestries Reported - Dutch (%)
Ancestries Reported - English (%)
Ancestries Reported - French (%)
Ancestries Reported - French Canadian (%)
Ancestries Reported - German (%)
Ancestries Reported - Greek (%)
Ancestries Reported - Hungarian (%)
Ancestries Reported - Irish (%)
Ancestries Reported - Italian (%)
Ancestries Reported - Lithuanian (%)
Ancestries Reported - Norwegian (%)
Ancestries Reported - Polish (%)
Ancestries Reported - Portuguese (%)
Ancestries Reported - Russian (%)
Ancestries Reported - Scotch-Irish (%)
Ancestries Reported - Scottish (%)
Ancestries Reported - Slovak (%)
Ancestries Reported - Subsaharan African (%)
Ancestries Reported - Swedish (%)
Ancestries Reported - Swiss (%)
Ancestries Reported - Ukrainian (%)
Ancestries Reported - United States (%)
Ancestries Reported - Welsh (%)
Ancestries Reported - West Indian (%)
Ancestries Reported - Other (%)
Educational Attainment - No schooling completed (%)
Educational Attainment - Less than high school (%)
Educational Attainment - High school or equivalent (%)
Educational Attainment - Less than 1 year of college (%)
Educational Attainment - 1 or more years of college (%)
Educational Attainment - Associate degree (%)
Educational Attainment - Bachelor's degree (%)
Educational Attainment - Master's degree (%)
Educational Attainment - Professional school degree (%)
Educational Attainment - Doctorate degree (%)
School Enrollment - Nursery, preschool (%)
School Enrollment - Kindergarten (%)
School Enrollment - Grade 1 to 4 (%)
School Enrollment - Grade 5 to 8 (%)
School Enrollment - Grade 9 to 12 (%)
School Enrollment - College undergrad (%)
School Enrollment - Graduate or professional (%)
School Enrollment - Not enrolled in school (%)
School enrollment - Public schools (%)
School enrollment - Private schools (%)
School enrollment - Not enrolled (%)
Median number of rooms in houses and condos
Median number of rooms in apartments
Housing units lacking complete plumbing facilities (%)
Housing units lacking complete kitchen facilities (%)
Density of houses
Urban houses (%)
Rural houses (%)
Households with people 60 years and over (%)
Households with people 65 years and over (%)
Households with people 75 years and over (%)
Households with one or more nonrelatives (%)
Households with no nonrelatives (%)
Population in households (%)
Family households (%)
Nonfamily households (%)
Population in families (%)
Family households with own children (%)
Median number of bedrooms in owner occupied houses
Mean number of bedrooms in owner occupied houses
Median number of bedrooms in renter occupied houses
Mean number of bedrooms in renter occupied houses
Median number of vehichles in owner occupied houses
Mean number of vehichles in owner occupied houses
Median number of vehichles in renter occupied houses
Mean number of vehichles in renter occupied houses
Mortgage status - with mortgage (%)
Mortgage status - with second mortgage (%)
Mortgage status - with home equity loan (%)
Mortgage status - with both second mortgage and home equity loan (%)
Mortgage status - without a mortgage (%)
Average family size
Average family size - White
Average family size - Black or African American
Average family size - Asian
Average family size - Hispanic or Latino
Average family size - American Indian and Alaska Native
Average family size - Multirace
Average family size - Other Race
Geographical mobility - Same house 1 year ago (%)
Geographical mobility - Moved within same county (%)
Geographical mobility - Moved from different county within same state (%)
Geographical mobility - Moved from different state (%)
Geographical mobility - Moved from abroad (%)
Place of birth - Born in state of residence (%)
Place of birth - Born in other state (%)
Place of birth - Native, outside of US (%)
Place of birth - Foreign born (%)
Housing units in structures - 1, detached (%)
Housing units in structures - 1, attached (%)
Housing units in structures - 2 (%)
Housing units in structures - 3 or 4 (%)
Housing units in structures - 5 to 9 (%)
Housing units in structures - 10 to 19 (%)
Housing units in structures - 20 to 49 (%)
Housing units in structures - 50 or more (%)
Housing units in structures - Mobile home (%)
Housing units in structures - Boat, RV, van, etc. (%)
House/condo owner moved in on average (years ago)
Renter moved in on average (years ago)
Year householder moved into unit - Moved in 1999 to March 2000 (%)
Year householder moved into unit - Moved in 1995 to 1998 (%)
Year householder moved into unit - Moved in 1990 to 1994 (%)
Year householder moved into unit - Moved in 1980 to 1989 (%)
Year householder moved into unit - Moved in 1970 to 1979 (%)
Year householder moved into unit - Moved in 1969 or earlier (%)
Means of transportation to work - Drove car alone (%)
Means of transportation to work - Carpooled (%)
Means of transportation to work - Public transportation (%)
Means of transportation to work - Bus or trolley bus (%)
Means of transportation to work - Streetcar or trolley car (%)
Means of transportation to work - Subway or elevated (%)
Means of transportation to work - Railroad (%)
Means of transportation to work - Ferryboat (%)
Means of transportation to work - Taxicab (%)
Means of transportation to work - Motorcycle (%)
Means of transportation to work - Bicycle (%)
Means of transportation to work - Walked (%)
Means of transportation to work - Other means (%)
Working at home (%)
Industry diversity
Most Common Industries - Agriculture, forestry, fishing and hunting, and mining (%)
Most Common Industries - Agriculture, forestry, fishing and hunting (%)
Most Common Industries - Mining, quarrying, and oil and gas extraction (%)
Most Common Industries - Construction (%)
Most Common Industries - Manufacturing (%)
Most Common Industries - Wholesale trade (%)
Most Common Industries - Retail trade (%)
Most Common Industries - Transportation and warehousing, and utilities (%)
Most Common Industries - Transportation and warehousing (%)
Most Common Industries - Utilities (%)
Most Common Industries - Information (%)
Most Common Industries - Finance and insurance, and real estate and rental and leasing (%)
Most Common Industries - Finance and insurance (%)
Most Common Industries - Real estate and rental and leasing (%)
Most Common Industries - Professional, scientific, and management, and administrative and waste management services (%)
Most Common Industries - Professional, scientific, and technical services (%)
Most Common Industries - Management of companies and enterprises (%)
Most Common Industries - Administrative and support and waste management services (%)
Most Common Industries - Educational services, and health care and social assistance (%)
Most Common Industries - Educational services (%)
Most Common Industries - Health care and social assistance (%)
Most Common Industries - Arts, entertainment, and recreation, and accommodation and food services (%)
Most Common Industries - Arts, entertainment, and recreation (%)
Most Common Industries - Accommodation and food services (%)
Most Common Industries - Other services, except public administration (%)
Most Common Industries - Public administration (%)
Occupation diversity
Most Common Occupations - Management, business, science, and arts occupations (%)
Most Common Occupations - Management, business, and financial occupations (%)
Most Common Occupations - Management occupations (%)
Most Common Occupations - Business and financial operations occupations (%)
Most Common Occupations - Computer, engineering, and science occupations (%)
Most Common Occupations - Computer and mathematical occupations (%)
Most Common Occupations - Architecture and engineering occupations (%)
Most Common Occupations - Life, physical, and social science occupations (%)
Most Common Occupations - Education, legal, community service, arts, and media occupations (%)
Most Common Occupations - Community and social service occupations (%)
Most Common Occupations - Legal occupations (%)
Most Common Occupations - Education, training, and library occupations (%)
Most Common Occupations - Arts, design, entertainment, sports, and media occupations (%)
Most Common Occupations - Healthcare practitioners and technical occupations (%)
Most Common Occupations - Health diagnosing and treating practitioners and other technical occupations (%)
Most Common Occupations - Health technologists and technicians (%)
Most Common Occupations - Service occupations (%)
Most Common Occupations - Healthcare support occupations (%)
Most Common Occupations - Protective service occupations (%)
Most Common Occupations - Fire fighting and prevention, and other protective service workers including supervisors (%)
Most Common Occupations - Law enforcement workers including supervisors (%)
Most Common Occupations - Food preparation and serving related occupations (%)
Most Common Occupations - Building and grounds cleaning and maintenance occupations (%)
Most Common Occupations - Personal care and service occupations (%)
Most Common Occupations - Sales and office occupations (%)
Most Common Occupations - Sales and related occupations (%)
Most Common Occupations - Office and administrative support occupations (%)
Most Common Occupations - Natural resources, construction, and maintenance occupations (%)
Most Common Occupations - Farming, fishing, and forestry occupations (%)
Most Common Occupations - Construction and extraction occupations (%)
Most Common Occupations - Installation, maintenance, and repair occupations (%)
Most Common Occupations - Production, transportation, and material moving occupations (%)
Most Common Occupations - Production occupations (%)
Most Common Occupations - Transportation occupations (%)
Most Common Occupations - Material moving occupations (%)
People in Group quarters - Institutionalized population (%)
People in Group quarters - Correctional institutions (%)
People in Group quarters - Federal prisons and detention centers (%)
People in Group quarters - Halfway houses (%)
People in Group quarters - Local jails and other confinement facilities (including police lockups) (%)
People in Group quarters - Military disciplinary barracks (%)
People in Group quarters - State prisons (%)
People in Group quarters - Other types of correctional institutions (%)
People in Group quarters - Nursing homes (%)
People in Group quarters - Hospitals/wards, hospices, and schools for the handicapped (%)
People in Group quarters - Hospitals/wards and hospices for chronically ill (%)
People in Group quarters - Hospices or homes for chronically ill (%)
People in Group quarters - Military hospitals or wards for chronically ill (%)
People in Group quarters - Other hospitals or wards for chronically ill (%)
People in Group quarters - Hospitals or wards for drug/alcohol abuse (%)
People in Group quarters - Mental (Psychiatric) hospitals or wards (%)
People in Group quarters - Schools, hospitals, or wards for the mentally retarded (%)
People in Group quarters - Schools, hospitals, or wards for the physically handicapped (%)
People in Group quarters - Institutions for the deaf (%)
People in Group quarters - Institutions for the blind (%)
People in Group quarters - Orthopedic wards and institutions for the physically handicapped (%)
People in Group quarters - Wards in general hospitals for patients who have no usual home elsewhere (%)
People in Group quarters - Wards in military hospitals for patients who have no usual home elsewhere (%)
People in Group quarters - Juvenile institutions (%)
People in Group quarters - Long-term care (%)
People in Group quarters - Homes for abused, dependent, and neglected children (%)
People in Group quarters - Residential treatment centers for emotionally disturbed children (%)
People in Group quarters - Training schools for juvenile delinquents (%)
People in Group quarters - Short-term care, detention or diagnostic centers for delinquent children (%)
People in Group quarters - Type of juvenile institution unknown (%)
People in Group quarters - Noninstitutionalized population (%)
People in Group quarters - College dormitories (includes college quarters off campus) (%)
People in Group quarters - Military quarters (%)
People in Group quarters - On base (%)
People in Group quarters - Barracks, unaccompanied personnel housing (UPH), (Enlisted/Officer), ;and similar group living quarters for military personnel (%)
People in Group quarters - Transient quarters for temporary residents (%)
People in Group quarters - Military ships (%)
People in Group quarters - Group homes (%)
People in Group quarters - Homes or halfway houses for drug/alcohol abuse (%)
People in Group quarters - Homes for the mentally ill (%)
People in Group quarters - Homes for the mentally retarded (%)
People in Group quarters - Homes for the physically handicapped (%)
People in Group quarters - Other group homes (%)
People in Group quarters - Religious group quarters (%)
People in Group quarters - Dormitories (%)
People in Group quarters - Agriculture workers' dormitories on farms (%)
People in Group quarters - Job Corps and vocational training facilities (%)
People in Group quarters - Other workers' dormitories (%)
People in Group quarters - Crews of maritime vessels (%)
People in Group quarters - Other nonhousehold living situations (%)
People in Group quarters - Other noninstitutional group quarters (%)
Residents speaking English at home (%)
Residents speaking English at home - Born in the United States (%)
Residents speaking English at home - Native, born elsewhere (%)
Residents speaking English at home - Foreign born (%)
Residents speaking Spanish at home (%)
Residents speaking Spanish at home - Born in the United States (%)
Residents speaking Spanish at home - Native, born elsewhere (%)
Residents speaking Spanish at home - Foreign born (%)
Residents speaking other language at home (%)
Residents speaking other language at home - Born in the United States (%)
Residents speaking other language at home - Native, born elsewhere (%)
Residents speaking other language at home - Foreign born (%)
Class of Workers - Employee of private company (%)
Class of Workers - Self-employed in own incorporated business (%)
Class of Workers - Private not-for-profit wage and salary workers (%)
Class of Workers - Local government workers (%)
Class of Workers - State government workers (%)
Class of Workers - Federal government workers (%)
Class of Workers - Self-employed workers in own not incorporated business and Unpaid family workers (%)
House heating fuel used in houses and condos - Utility gas (%)
House heating fuel used in houses and condos - Bottled, tank, or LP gas (%)
House heating fuel used in houses and condos - Electricity (%)
House heating fuel used in houses and condos - Fuel oil, kerosene, etc. (%)
House heating fuel used in houses and condos - Coal or coke (%)
House heating fuel used in houses and condos - Wood (%)
House heating fuel used in houses and condos - Solar energy (%)
House heating fuel used in houses and condos - Other fuel (%)
House heating fuel used in houses and condos - No fuel used (%)
House heating fuel used in apartments - Utility gas (%)
House heating fuel used in apartments - Bottled, tank, or LP gas (%)
House heating fuel used in apartments - Electricity (%)
House heating fuel used in apartments - Fuel oil, kerosene, etc. (%)
House heating fuel used in apartments - Coal or coke (%)
House heating fuel used in apartments - Wood (%)
House heating fuel used in apartments - Solar energy (%)
House heating fuel used in apartments - Other fuel (%)
House heating fuel used in apartments - No fuel used (%)
Armed forces status - In Armed Forces (%)
Armed forces status - Civilian (%)
Armed forces status - Civilian - Veteran (%)
Armed forces status - Civilian - Nonveteran (%)
Fatal accidents locations in years 2005-2021
Fatal accidents locations in 2005
Fatal accidents locations in 2006
Fatal accidents locations in 2007
Fatal accidents locations in 2008
Fatal accidents locations in 2009
Fatal accidents locations in 2010
Fatal accidents locations in 2011
Fatal accidents locations in 2012
Fatal accidents locations in 2013
Fatal accidents locations in 2014
Fatal accidents locations in 2015
Fatal accidents locations in 2016
Fatal accidents locations in 2017
Fatal accidents locations in 2018
Fatal accidents locations in 2019
Fatal accidents locations in 2020
Fatal accidents locations in 2021
Alcohol use - People drinking some alcohol every month (%)
Alcohol use - People not drinking at all (%)
Alcohol use - Average days/month drinking alcohol
Alcohol use - Average drinks/week
Alcohol use - Average days/year people drink much
Audiometry - Average condition of hearing (%)
Audiometry - People that can hear a whisper from across a quiet room (%)
Audiometry - People that can hear normal voice from across a quiet room (%)
Audiometry - Ears ringing, roaring, buzzing (%)
Audiometry - Had a job exposure to loud noise (%)
Audiometry - Had off-work exposure to loud noise (%)
Blood Pressure & Cholesterol - Has high blood pressure (%)
Blood Pressure & Cholesterol - Checking blood pressure at home (%)
Blood Pressure & Cholesterol - Frequently checking blood cholesterol (%)
Blood Pressure & Cholesterol - Has high cholesterol level (%)
Consumer Behavior - Money monthly spent on food at supermarket/grocery store
Consumer Behavior - Money monthly spent on food at other stores
Consumer Behavior - Money monthly spent on eating out
Consumer Behavior - Money monthly spent on carryout/delivered foods
Consumer Behavior - Income spent on food at supermarket/grocery store (%)
Consumer Behavior - Income spent on food at other stores (%)
Consumer Behavior - Income spent on eating out (%)
Consumer Behavior - Income spent on carryout/delivered foods (%)
Current Health Status - General health condition (%)
Current Health Status - Blood donors (%)
Current Health Status - Has blood ever tested for HIV virus (%)
Current Health Status - Left-handed people (%)
Dermatology - People using sunscreen (%)
Diabetes - Diabetics (%)
Diabetes - Had a blood test for high blood sugar (%)
Diabetes - People taking insulin (%)
Diet Behavior & Nutrition - Diet health (%)
Diet Behavior & Nutrition - Milk product consumption (# of products/month)
Diet Behavior & Nutrition - Meals not home prepared (#/week)
Diet Behavior & Nutrition - Meals from fast food or pizza place (#/week)
Diet Behavior & Nutrition - Ready-to-eat foods (#/month)
Diet Behavior & Nutrition - Frozen meals/pizza (#/month)
Drug Use - People that ever used marijuana or hashish (%)
Drug Use - Ever used hard drugs (%)
Drug Use - Ever used any form of cocaine (%)
Drug Use - Ever used heroin (%)
Drug Use - Ever used methamphetamine (%)
Health Insurance - People covered by health insurance (%)
Kidney Conditions-Urology - Avg. # of times urinating at night
Medical Conditions - People with asthma (%)
Medical Conditions - People with anemia (%)
Medical Conditions - People with psoriasis (%)
Medical Conditions - People with overweight (%)
Medical Conditions - Elderly people having difficulties in thinking or remembering (%)
Medical Conditions - People who ever received blood transfusion (%)
Medical Conditions - People having trouble seeing even with glass/contacts (%)
Medical Conditions - People with arthritis (%)
Medical Conditions - People with gout (%)
Medical Conditions - People with congestive heart failure (%)
Medical Conditions - People with coronary heart disease (%)
Medical Conditions - People with angina pectoris (%)
Medical Conditions - People who ever had heart attack (%)
Medical Conditions - People who ever had stroke (%)
Medical Conditions - People with emphysema (%)
Medical Conditions - People with thyroid problem (%)
Medical Conditions - People with chronic bronchitis (%)
Medical Conditions - People with any liver condition (%)
Medical Conditions - People who ever had cancer or malignancy (%)
Mental Health - People who have little interest in doing things (%)
Mental Health - People feeling down, depressed, or hopeless (%)
Mental Health - People who have trouble sleeping or sleeping too much (%)
Mental Health - People feeling tired or having little energy (%)
Mental Health - People with poor appetite or overeating (%)
Mental Health - People feeling bad about themself (%)
Mental Health - People who have trouble concentrating on things (%)
Mental Health - People moving or speaking slowly or too fast (%)
Mental Health - People having thoughts they would be better off dead (%)
Oral Health - Average years since last visit a dentist
Oral Health - People embarrassed because of mouth (%)
Oral Health - People with gum disease (%)
Oral Health - General health of teeth and gums (%)
Oral Health - Average days a week using dental floss/device
Oral Health - Average days a week using mouthwash for dental problem
Oral Health - Average number of teeth
Pesticide Use - Households using pesticides to control insects (%)
Pesticide Use - Households using pesticides to kill weeds (%)
Physical Activity - People doing vigorous-intensity work activities (%)
Physical Activity - People doing moderate-intensity work activities (%)
Physical Activity - People walking or bicycling (%)
Physical Activity - People doing vigorous-intensity recreational activities (%)
Physical Activity - People doing moderate-intensity recreational activities (%)
Physical Activity - Average hours a day doing sedentary activities
Physical Activity - Average hours a day watching TV or videos
Physical Activity - Average hours a day using computer
Physical Functioning - People having limitations keeping them from working (%)
Physical Functioning - People limited in amount of work they can do (%)
Physical Functioning - People that need special equipment to walk (%)
Physical Functioning - People experiencing confusion/memory problems (%)
Physical Functioning - People requiring special healthcare equipment (%)
Prescription Medications - Average number of prescription medicines taking
Preventive Aspirin Use - Adults 40+ taking low-dose aspirin (%)
Reproductive Health - Vaginal deliveries (%)
Reproductive Health - Cesarean deliveries (%)
Reproductive Health - Deliveries resulted in a live birth (%)
Reproductive Health - Pregnancies resulted in a delivery (%)
Reproductive Health - Women breastfeeding newborns (%)
Reproductive Health - Women that had a hysterectomy (%)
Reproductive Health - Women that had both ovaries removed (%)
Reproductive Health - Women that have ever taken birth control pills (%)
Reproductive Health - Women taking birth control pills (%)
Reproductive Health - Women that have ever used Depo-Provera or injectables (%)
Reproductive Health - Women that have ever used female hormones (%)
Sexual Behavior - People 18+ that ever had sex (vaginal, anal, or oral) (%)
Sexual Behavior - Males 18+ that ever had vaginal sex with a woman (%)
Sexual Behavior - Males 18+ that ever performed oral sex on a woman (%)
Sexual Behavior - Males 18+ that ever had anal sex with a woman (%)
Sexual Behavior - Males 18+ that ever had any sex with a man (%)
Sexual Behavior - Females 18+ that ever had vaginal sex with a man (%)
Sexual Behavior - Females 18+ that ever performed oral sex on a man (%)
Sexual Behavior - Females 18+ that ever had anal sex with a man (%)
Sexual Behavior - Females 18+ that ever had any kind of sex with a woman (%)
Sexual Behavior - Average age people first had sex
Sexual Behavior - Average number of female sex partners in lifetime (males 18+)
Sexual Behavior - Average number of female vaginal sex partners in lifetime (males 18+)
Sexual Behavior - Average age people first performed oral sex on a woman (18+)
Sexual Behavior - Average number of woman performed oral sex on in lifetime (18+)
Sexual Behavior - Average number of male sex partners in lifetime (males 18+)
Sexual Behavior - Average number of male anal sex partners in lifetime (males 18+)
Sexual Behavior - Average age people first performed oral sex on a man (18+)
Sexual Behavior - Average number of male oral sex partners in lifetime (18+)
Sexual Behavior - People using protection when performing oral sex (%)
Sexual Behavior - Average number of times people have vaginal or anal sex a year
Sexual Behavior - People having sex without condom (%)
Sexual Behavior - Average number of male sex partners in lifetime (females 18+)
Sexual Behavior - Average number of male vaginal sex partners in lifetime (females 18+)
Sexual Behavior - Average number of female sex partners in lifetime (females 18+)
Sexual Behavior - Circumcised males 18+ (%)
Sleep Disorders - Average hours sleeping at night
Sleep Disorders - People that has trouble sleeping (%)
Smoking-Cigarette Use - People smoking cigarettes (%)
Taste & Smell - People 40+ having problems with smell (%)
Taste & Smell - People 40+ having problems with taste (%)
Taste & Smell - People 40+ that ever had wisdom teeth removed (%)
Taste & Smell - People 40+ that ever had tonsils teeth removed (%)
Taste & Smell - People 40+ that ever had a loss of consciousness because of a head injury (%)
Taste & Smell - People 40+ that ever had a broken nose or other serious injury to face or skull (%)
Taste & Smell - People 40+ that ever had two or more sinus infections (%)
Weight - Average height (inches)
Weight - Average weight (pounds)
Weight - Average BMI
Weight - People that are obese (%)
Weight - People that ever were obese (%)
Weight - People trying to lose weight (%)
100%
urban population.
Estimated median house/condo value in 2022: $273,433
75043:
$273,433Texas:
$275,400
According to our research of Texas and other state lists, there were 115 registered sex offenders living in 75043 zip code as of May 11, 2024 . The ratio of all residents to sex offenders in zip code 75043 is 529 to 1.The ratio of registered sex offenders to all residents in this zip code is near the state average.
Median resident age: This zip code:
35.7 yearsTexas median age:
35.6 years
Average household size: This zip code:
2.8 peopleTexas:
2.6 people
Averages for the 2020 tax year for zip code 75043, filed in 2021:
Average Adjusted Gross Income (AGI) in 2020: $50,780 (Individual Income Tax Returns) Here:
$50,780State:
$77,054
Salary/wage: $46,030 (reported on 83.3% of returns )Here:
$46,030State:
$62,766
(% of AGI for various income ranges: 1236.3% for AGIs below $25k , 3706.8% for AGIs $25k-50k , 6646.0% for AGIs $50k-75k , 9831.1% for AGIs $75k-100k , 17068.8% for AGIs $100k-200k , 54232.4% for AGIs over 200k ) Taxable interest for individuals: $1,488 (reported on 14.8% of returns )This zip code:
$1,488Texas:
$2,665
(% of AGI for various income ranges: 6.9% for AGIs below $25k , 7.2% for AGIs $25k-50k , 23.9% for AGIs $50k-75k , 31.1% for AGIs $75k-100k , 78.4% for AGIs $100k-200k , 1662.4% for AGIs over 200k ) Ordinary dividends: $4,049 (reported on 9.4% of returns )(% of AGI for various income ranges: 10.3% for AGIs below $25k , 14.3% for AGIs $25k-50k , 39.7% for AGIs $50k-75k , 51.8% for AGIs $75k-100k , 173.7% for AGIs $100k-200k , 2487.6% for AGIs over 200k ) Net capital gain/loss in AGI: +$9,976 (reported on 9.1% of returns )Here:
+$9,976State:
+$39,590
(% of AGI for various income ranges: 2.1% for AGIs below $25k , 11.8% for AGIs $25k-50k , 46.9% for AGIs $50k-75k , 103.7% for AGIs $75k-100k , 366.1% for AGIs $100k-200k , 9730.0% for AGIs over 200k ) Profit/loss from business: +$8,078 (reported on 22.8% of returns )Here:
+$8,078State:
+$10,888
(% of AGI for various income ranges: 163.5% for AGIs below $25k , 167.2% for AGIs $25k-50k , 226.0% for AGIs $50k-75k , 367.1% for AGIs $75k-100k , 462.9% for AGIs $100k-200k , 4646.5% for AGIs over 200k ) Taxable individual retirement arrangement distribution: $19,153 (reported on 6.1% of returns )75043:
$19,153Texas:
$24,740
(% of AGI for various income ranges: 32.5% for AGIs below $25k , 59.3% for AGIs $25k-50k , 150.2% for AGIs $50k-75k , 319.4% for AGIs $75k-100k , 661.1% for AGIs $100k-200k , 3568.8% for AGIs over 200k ) Self-employed (Keogh) retirement plans: $15,700 (reported on 0.1% of returns )75043:
$15,700Texas:
$29,298
(% of AGI for various income ranges: 35.5% for AGIs $100k-200k ) Total itemized deductions: $31,524 (reported on 6.0% of returns )Here:
$31,524State:
$40,428
(% of AGI for various income ranges: 28.4% for AGIs below $25k , 117.7% for AGIs $25k-50k , 302.4% for AGIs $50k-75k , 502.2% for AGIs $75k-100k , 932.0% for AGIs $100k-200k , 6622.9% for AGIs over 200k ) Charity contributions: $10,456 (reported on 4.9% of returns )Here:
$10,456State:
$18,201
(% of AGI for various income ranges: 3.2% for AGIs below $25k , 21.2% for AGIs $25k-50k , 67.0% for AGIs $50k-75k , 138.2% for AGIs $75k-100k , 306.2% for AGIs $100k-200k , 2134.7% for AGIs over 200k ) Taxes paid: $6,776 (reported on 5.9% of returns )(% of AGI for various income ranges: 4.6% for AGIs below $25k , 25.4% for AGIs $25k-50k , 69.8% for AGIs $50k-75k , 120.8% for AGIs $75k-100k , 229.6% for AGIs $100k-200k , 847.6% for AGIs over 200k ) Earned income credit: $2,485 (reported on 22.1% of returns )(% of AGI for various income ranges: 126.4% for AGIs below $25k , 82.9% for AGIs $25k-50k , 1.5% for AGIs $50k-75k ) Percentage of individuals using paid preparers for their 2020 taxes: 90.1%(% for various income ranges: 88.8% for AGIs below $25k , 91.1% for AGIs $25k-50k , 90.8% for AGIs $50k-75k , 90.3% for AGIs $75k-100k , 90.4% for AGIs $100k-200k , 92.3% for AGIs over 200k )
Averages for the 2012 tax year for zip code 75043, filed in 2013:
Average Adjusted Gross Income (AGI) in 2012: $45,090 (Individual Income Tax Returns) Here:
$45,090State:
$65,384
Salary/wage: $41,213 (reported on 86.5% of returns )Here:
$41,213State:
$52,524
(% of AGI for various income ranges: 80.2% for AGIs below $25k , 87.0% for AGIs $25k-50k , 82.5% for AGIs $50k-75k , 78.6% for AGIs $75k-100k , 78.1% for AGIs $100k-200k , 55.4% for AGIs over 200k ) Taxable interest for individuals: $1,315 (reported on 19.0% of returns )This zip code:
$1,315Texas:
$2,372
(% of AGI for various income ranges: 0.6% for AGIs below $25k , 0.3% for AGIs $25k-50k , 0.4% for AGIs $50k-75k , 0.4% for AGIs $75k-100k , 0.5% for AGIs $100k-200k , 1.8% for AGIs over 200k ) Ordinary dividends: $4,294 (reported on 10.5% of returns )(% of AGI for various income ranges: 0.9% for AGIs below $25k , 0.5% for AGIs $25k-50k , 0.6% for AGIs $50k-75k , 0.8% for AGIs $75k-100k , 0.9% for AGIs $100k-200k , 3.6% for AGIs over 200k ) Net capital gain/loss in AGI: +$6,356 (reported on 8.4% of returns )Here:
+$6,356State:
+$35,319
(% of AGI for various income ranges: 0.1% for AGIs $25k-50k , 0.1% for AGIs $50k-75k , 0.4% for AGIs $75k-100k , 0.6% for AGIs $100k-200k , 9.9% for AGIs over 200k ) Profit/loss from business: +$8,393 (reported on 19.2% of returns )Here:
+$8,393State:
+$13,732
(% of AGI for various income ranges: 9.1% for AGIs below $25k , 3.1% for AGIs $25k-50k , 2.5% for AGIs $50k-75k , 2.6% for AGIs $75k-100k , 2.6% for AGIs $100k-200k , 3.8% for AGIs over 200k ) Taxable individual retirement arrangement distribution: $14,579 (reported on 7.7% of returns )75043:
$14,579Texas:
$19,511
(% of AGI for various income ranges: 2.1% for AGIs below $25k , 1.7% for AGIs $25k-50k , 2.3% for AGIs $50k-75k , 3.0% for AGIs $75k-100k , 3.3% for AGIs $100k-200k , 2.3% for AGIs over 200k ) Self-employment retirement plans: $11,760 (reported on 0.2% of returns )75043:
$11,760Texas:
$23,938
Total itemized deductions: $19,087 (23% of AGI, reported on 23.0% of returns )Here:
$19,087State:
$24,724
Here:
23.2% of AGIState:
15.9% of AGI
(% of AGI for various income ranges: 6.8% for AGIs below $25k , 8.5% for AGIs $25k-50k , 11.1% for AGIs $50k-75k , 11.1% for AGIs $75k-100k , 11.2% for AGIs $100k-200k , 8.2% for AGIs over 200k ) Charity contributions: $5,027 (reported on 18.3% of returns )(% of AGI for various income ranges: 0.6% for AGIs below $25k , 1.2% for AGIs $25k-50k , 2.1% for AGIs $50k-75k , 2.5% for AGIs $75k-100k , 2.9% for AGIs $100k-200k , 2.9% for AGIs over 200k ) Taxes paid: $4,635 (reported on 22.4% of returns )(% of AGI for various income ranges: 1.2% for AGIs below $25k , 1.8% for AGIs $25k-50k , 2.5% for AGIs $50k-75k , 2.7% for AGIs $75k-100k , 3.0% for AGIs $100k-200k , 2.1% for AGIs over 200k ) Earned income credit: $2,472 (reported on 24.7% of returns )(% of AGI for various income ranges: 8.7% for AGIs below $25k , 1.4% for AGIs $25k-50k ) Percentage of individuals using paid preparers for their 2012 taxes: 51.0%(% for various income ranges: 51.5% for AGIs below $25k , 49.9% for AGIs $25k-50k , 51.0% for AGIs $50k-75k , 50.0% for AGIs $75k-100k , 51.2% for AGIs $100k-200k , 66.7% for AGIs over 200k )
Averages for the 2004 tax year for zip code 75043, filed in 2005:
Average Adjusted Gross Income (AGI) in 2004: $41,685 (Individual Income Tax Returns) Here:
$41,685State:
$47,881
Salary/wage: $39,587 (reported on 88.2% of returns )Here:
$39,587State:
$41,947
(% of AGI for various income ranges: 128.9% for AGIs below $10k , 85.0% for AGIs $10k-25k , 88.8% for AGIs $25k-50k , 84.9% for AGIs $50k-75k , 85.0% for AGIs $75k-100k , 74.8% for AGIs over 100k ) Taxable interest for individuals: $1,308 (reported on 30.6% of returns )This zip code:
$1,308Texas:
$2,255
(% of AGI for various income ranges: 3.6% for AGIs below $10k , 1.2% for AGIs $10k-25k , 0.7% for AGIs $25k-50k , 0.9% for AGIs $50k-75k , 0.7% for AGIs $75k-100k , 1.1% for AGIs over 100k ) Taxable dividends: $2,123 (reported on 15.0% of returns )(% of AGI for various income ranges: 3.2% for AGIs below $10k , 0.7% for AGIs $10k-25k , 0.4% for AGIs $25k-50k , 0.5% for AGIs $50k-75k , 0.6% for AGIs $75k-100k , 1.2% for AGIs over 100k ) Net capital gain/loss: +$4,058 (reported on 12.1% of returns )Here:
+$4,058State:
+$16,110
(% of AGI for various income ranges: -1.6% for AGIs below $10k , -0.2% for AGIs $10k-25k , 0.1% for AGIs $25k-50k , 0.4% for AGIs $50k-75k , 0.8% for AGIs $75k-100k , 3.6% for AGIs over 100k ) Profit/loss from business: +$9,464 (reported on 17.2% of returns )Here:
+$9,464State:
+$11,013
(% of AGI for various income ranges: 4.3% for AGIs below $10k , 5.7% for AGIs $10k-25k , 2.4% for AGIs $25k-50k , 2.4% for AGIs $50k-75k , 3.3% for AGIs $75k-100k , 6.1% for AGIs over 100k ) IRA payment deduction: $3,020 (reported on 2.0% of returns )(% of AGI for various income ranges: 0.2% for AGIs below $10k , 0.1% for AGIs $10k-25k , 0.2% for AGIs $25k-50k , 0.1% for AGIs $50k-75k , 0.2% for AGIs $75k-100k , 0.1% for AGIs over 100k ) Self-employed pension: $11,010 (reported on 0.4% of returns )Here:
$11,010Texas:
$16,401
(% of AGI for various income ranges: 0.1% for AGIs $25k-50k , 0.0% for AGIs $50k-75k , 0.1% for AGIs $75k-100k , 0.3% for AGIs over 100k ) Total itemized deductions: $16,318 (23% of AGI, reported on 31.3% of returns )Here:
$16,318State:
$19,631
Here:
23.2% of AGIState:
18.9% of AGI
(% of AGI for various income ranges: 12.7% for AGIs below $10k , 8.8% for AGIs $10k-25k , 11.8% for AGIs $25k-50k , 14.3% for AGIs $50k-75k , 13.9% for AGIs $75k-100k , 11.5% for AGIs over 100k ) Charity contributions deductions: $3,865 (5% of AGI, reported on 26.0% of returns )Here:
5.2% of AGIState:
4.2% of AGI
(% of AGI for various income ranges: 0.7% for AGIs below $10k , 1.0% for AGIs $10k-25k , 1.8% for AGIs $25k-50k , 2.6% for AGIs $50k-75k , 2.6% for AGIs $75k-100k , 3.3% for AGIs over 100k ) Total tax: $6,045 (reported on 72.1% of returns )(% of AGI for various income ranges: 4.5% for AGIs below $10k , 3.7% for AGIs $10k-25k , 6.3% for AGIs $25k-50k , 9.1% for AGIs $50k-75k , 10.9% for AGIs $75k-100k , 17.8% for AGIs over 100k ) Earned income credit: $1,877 (reported on 19.8% of returns )Percentage of individuals using paid preparers for their 2004 taxes: 53.1%(% for various income ranges: 46.1% for AGIs below $10k , 59.6% for AGIs $10k-25k , 54.5% for AGIs $25k-50k , 50.8% for AGIs $50k-75k , 48.5% for AGIs $75k-100k , 52.2% for AGIs over 100k )
Estimated median household income in 2022: This zip code:
$71,338Texas:
$72,284
Nearest zip codes: 75088 ,
75182 ,
75150 ,
75041 ,
75089 ,
75040 .
Mesquite Zip Code Map
Percentage of family households: This zip code:
55.2%Texas:
50.5%
Percentage of households with unmarried partners: This zip code:
5.9%Texas:
48.7%
Likely homosexual households (counted as self-reported same-sex unmarried-partner households)
Lesbian couples: 0.1% of all households Gay men: 0.1% of all households
Household received Food Stamps/SNAP in the past 12 months: 2,302Household did not receive Food Stamps/SNAP in the past 12 months: 20,953
Women who had a birth in the past 12 months: 583 (316 now married , 261 unmarried) Women who did not have a birth in the past 12 months: 15,281 (5,916 now married , 9,390 unmarried)
Housing units in zip code 75043 with a mortgage: 8,803 (307
second mortgage , 19
home equity loan , 226
both second mortgage and home equity loan )
Houses without a mortgage: 118
Median monthly owner costs for units with a mortgage: $1,866
Median monthly owner costs for units without a mortgage: $746
Residents with income below the poverty level in 2022:
This zip code:
10.7%Whole state:
14.0%
Residents with income below 50% of the poverty level in 2022:
This zip code:
4.5%Whole state:
7.4%
Median number of rooms in houses and condos: Median number of rooms in apartments: Notable locations in this zip code not listed on our city pages
Click to draw/clear zip code borders Notable locations in zip code 75043: (A) , Eastern Hills Golf Course (B) , Garland Fire Department Station 5 (C) , Garland Fire Department Station 4 (D) , Lifetime Emergency Medical Services (E) . Display/hide their locations on the map
Shopping Center: (1) . Display/hide its location on the map
Churches in zip code 75043 include: (A) , West Lake Community Church (B) , South Garland Baptist Church (C) , Church of Christ (D) , Saint Thomas Aquinas Catholic Church (E) , Church of Christ Robin Road (F) , Eastern Hills Church of Christ (G) , New Jerusalem Church of God (H) , Holy Trinity Episcopal Church (I) . Display/hide their locations on the map
Creek: (A) . Display/hide its location on the map
Parks in zip code 75043 include: (1) , Ross Park (2) , Rosehill Park (3) , Oaks Branch Park (4) , O'Banion Park (5) , Troth Abion Park (6) , Carter Softball Complex at Audubon Park (7) , Audubon Park Recreation Center (8) , Gatewood Park (9) . Display/hide their locations on the map
Year house built (houses)
169 2020 or later1,562 2010 to 20192,572 2000 to 20091,826 1990 to 19995,759 1980 to 19898,673 1970 to 19791,585 1960 to 1969428 1950 to 1959190 1940 to 1949123 1939 or earlier
Zip code 75043 household income distribution in 2022 1,122 Less than $10,000688 $10,000 to $14,999447 $15,000 to $19,999558 $20,000 to $24,999688 $25,000 to $29,999857 $30,000 to $34,9991,145 $35,000 to $39,9991,605 $40,000 to $44,999698 $45,000 to $49,9991,550 $50,000 to $59,9992,973 $60,000 to $74,9993,776 $75,000 to $99,9992,220 $100,000 to $124,9991,793 $125,000 to $149,9991,878 $150,000 to $199,9991,323 $200,000 or moreEstimate of home value of owner-occupied houses/condos in 2022 in zip code 75043 251 Less than $10,00031 $10,000 to $14,99928 $15,000 to $19,99938 $20,000 to $24,9993 $25,000 to $29,99910 $30,000 to $34,99911 $35,000 to $39,99942 $50,000 to $59,9993 $60,000 to $69,99939 $70,000 to $79,99965 $80,000 to $89,99941 $90,000 to $99,999319 $100,000 to $124,999514 $125,000 to $149,9991,288 $150,000 to $174,9991,459 $175,000 to $199,9992,386 $200,000 to $249,9992,986 $250,000 to $299,9992,528 $300,000 to $399,999844 $400,000 to $499,999403 $500,000 to $749,99936 $750,000 to $999,99930 $1,000,000 to $1,499,99953 $2,000,000 or moreRent paid by renters in 2022 in zip code 75043 23 Less than $10092 $150 to $19955 $200 to $24945 $300 to $3497 $350 to $39944 $550 to $59972 $600 to $64916 $650 to $69949 $700 to $749157 $750 to $799785 $800 to $8991,068 $900 to $9992,688 $1,000 to $1,2491,964 $1,250 to $1,4991,600 $1,500 to $1,999367 $2,000 to $2,499173 $2,500 to $2,99995 $3,500 or more68 No cash rent
Median gross rent in 2022: $1,443.
Median price asked for vacant for-sale houses and condos in 2022: $271,317.
Estimated median house (or condo) value in 2022 for: White Non-Hispanic householders: $282,819Black or African American householders: $278,580American Indian or Alaska Native householders: $247,694Asian householders: $287,664Some other race householders: $240,124Two or more races householders: $264,348Hispanic or Latino householders: $244,666Estimated median house or condo value in 2022: $273,433
75043:
$273,433Texas:
$275,400
Lower value quartile - upper value quartile: $209,519 - $338,186
Mean price in 2022: Detached houses: $315,629Here:
$315,629State:
$369,058
Townhouses or other attached units: $200,387Here:
$200,387State:
$327,631
In 3-to-4-unit structures: $93,677Here:
$93,677State:
$209,652
In 5-or-more-unit structures: $173,077Here:
$173,077State:
$413,944
Mobile homes: $106,510Here:
$106,510State:
$124,413
Housing units in structures:
One, detached: 15,474One, attached: 1,405Two: 603 or 4: 1,0655 to 9: 1,64810 to 19: 2,21220 to 49: 70150 or more: 1,668Mobile homes: 23Unemployment : 5.5%
Means of transportation to work in zip code 75043 70.4% 23,243 Drove a car alone12.7% 4,183 Carpooled1.9% 623 Bus or trolley bus0.0% 8 Streetcar or trolley car0.1% 27 Subway or elevated0.5% 171 Railroad0.1% 32 Motorcycle0.5% 165 Walked1.7% 562 Other means11.2% 3,691 Worked at homeTravel time to work (commute) in zip code 75043 260 Less than 5 minutes699 5 to 9 minutes2,113 10 to 14 minutes3,410 15 to 19 minutes4,213 20 to 24 minutes1,744 25 to 29 minutes6,959 30 to 34 minutes1,058 35 to 39 minutes1,755 40 to 44 minutes3,939 45 to 59 minutes2,244 60 to 89 minutes607 90 or more minutes
Neighborhoods in zip code 75043: Percentage of zip code residents living and working in this county: 81.3%
Household type by relationship:
Households: 66,024
Male householders: 11,146 (1,659 living alone ), Female householders: 12,143 (3,051 living alone )10,721 spouses (10,675 opposite-sex spouses ), 1,600 unmarried partners , (1,533 opposite-sex unmarried partners ), 21,244 children (19,877 natural , 350 adopted , 1,016 stepchildren ), 2,667 grandchildren , 979 brothers or sisters , 2,150 parents , 8 foster children , 1,552 other relatives , 1,489 non-relatives In group quarters: 169 (-1 institutionalized population )
Size of family households: 6,751 2-persons , 3,903 3-persons , 2,920 4-persons , 1,897 5-persons , 685 6-persons , 1,012 7-or-more-persons
Size of nonfamily households: 4,708 1-person , 1,114 2-persons , 187 3-persons , 68 4-persons
8,117 married couples with children. single-parent households (1,621 men , 3,962 women ).
61.4% of residents of 75043 zip code speak English at home. of residents speak Spanish at home (69% very well, 20% well, 9% not well, 2% not at all ).of residents speak other Indo-European language at home (74% very well, 18% well, 7% not well, 1% not at all ).of residents speak Asian or Pacific Island language at home (49% very well, 28% well, 20% not well, 3% not at all ).of residents speak other language at home (76% very well, 19% well, 3% not well, 2% not at all ).
Foreign born population: 15,114 (22.9%)
(44.6%
of them are naturalized citizens )
This zip code:
22.9%Whole state:
17.2%
46% Honduras 11% Bhutan 6% Liberia 4% Malaysia 4% Thailand 3% Costa Rica 3% Guatemala 6% English 5% American 4% African 3% Irish 2% German 1% Norwegian 1% Scottish
Year of entry for the foreign-born population
4,813 2010 or later 4,736 2000 to 2009 3,659 1990 to 1999 3,194 Before 1990
There are
159 Medical Specialists in Zip Code 75043 .
Facilities with environmental interests located in this zip code:
1 HR GARMITZ (6032 BROADWAY BLVD in GARLAND, TX)
(Resource Conservation and Recovery Act (tracking hazardous waste)) Alternative names: ONE HOUR MARTINIZING
ARMADILLO PAINT & BODY (646 E IH 30 in GARLAND, TX)
(Resource Conservation and Recovery Act (tracking hazardous waste)) Business NAICS classification: GENERAL AUTOMOTIVE REPAIR.Organizations: GOODWINBRYAN (CONTACT/OPERATOR)
, FIFIELDKENNETH (CONTACT/OWNER)
AUDUBON DRY CLEANERS (565 WEST GATES DRIVE #166 in GARLAND, TX)
AIR MINOR (AIRS/AFS) Business SIC classification: DRYCLEANING PLANTS, EXCEPT RUG CLEANING
AFCO NO 10233 (3526 SECURITY in GARLAND, TX)
Conditionally Exempt Small Quantity Generators, less than 100 kg/month of hazardous waste (Resource Conservation and Recovery Act (tracking hazardous waste)) - notification Organizations: MICOR ENERGY LLC DBA AFCO (CONTACT/OWNER)
Housing units lacking complete plumbing facilities: 1.0%
Housing units lacking complete kitchen facilities: 2.3%
61.9% Electricity 36.8% Utility gas 0.5% No fuel used
Population in 1990: 46,620. Population change in the 1990s: +6,723 (+14.4%).
Place of birth for U.S.-born residents:
This state: 35,169Northeast: 1,405Midwest: 3,295South: 5,689West: 3,966
50% of the 75043 zip code residents lived in the same house 5 years ago.
Out of people who lived in different houses, 66% lived in this county.
Out of people who lived in different counties, 50% lived in Texas.
89% of the 75043 zip code residents lived in the same house 1 year ago.
Out of people who lived in different houses, 61% moved from this county.
Out of people who lived in different houses, 17% moved from different county within same state.
Out of people who lived in different houses, 18% moved from different state.
Out of people who lived in different houses, 3% moved from abroad.
Private vs. public school enrollment:
Students in private schools in grades 1 to 8 (elementary and middle school): 521
Students in private schools in grades 9 to 12 (high school): 532
Students in private undergraduate colleges: 379
Occupation by median earnings in the past 12 months ($)
87,039 Health diagnosing and treating practitioners and other technical occupations 74,006 Architecture and engineering occupations 66,857 Computer and mathematical occupations 64,815 Business and financial operations occupations 59,222 Management occupations 58,724 Law enforcement workers including supervisors
Companies with federal contracts located in this zip code:
Department of transportation (350 W. Interstate 30 in Garland, tx) in 2 contracts from 2005 to 2006
$180 with Bureau of Prisoners/Federal Prison System for Other Administrative Support Services. Signed on 2005-10-20. Completion date: 2006-09-30.
, same as above. Signed on 2006-09-21. Completion date: 2006-09-30.
Top industries in this zip code by the number of employees in 2005:
Health Care and Social Assistance: Home Health Care Services (500-999 employees: 1 establishment, 100-249 employees: 1 establishment, 50-99 employees: 1 establishment, 20-49 employees: 3 establishments, 10-19 employees: 4 establishments, 5-9 employees: 3 establishments, 1-4 employees: 5 establishments)Accommodation and Food Services: Limited-Service Restaurants (20-49: 12, 10-19: 11, 5-9: 3, 1-4: 8)Accommodation and Food Services: Full-Service Restaurants (100-249: 1, 50-99: 1, 10-19: 4, 1-4: 3)Administrative and Support and Waste Management and Remediation Services: Temporary Help Services (100-249: 1, 50-99: 1, 20-49: 1, 1-4: 4)Health Care and Social Assistance: Child Day Care Services (20-49: 4, 10-19: 1, 5-9: 3, 1-4: 3)Real Estate and Rental and Leasing: Lessors of Residential Buildings and Dwellings (50-99: 1, 10-19: 3, 5-9: 6, 1-4: 6)Other Services (except Public Administration): Religious Organizations (20-49: 2, 10-19: 3, 5-9: 4, 1-4: 13)Administrative and Support and Waste Management and Remediation Services: Professional Employer Organizations (100-249: 1)
People in group quarters in 2010:
29 people in group homes intended for adults
15 people in group homes for juveniles (non-correctional)
People in group quarters in 2000:
267 people in other group homes
76 people in nursing homes
39 people in homes for the mentally retarded
34 people in homes for the physically handicapped
6 people in homes for the mentally ill
3 people in homes or halfway houses for drug/alcohol abuse
Fatal accident statistics in 2014:
Fatal accident count: 5Vehicles involved in fatal accidents: 7Fatal accidents caused by drunken drivers: 2Fatalities: 6Persons involved in fatal accidents: 10Pedestrians involved in fatal accidents: 0
Fatal accident statistics in 2013:
Fatal accident count: 2Vehicles involved in fatal accidents: 3Fatal accidents caused by drunken drivers: 0Fatalities: 2Persons involved in fatal accidents: 5Pedestrians involved in fatal accidents: 1
Home Mortgage Disclosure Act Aggregated Statistics For Year 2009(Based on 9 full and 10 partial tracts) A) FHA, FSA/RHS & VA B) Conventional C) Refinancings D) Home Improvement Loans E) Loans on Dwellings For 5+ Families F) Non-occupant Loans on G) Loans On Manufactured Number Average Value Number Average Value Number Average Value Number Average Value Number Average Value Number Average Value Number Average Value
LOANS ORIGINATED 489 $125,506 287 $111,854 663 $126,929 53 $31,113 2 $1,031,195 87 $81,829 0 $0 APPLICATIONS APPROVED, NOT ACCEPTED 18 $135,971 24 $119,670 78 $123,884 12 $17,494 0 $0 5 $122,510 2 $10,000 APPLICATIONS DENIED 96 $112,180 55 $98,165 394 $115,961 92 $27,675 0 $0 47 $69,040 5 $62,790 APPLICATIONS WITHDRAWN 50 $110,308 32 $122,204 233 $116,955 15 $72,710 0 $0 19 $90,386 0 $0 FILES CLOSED FOR INCOMPLETENESS 18 $108,859 11 $99,245 72 $120,878 3 $48,247 0 $0 4 $99,282 3 $217,513
Aggregated Statistics For Year 2008(Based on 9 full and 10 partial tracts) A) FHA, FSA/RHS & VA B) Conventional C) Refinancings D) Home Improvement Loans E) Loans on Dwellings For 5+ Families F) Non-occupant Loans on G) Loans On Manufactured Number Average Value Number Average Value Number Average Value Number Average Value Number Average Value Number Average Value Number Average Value
LOANS ORIGINATED 360 $120,913 487 $120,913 507 $111,814 155 $23,031 4 $5,732,540 207 $83,258 1 $22,220 APPLICATIONS APPROVED, NOT ACCEPTED 17 $130,841 41 $98,327 93 $105,284 35 $34,679 2 $49,225 16 $69,092 6 $66,203 APPLICATIONS DENIED 92 $112,686 138 $95,965 571 $111,405 275 $35,428 0 $0 101 $84,022 14 $79,566 APPLICATIONS WITHDRAWN 56 $121,028 77 $107,374 232 $116,253 18 $75,092 0 $0 33 $93,615 0 $0 FILES CLOSED FOR INCOMPLETENESS 19 $127,431 26 $120,322 61 $128,959 6 $8,663 0 $0 6 $96,228 0 $0
Aggregated Statistics For Year 2007(Based on 9 full and 10 partial tracts) A) FHA, FSA/RHS & VA B) Conventional C) Refinancings D) Home Improvement Loans E) Loans on Dwellings For 5+ Families F) Non-occupant Loans on G) Loans On Manufactured Number Average Value Number Average Value Number Average Value Number Average Value Number Average Value Number Average Value Number Average Value
LOANS ORIGINATED 234 $118,794 1,147 $111,327 629 $108,631 176 $38,055 5 $3,620,416 252 $88,939 4 $28,070 APPLICATIONS APPROVED, NOT ACCEPTED 6 $144,022 182 $107,491 153 $109,443 58 $32,020 0 $0 33 $70,842 8 $81,382 APPLICATIONS DENIED 43 $124,099 348 $101,605 1,014 $111,597 271 $29,098 0 $0 114 $99,494 9 $73,958 APPLICATIONS WITHDRAWN 14 $106,614 137 $120,646 431 $110,540 43 $45,083 0 $0 32 $92,357 0 $0 FILES CLOSED FOR INCOMPLETENESS 3 $57,970 56 $116,937 106 $123,954 11 $54,815 0 $0 0 $0 0 $0
Aggregated Statistics For Year 2006(Based on 9 full and 10 partial tracts) A) FHA, FSA/RHS & VA B) Conventional C) Refinancings D) Home Improvement Loans E) Loans on Dwellings For 5+ Families F) Non-occupant Loans on G) Loans On Manufactured Number Average Value Number Average Value Number Average Value Number Average Value Number Average Value Number Average Value Number Average Value
LOANS ORIGINATED 200 $116,768 1,891 $88,386 783 $104,670 172 $37,420 10 $3,858,652 415 $71,749 3 $72,517 APPLICATIONS APPROVED, NOT ACCEPTED 11 $140,349 312 $100,086 193 $92,257 50 $26,699 0 $0 61 $70,885 1 $25,000 APPLICATIONS DENIED 27 $130,129 613 $92,276 980 $108,388 322 $33,372 2 $423,225 159 $67,579 5 $64,334 APPLICATIONS WITHDRAWN 33 $115,906 243 $90,778 659 $110,289 36 $57,024 0 $0 61 $67,731 0 $0 FILES CLOSED FOR INCOMPLETENESS 0 $0 75 $102,917 218 $110,612 3 $49,870 0 $0 18 $69,386 0 $0
Aggregated Statistics For Year 2005(Based on 9 full and 10 partial tracts) A) FHA, FSA/RHS & VA B) Conventional C) Refinancings D) Home Improvement Loans E) Loans on Dwellings For 5+ Families F) Non-occupant Loans on G) Loans On Manufactured Number Average Value Number Average Value Number Average Value Number Average Value Number Average Value Number Average Value Number Average Value
LOANS ORIGINATED 247 $114,783 1,840 $86,588 1,309 $98,022 166 $62,451 0 $0 384 $78,236 2 $91,255 APPLICATIONS APPROVED, NOT ACCEPTED 7 $169,016 282 $84,795 247 $98,062 46 $32,254 0 $0 61 $75,426 0 $0 APPLICATIONS DENIED 27 $113,902 630 $88,990 1,297 $100,593 210 $33,155 0 $0 166 $75,412 15 $37,033 APPLICATIONS WITHDRAWN 23 $118,460 286 $102,182 884 $119,061 102 $210,499 0 $0 76 $93,044 0 $0 FILES CLOSED FOR INCOMPLETENESS 5 $103,156 59 $102,483 448 $112,694 2 $43,830 1 $717,120 20 $82,392 0 $0
Aggregated Statistics For Year 2004(Based on 9 full and 10 partial tracts) A) FHA, FSA/RHS & VA B) Conventional C) Refinancings D) Home Improvement Loans F) Non-occupant Loans on G) Loans On Manufactured Number Average Value Number Average Value Number Average Value Number Average Value Number Average Value Number Average Value
LOANS ORIGINATED 390 $116,971 1,732 $94,308 1,873 $95,453 187 $41,871 358 $78,665 4 $47,535 APPLICATIONS APPROVED, NOT ACCEPTED 10 $118,182 342 $91,595 354 $95,299 55 $42,300 57 $83,239 4 $115,330 APPLICATIONS DENIED 72 $104,743 483 $86,347 1,548 $95,368 248 $34,466 104 $76,027 16 $41,509 APPLICATIONS WITHDRAWN 44 $125,803 234 $117,015 898 $98,639 33 $48,482 54 $68,084 2 $84,985 FILES CLOSED FOR INCOMPLETENESS 10 $97,069 105 $90,696 505 $102,455 6 $54,470 23 $75,661 0 $0
Aggregated Statistics For Year 2003(Based on 9 full and 10 partial tracts) A) FHA, FSA/RHS & VA B) Conventional C) Refinancings D) Home Improvement Loans E) Loans on Dwellings For 5+ Families F) Non-occupant Loans on Number Average Value Number Average Value Number Average Value Number Average Value Number Average Value Number Average Value
LOANS ORIGINATED 485 $115,911 1,316 $107,732 3,876 $94,290 156 $38,788 2 $3,680,280 308 $75,772 APPLICATIONS APPROVED, NOT ACCEPTED 16 $119,729 203 $99,727 579 $91,405 77 $45,231 0 $0 63 $92,068 APPLICATIONS DENIED 89 $111,212 363 $85,848 1,672 $89,940 217 $24,688 0 $0 115 $73,962 APPLICATIONS WITHDRAWN 75 $119,017 264 $121,485 1,414 $97,419 22 $37,503 0 $0 42 $87,011 FILES CLOSED FOR INCOMPLETENESS 15 $109,712 97 $96,731 182 $97,202 8 $38,549 0 $0 23 $93,089
Aggregated Statistics For Year 2002(Based on 2 full and 6 partial tracts) A) FHA, FSA/RHS & VA B) Conventional C) Refinancings D) Home Improvement Loans E) Loans on Dwellings For 5+ Families F) Non-occupant Loans on Number Average Value Number Average Value Number Average Value Number Average Value Number Average Value Number Average Value
LOANS ORIGINATED 267 $122,035 620 $121,076 973 $102,831 61 $22,208 2 $406,305 81 $93,874 APPLICATIONS APPROVED, NOT ACCEPTED 13 $139,345 94 $107,239 158 $96,213 29 $40,548 0 $0 12 $96,428 APPLICATIONS DENIED 49 $116,232 180 $99,299 414 $92,863 57 $24,366 0 $0 14 $63,585 APPLICATIONS WITHDRAWN 38 $122,393 158 $132,806 334 $107,178 8 $23,415 0 $0 12 $84,478 FILES CLOSED FOR INCOMPLETENESS 8 $105,204 69 $95,864 104 $95,842 2 $4,985 0 $0 3 $68,267
Aggregated Statistics For Year 2001(Based on 2 full and 6 partial tracts) A) FHA, FSA/RHS & VA B) Conventional C) Refinancings D) Home Improvement Loans E) Loans on Dwellings For 5+ Families F) Non-occupant Loans on Number Average Value Number Average Value Number Average Value Number Average Value Number Average Value Number Average Value
LOANS ORIGINATED 328 $117,513 523 $104,197 597 $94,907 99 $33,371 3 $4,569,023 76 $79,908 APPLICATIONS APPROVED, NOT ACCEPTED 19 $115,333 93 $89,600 106 $102,866 27 $24,101 0 $0 19 $125,281 APPLICATIONS DENIED 33 $110,257 142 $93,794 266 $97,729 105 $16,156 0 $0 12 $44,450 APPLICATIONS WITHDRAWN 61 $124,741 74 $113,625 189 $91,970 18 $29,343 0 $0 9 $58,543 FILES CLOSED FOR INCOMPLETENESS 6 $101,478 62 $86,083 62 $113,022 2 $10,970 0 $0 3 $102,993
Aggregated Statistics For Year 2000(Based on 2 full and 6 partial tracts) A) FHA, FSA/RHS & VA B) Conventional C) Refinancings D) Home Improvement Loans E) Loans on Dwellings For 5+ Families F) Non-occupant Loans on Number Average Value Number Average Value Number Average Value Number Average Value Number Average Value Number Average Value
LOANS ORIGINATED 194 $95,727 447 $97,857 187 $88,221 117 $17,644 3 $1,452,303 35 $48,317 APPLICATIONS APPROVED, NOT ACCEPTED 10 $100,911 75 $85,555 53 $71,301 52 $22,011 0 $0 16 $50,632 APPLICATIONS DENIED 21 $100,790 167 $65,263 117 $73,327 108 $18,213 0 $0 11 $100,125 APPLICATIONS WITHDRAWN 21 $94,398 42 $85,700 102 $82,641 7 $38,751 0 $0 8 $68,859 FILES CLOSED FOR INCOMPLETENESS 3 $92,740 34 $101,142 73 $91,336 2 $4,985 0 $0 5 $41,246
Aggregated Statistics For Year 1999(Based on 2 full and 5 partial tracts) A) FHA, FSA/RHS & VA B) Conventional C) Refinancings D) Home Improvement Loans E) Loans on Dwellings For 5+ Families F) Non-occupant Loans on Number Average Value Number Average Value Number Average Value Number Average Value Number Average Value Number Average Value
LOANS ORIGINATED 336 $87,604 395 $84,836 412 $73,189 122 $18,574 1 $2,210,610 70 $53,745 APPLICATIONS APPROVED, NOT ACCEPTED 13 $89,048 97 $68,863 91 $63,160 63 $15,355 1 $797,320 15 $50,371 APPLICATIONS DENIED 35 $93,196 215 $59,786 157 $68,317 133 $16,986 0 $0 23 $51,550 APPLICATIONS WITHDRAWN 34 $98,075 60 $85,592 166 $78,159 6 $14,565 0 $0 8 $58,058 FILES CLOSED FOR INCOMPLETENESS 9 $85,690 11 $90,867 73 $79,563 3 $15,320 1 $518,670 4 $55,438
Private Mortgage Insurance Companies Aggregated Statistics For Year 2009(Based on 9 full and 10 partial tracts) A) Conventional B) Refinancings C) Non-occupant Loans on Number Average Value Number Average Value Number Average Value
LOANS ORIGINATED 51 $156,284 31 $149,031 0 $0 APPLICATIONS APPROVED, NOT ACCEPTED 15 $119,630 10 $174,500 2 $76,375 APPLICATIONS DENIED 12 $156,772 3 $137,727 0 $0 APPLICATIONS WITHDRAWN 0 $0 2 $97,205 0 $0 FILES CLOSED FOR INCOMPLETENESS 0 $0 0 $0 0 $0
Aggregated Statistics For Year 2008(Based on 9 full and 10 partial tracts) A) Conventional B) Refinancings C) Non-occupant Loans on Number Average Value Number Average Value Number Average Value
LOANS ORIGINATED 206 $134,690 54 $128,866 29 $98,647 APPLICATIONS APPROVED, NOT ACCEPTED 68 $128,794 28 $163,035 11 $79,375 APPLICATIONS DENIED 13 $89,975 6 $115,262 6 $92,163 APPLICATIONS WITHDRAWN 6 $90,043 4 $161,850 0 $0 FILES CLOSED FOR INCOMPLETENESS 1 $108,160 0 $0 0 $0
Aggregated Statistics For Year 2007(Based on 9 full and 10 partial tracts) A) Conventional B) Refinancings C) Non-occupant Loans on Number Average Value Number Average Value Number Average Value
LOANS ORIGINATED 357 $120,128 55 $140,171 34 $90,117 APPLICATIONS APPROVED, NOT ACCEPTED 48 $128,751 16 $161,694 8 $110,560 APPLICATIONS DENIED 10 $151,610 0 $0 1 $35,270 APPLICATIONS WITHDRAWN 11 $100,495 1 $30,570 0 $0 FILES CLOSED FOR INCOMPLETENESS 1 $62,890 0 $0 0 $0
Aggregated Statistics For Year 2006(Based on 9 full and 10 partial tracts) A) Conventional B) Refinancings C) Non-occupant Loans on Number Average Value Number Average Value Number Average Value
LOANS ORIGINATED 208 $110,698 35 $121,886 24 $88,535 APPLICATIONS APPROVED, NOT ACCEPTED 34 $136,956 23 $124,195 4 $89,448 APPLICATIONS DENIED 4 $148,625 1 $89,000 0 $0 APPLICATIONS WITHDRAWN 4 $106,345 0 $0 2 $50,020 FILES CLOSED FOR INCOMPLETENESS 0 $0 0 $0 0 $0
Aggregated Statistics For Year 2005(Based on 9 full and 10 partial tracts) A) Conventional B) Refinancings C) Non-occupant Loans on Number Average Value Number Average Value Number Average Value
LOANS ORIGINATED 182 $115,299 48 $126,444 27 $88,279 APPLICATIONS APPROVED, NOT ACCEPTED 46 $110,552 17 $133,329 4 $85,042 APPLICATIONS DENIED 0 $0 2 $99,800 0 $0 APPLICATIONS WITHDRAWN 10 $90,668 2 $92,980 3 $81,190 FILES CLOSED FOR INCOMPLETENESS 4 $91,410 2 $163,665 0 $0
Aggregated Statistics For Year 2004(Based on 9 full and 10 partial tracts) A) Conventional B) Refinancings C) Non-occupant Loans on Number Average Value Number Average Value Number Average Value
LOANS ORIGINATED 339 $121,466 109 $129,702 59 $92,211 APPLICATIONS APPROVED, NOT ACCEPTED 68 $109,569 37 $128,822 8 $101,455 APPLICATIONS DENIED 4 $139,175 3 $77,520 3 $77,520 APPLICATIONS WITHDRAWN 20 $120,517 6 $158,395 5 $106,894 FILES CLOSED FOR INCOMPLETENESS 17 $134,236 0 $0 1 $96,000
Aggregated Statistics For Year 2003(Based on 9 full and 10 partial tracts) A) Conventional B) Refinancings C) Non-occupant Loans on Number Average Value Number Average Value Number Average Value
LOANS ORIGINATED 361 $132,304 229 $127,019 41 $96,042 APPLICATIONS APPROVED, NOT ACCEPTED 48 $128,792 63 $123,167 7 $70,359 APPLICATIONS DENIED 8 $106,629 0 $0 6 $110,878 APPLICATIONS WITHDRAWN 15 $113,787 13 $150,938 1 $137,490 FILES CLOSED FOR INCOMPLETENESS 2 $84,935 0 $0 0 $0
Aggregated Statistics For Year 2002(Based on 2 full and 6 partial tracts) A) Conventional B) Refinancings C) Non-occupant Loans on Number Average Value Number Average Value Number Average Value
LOANS ORIGINATED 211 $145,254 42 $136,941 21 $110,070 APPLICATIONS APPROVED, NOT ACCEPTED 26 $128,735 17 $159,826 2 $57,715 APPLICATIONS DENIED 6 $146,440 2 $64,820 4 $60,110 APPLICATIONS WITHDRAWN 14 $150,501 1 $188,880 0 $0 FILES CLOSED FOR INCOMPLETENESS 6 $89,135 2 $58,400 0 $0
Aggregated Statistics For Year 2001(Based on 2 full and 6 partial tracts) A) Conventional B) Refinancings C) Non-occupant Loans on Number Average Value Number Average Value Number Average Value
LOANS ORIGINATED 129 $128,682 32 $124,054 13 $63,754 APPLICATIONS APPROVED, NOT ACCEPTED 38 $89,535 5 $122,804 12 $56,492 APPLICATIONS DENIED 0 $0 2 $104,705 0 $0 APPLICATIONS WITHDRAWN 5 $126,318 0 $0 4 $82,488 FILES CLOSED FOR INCOMPLETENESS 2 $110,130 0 $0 2 $110,130
Aggregated Statistics For Year 2000(Based on 2 full and 6 partial tracts) A) Conventional B) Refinancings C) Non-occupant Loans on Number Average Value Number Average Value Number Average Value
LOANS ORIGINATED 134 $110,960 14 $117,225 13 $53,900 APPLICATIONS APPROVED, NOT ACCEPTED 13 $106,075 3 $185,707 0 $0 APPLICATIONS DENIED 7 $85,351 0 $0 0 $0 APPLICATIONS WITHDRAWN 6 $83,487 0 $0 2 $40,045 FILES CLOSED FOR INCOMPLETENESS 0 $0 0 $0 0 $0
Aggregated Statistics For Year 1999(Based on 2 full and 5 partial tracts) A) Conventional B) Refinancings C) Non-occupant Loans on Number Average Value Number Average Value Number Average Value
LOANS ORIGINATED 129 $102,202 41 $96,926 8 $67,145 APPLICATIONS APPROVED, NOT ACCEPTED 10 $109,628 11 $116,525 1 $78,080 APPLICATIONS DENIED 6 $112,837 3 $89,010 1 $99,730 APPLICATIONS WITHDRAWN 5 $108,658 3 $140,610 0 $0 FILES CLOSED FOR INCOMPLETENESS 3 $101,263 4 $99,270 1 $111,490
2002 - 2018 National Fire Incident Reporting System (NFIRS) incidents See full 2006 National Fire Incident Reporting System statistics for zip code 75043, Texas
Most common first names in zip code 75043 among deceased individuals Name Count Lived (average)
James 111 68.7 years Mary 108 79.7 years William 90 71.3 years John 89 72.6 years Robert 89 70.1 years Dorothy 61 76.9 years Charles 48 70.8 years Helen 45 80.9 years Margaret 40 78.3 years David 38 59.8 years
Most common last names in zip code 75043 among deceased individuals Last name Count Lived (average)
Smith 48 70.6 years Davis 35 73.4 years Jones 33 72.7 years Williams 32 72.8 years Johnson 27 69.8 years Anderson 27 75.6 years Brown 26 77.5 years Thomas 25 75.0 years Miller 24 73.1 years Taylor 21 75.0 years
Businesses in zip code 75043
Name Count Name Count
7-Eleven 1 Long John Silver's 1 Albertsons 1 Motel 6 1 AutoZone 1 Nike 1 Best Western 1 Payless 1 Blockbuster 1 Pizza Hut 1 CVS 1 Popeyes 1 Church's Chicken 1 Quiznos 1 DHL 1 RadioShack 1 Dairy Queen 1 SONIC Drive-In 3 Dennys 1 Starbucks 1 FedEx 6 Super 8 3 Foot Locker 1 T-Mobile 3 GNC 1 Taco Bell 1 GameStop 1 U-Haul 1 H&R Block 1 UPS 5 Jack In The Box 1 Waffle House 1 KFC 1 Walgreens 1 Kroger 1 Walmart 2 La Quinta 1 Wendy's 1 Little Caesars Pizza 1
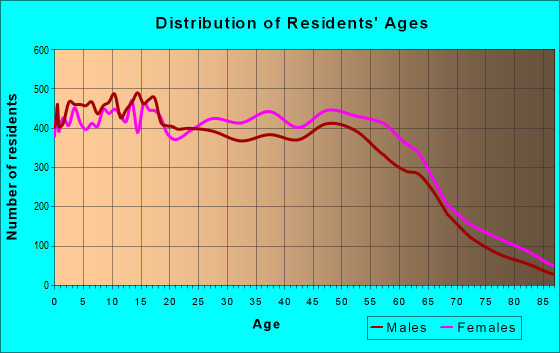
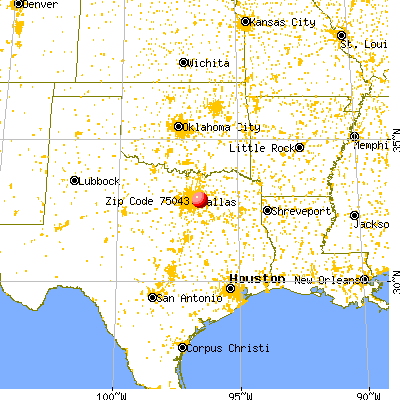


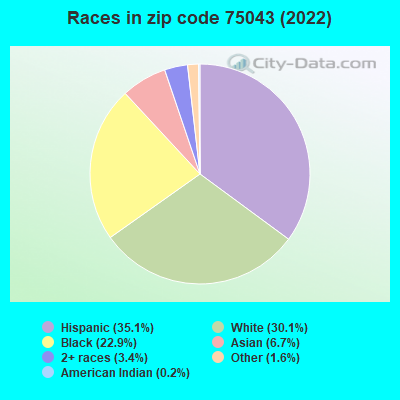


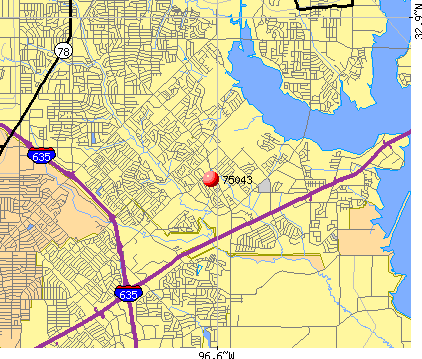 Nearest zip codes: 75088, 75182, 75150, 75041, 75089, 75040.
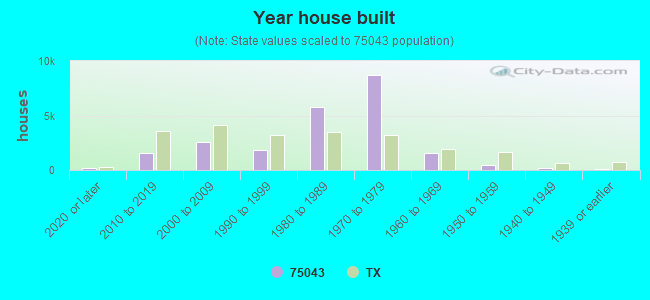
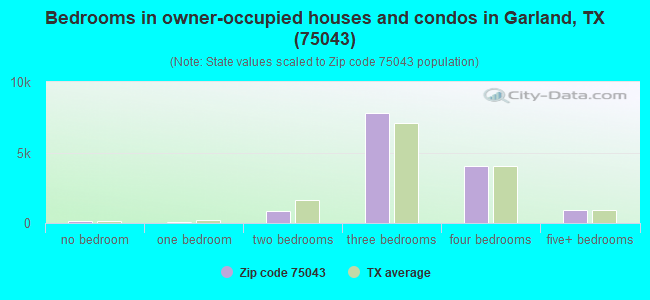
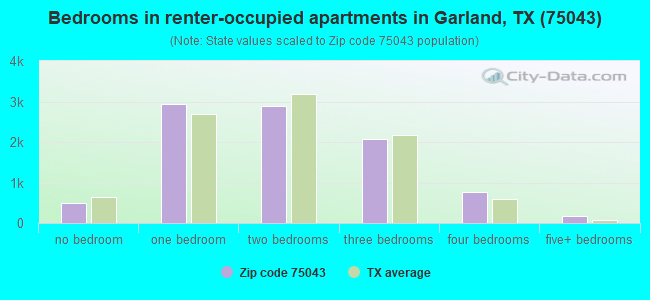
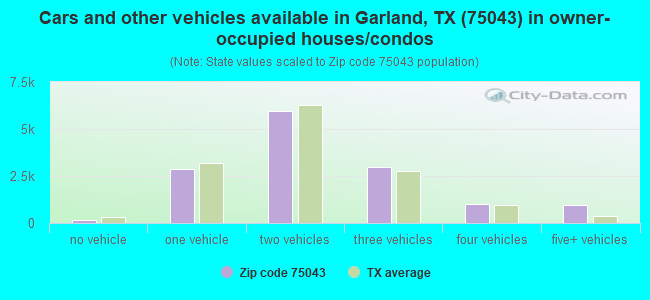
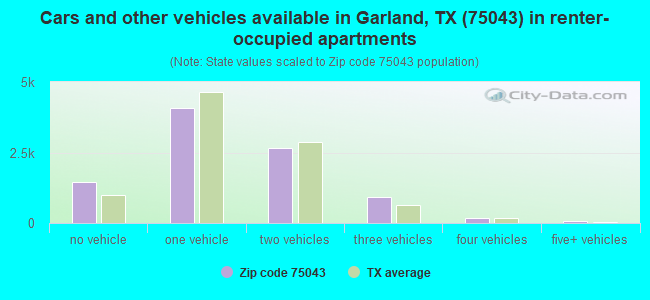


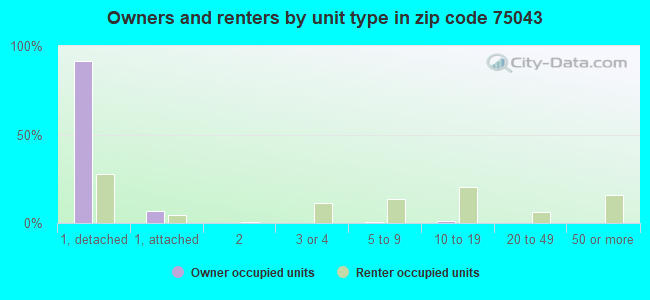
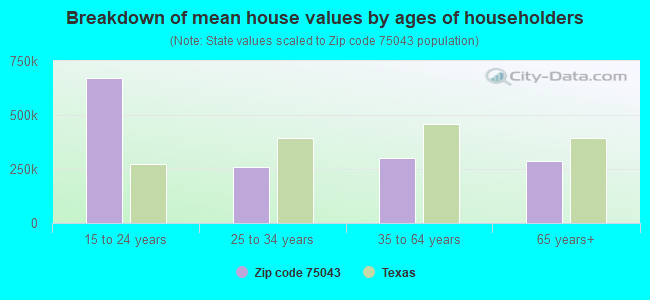


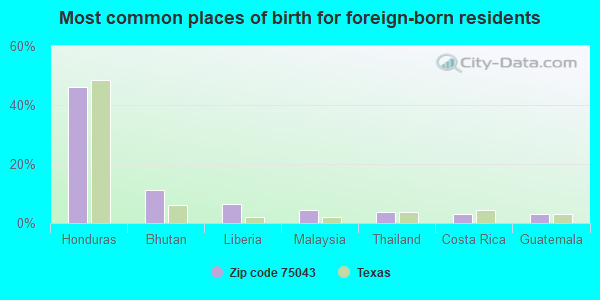
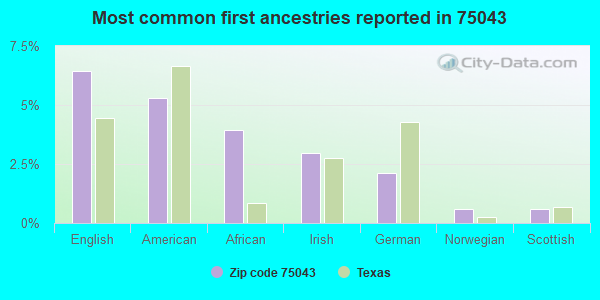
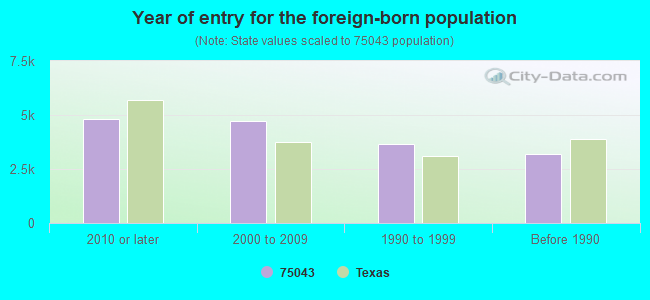
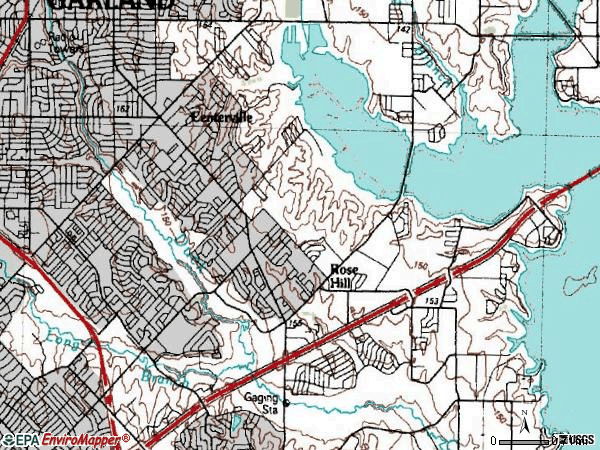

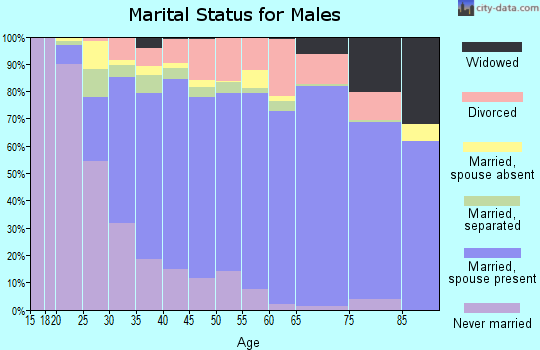
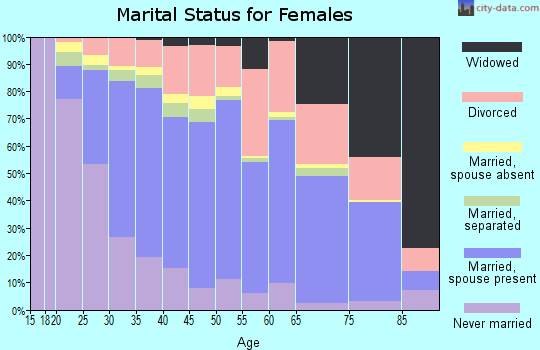
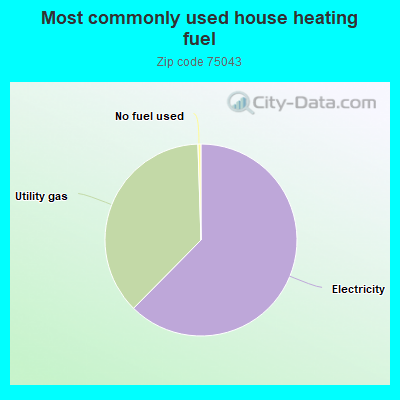
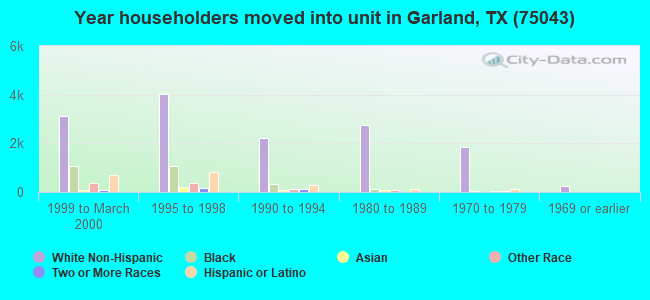
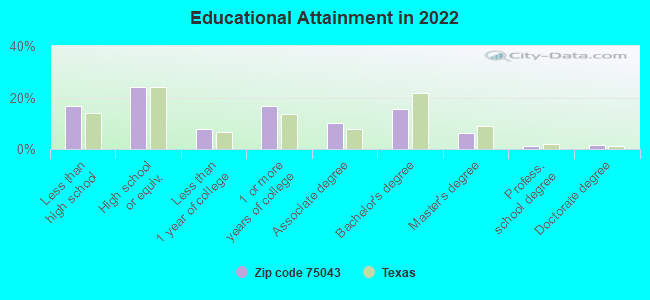
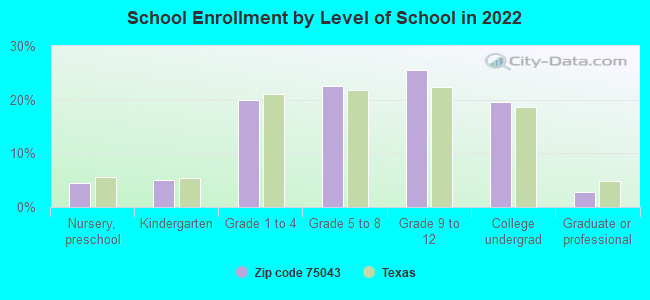
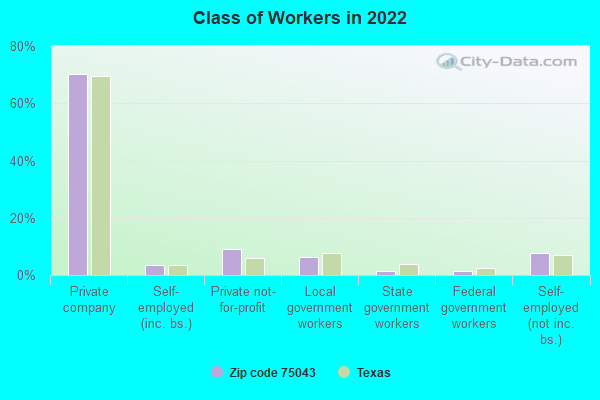
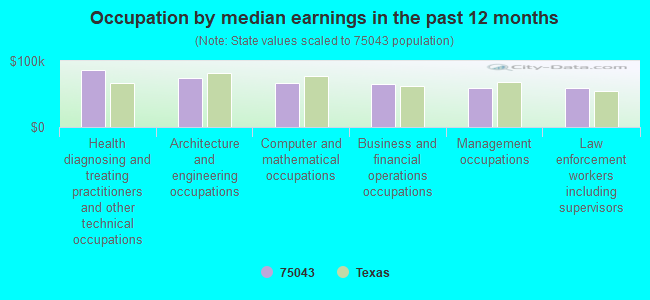
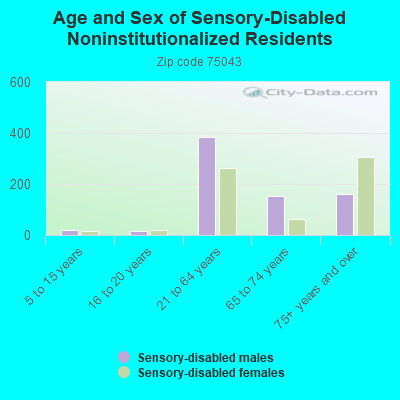
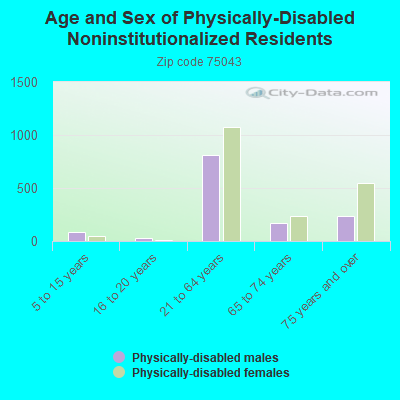
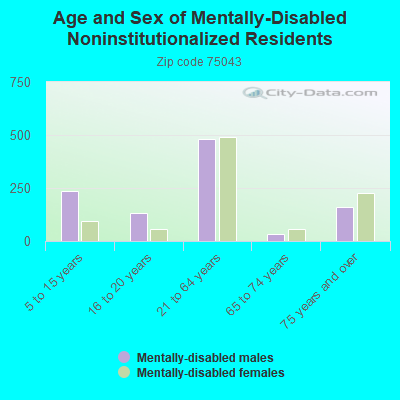
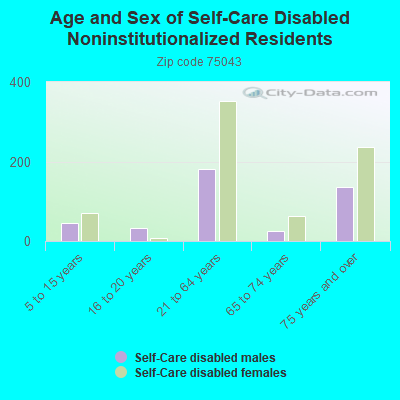
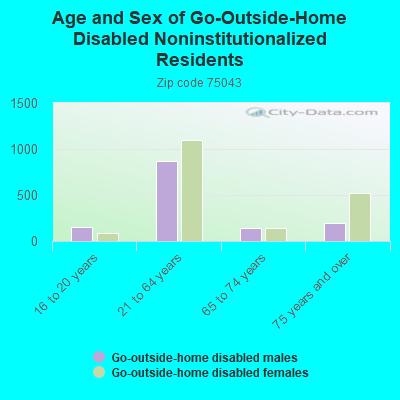
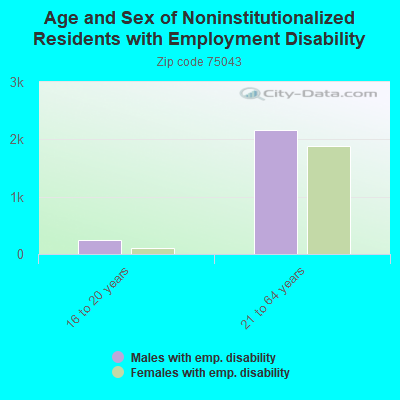
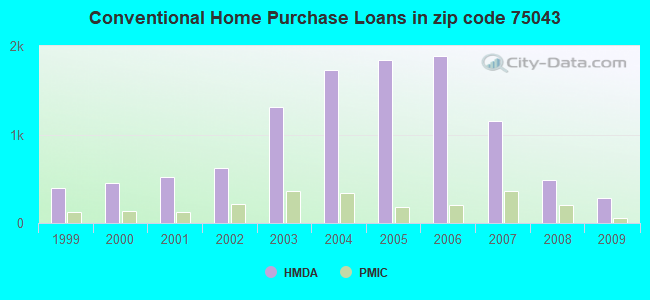
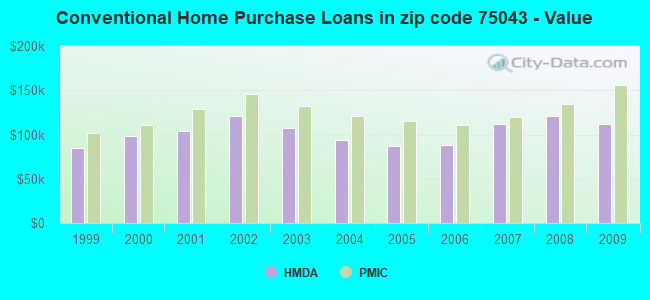
 According to the data from the years 2002 - 2018 the average number of fires per year is 179. The highest number of reported fire incidents - 274 took place in 2006, and the least - 102 in 2009. The data has a declining trend.
 When looking into fire subcategories, the most reports belonged to: Structure Fires (41.8%), and Outside Fires (35.5%).