Estimated zip code population in 2022: 8,084 Zip code population in 2010: 5,118 Zip code population in 2000: 2,703
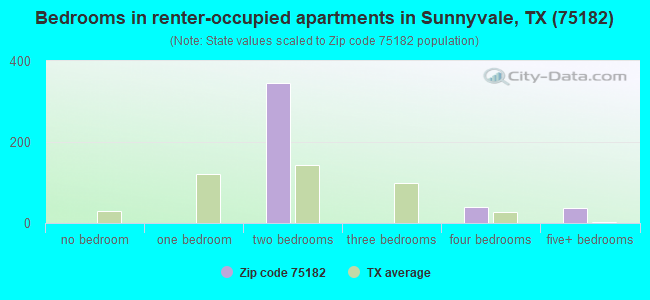
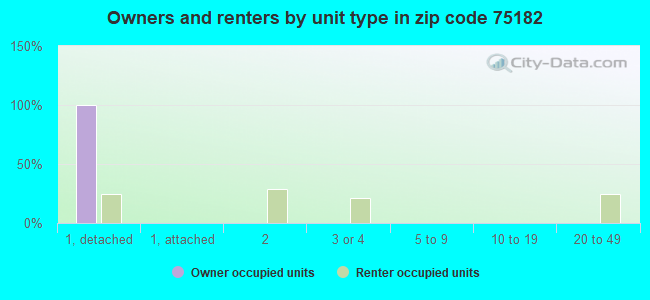
Houses and condos: 2,805 Renter-occupied apartments: 428
% of renters here:
15%
State:
38%
March 2022 cost of living index in zip code 75182: 93.8 (less than average, U.S. average is 100)
Land area: 17.6 sq. mi. Water area: 2.3 sq. mi.
Population density: 460 people per square mile
(low).
OSM Map
General Map
Google Map
MSN Map
OSM Map
General Map
Google Map
MSN Map
OSM Map
General Map
Google Map
MSN Map
OSM Map
General Map
Google Map
MSN Map
Please wait while loading the map...
Real estate property taxes paid for housing units in 2022:
This zip code:
1.7% ($9,537)
Texas:
1.5% ($4,050)
Median real estate property taxes paid for housing units with mortgages in 2022: $10,382 (1.7%) Median real estate property taxes paid for housing units with no mortgage in 2022: $8,896 (1.7%)
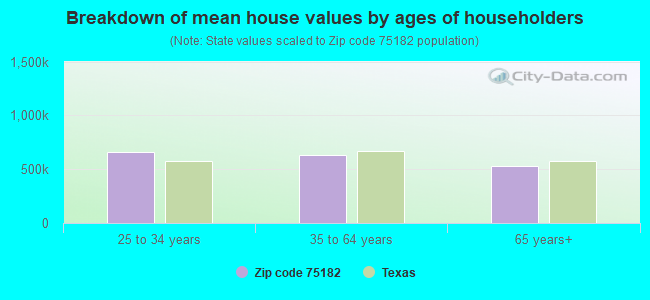
Estimated median house/condo value in 2022: $574,521
75182:
$574,521
Texas:
$275,400
According to our research of Texas and other state lists, there were 4 registered sex offenders living in 75182 zip code as of May 11, 2024. The ratio of all residents to sex offenders in zip code 75182 is 1,489 to 1. The ratio of registered sex offenders to all residents in this zip code is much lower than the state average.
Median resident age:
This zip code:
43.6 years
Texas median age:
35.6 years
Average household size:
This zip code:
2.9 people
Texas:
2.6 people
Averages for the 2020 tax year for zip code 75182, filed in 2021:
Average Adjusted Gross Income (AGI) in 2020: $146,806 (Individual Income Tax Returns)
Here:
$146,806
State:
$77,054
Salary/wage: $112,339 (reported on 82.6% of returns)
Here:
$112,339
State:
$62,766
(% of AGI for various income ranges: 1190.0% for AGIs below $25k, 3800.6% for AGIs $25k-50k, 6517.4% for AGIs $50k-75k, 9271.4% for AGIs $75k-100k, 20906.9% for AGIs $100k-200k, 75934.8% for AGIs over 200k)
Taxable interest for individuals: $3,590 (reported on 40.6% of returns)
This zip code:
$3,590
Texas:
$2,665
(% of AGI for various income ranges: 30.5% for AGIs below $25k, 16.0% for AGIs $25k-50k, 61.3% for AGIs $50k-75k, 150.5% for AGIs $75k-100k, 283.7% for AGIs $100k-200k, 1363.0% for AGIs over 200k)
Ordinary dividends: $6,888 (reported on 29.1% of returns)
Here:
$6,888
State:
$10,044
(% of AGI for various income ranges: 30.0% for AGIs below $25k, 38.0% for AGIs $25k-50k, 154.8% for AGIs $50k-75k, 178.6% for AGIs $75k-100k, 348.8% for AGIs $100k-200k, 1924.3% for AGIs over 200k)
Net capital gain/loss in AGI: +$32,833 (reported on 29.1% of returns)
Here:
+$32,833
State:
+$39,590
(% of AGI for various income ranges: 28.4% for AGIs below $25k, 52.3% for AGIs $25k-50k, 118.3% for AGIs $50k-75k, 296.7% for AGIs $75k-100k, 745.1% for AGIs $100k-200k, 12722.2% for AGIs over 200k)
Profit/loss from business: +$21,919 (reported on 23.2% of returns)
Here:
+$21,919
State:
+$10,888
(% of AGI for various income ranges: 157.3% for AGIs below $25k, 235.7% for AGIs $25k-50k, 229.1% for AGIs $50k-75k, 378.6% for AGIs $75k-100k, 838.0% for AGIs $100k-200k, 4815.2% for AGIs over 200k)
Taxable individual retirement arrangement distribution: $30,162 (reported on 9.0% of returns)
75182:
$30,162
Texas:
$24,740
(% of AGI for various income ranges: 51.6% for AGIs below $25k, 81.4% for AGIs $25k-50k, 167.0% for AGIs $50k-75k, 335.2% for AGIs $75k-100k, 778.8% for AGIs $100k-200k, 1817.0% for AGIs over 200k)
Self-employed (Keogh) retirement plans: $39,375 (reported on 1.1% of returns)
75182:
$39,375
Texas:
$29,298
(% of AGI for various income ranges: 684.8% for AGIs over 200k)
Total itemized deductions: $43,523 (reported on 25.8% of returns)
Here:
$43,523
State:
$40,428
(% of AGI for various income ranges: 415.7% for AGIs $25k-50k, 560.9% for AGIs $50k-75k, 1280.5% for AGIs $75k-100k, 2432.0% for AGIs $100k-200k, 9865.2% for AGIs over 200k)
Charity contributions: $20,598 (reported on 23.2% of returns)
Here:
$20,598
State:
$18,201
(% of AGI for various income ranges: 58.0% for AGIs $25k-50k, 137.0% for AGIs $50k-75k, 382.4% for AGIs $75k-100k, 812.0% for AGIs $100k-200k, 5128.7% for AGIs over 200k)
Taxes paid: $9,140 (reported on 25.8% of returns)
75182:
$9,140
State:
$7,821
(% of AGI for various income ranges: 86.0% for AGIs $25k-50k, 159.6% for AGIs $50k-75k, 314.8% for AGIs $75k-100k, 653.5% for AGIs $100k-200k, 1686.1% for AGIs over 200k)
Earned income credit: $2,262 (reported on 8.1% of returns)
Here:
$2,262
State:
$2,584
(% of AGI for various income ranges: 71.1% for AGIs below $25k, 75.7% for AGIs $25k-50k)
Percentage of individuals using paid preparers for their 2020 taxes: 91.6%
Here:
92%
State:
92%
(% for various income ranges: 89.2% for AGIs below $25k, 89.6% for AGIs $25k-50k, 90.9% for AGIs $50k-75k, 93.5% for AGIs $75k-100k, 93.5% for AGIs $100k-200k, 92.8% for AGIs over 200k)
Averages for the 2012 tax year for zip code 75182, filed in 2013:
Average Adjusted Gross Income (AGI) in 2012: $115,159 (Individual Income Tax Returns)
Here:
$115,159
State:
$65,384
Salary/wage: $95,624 (reported on 83.9% of returns)
Here:
$95,624
State:
$52,524
(% of AGI for various income ranges: 70.3% for AGIs below $25k, 70.3% for AGIs $25k-50k, 70.1% for AGIs $50k-75k, 73.1% for AGIs $75k-100k, 79.7% for AGIs $100k-200k, 61.9% for AGIs over 200k)
Taxable interest for individuals: $2,699 (reported on 49.0% of returns)
This zip code:
$2,699
Texas:
$2,372
(% of AGI for various income ranges: 1.8% for AGIs below $25k, 1.7% for AGIs $25k-50k, 1.6% for AGIs $50k-75k, 1.0% for AGIs $75k-100k, 1.0% for AGIs $100k-200k, 1.1% for AGIs over 200k)
Ordinary dividends: $5,140 (reported on 30.1% of returns)
Here:
$5,140
State:
$9,721
(% of AGI for various income ranges: 3.5% for AGIs below $25k, 1.6% for AGIs $25k-50k, 1.4% for AGIs $50k-75k, 1.0% for AGIs $75k-100k, 0.9% for AGIs $100k-200k, 1.6% for AGIs over 200k)
Net capital gain/loss in AGI: +$9,025 (reported on 27.7% of returns)
Here:
+$9,025
State:
+$35,319
(% of AGI for various income ranges: 0.3% for AGIs $25k-50k, 0.2% for AGIs $50k-75k, 1.5% for AGIs $75k-100k, 1.4% for AGIs $100k-200k, 3.3% for AGIs over 200k)
Profit/loss from business: +$25,203 (reported on 24.1% of returns)
Here:
+$25,203
State:
+$13,732
(% of AGI for various income ranges: 14.3% for AGIs below $25k, 7.9% for AGIs $25k-50k, 7.2% for AGIs $50k-75k, 2.5% for AGIs $75k-100k, 4.7% for AGIs $100k-200k, 5.2% for AGIs over 200k)
Taxable individual retirement arrangement distribution: $25,714 (reported on 11.6% of returns)
75182:
$25,714
Texas:
$19,511
(% of AGI for various income ranges: 4.4% for AGIs below $25k, 3.2% for AGIs $25k-50k, 4.3% for AGIs $50k-75k, 4.4% for AGIs $75k-100k, 2.3% for AGIs $100k-200k, 2.2% for AGIs over 200k)
Self-employment retirement plans: $24,625 (reported on 1.6% of returns)
75182:
$24,625
Texas:
$23,938
(% of AGI for various income ranges: 2.4% for AGIs $50k-75k, 0.5% for AGIs over 200k)
Total itemized deductions: $30,747 (17% of AGI, reported on 53.0% of returns)
Here:
$30,747
State:
$24,724
Here:
17.2% of AGI
State:
15.9% of AGI
(% of AGI for various income ranges: 19.2% for AGIs below $25k, 15.5% for AGIs $25k-50k, 20.2% for AGIs $50k-75k, 19.4% for AGIs $75k-100k, 16.6% for AGIs $100k-200k, 10.6% for AGIs over 200k)
Charity contributions: $9,152 (reported on 48.2% of returns)
Here:
$9,152
State:
$6,808
(% of AGI for various income ranges: 2.2% for AGIs below $25k, 2.5% for AGIs $25k-50k, 4.0% for AGIs $50k-75k, 3.9% for AGIs $75k-100k, 4.2% for AGIs $100k-200k, 3.7% for AGIs over 200k)
Taxes paid: $9,304 (reported on 53.0% of returns)
75182:
$9,304
State:
$6,921
(% of AGI for various income ranges: 5.8% for AGIs below $25k, 4.8% for AGIs $25k-50k, 5.7% for AGIs $50k-75k, 6.0% for AGIs $75k-100k, 5.3% for AGIs $100k-200k, 3.0% for AGIs over 200k)
Earned income credit: $1,952 (reported on 8.4% of returns)
Here:
$1,952
State:
$2,570
(% of AGI for various income ranges: 4.7% for AGIs below $25k, 0.7% for AGIs $25k-50k)
Percentage of individuals using paid preparers for their 2012 taxes: 56.2%
Here:
56%
State:
51%
(% for various income ranges: 48.4% for AGIs below $25k, 50.0% for AGIs $25k-50k, 54.2% for AGIs $50k-75k, 64.0% for AGIs $75k-100k, 60.3% for AGIs $100k-200k, 65.6% for AGIs over 200k)
Averages for the 2004 tax year for zip code 75182, filed in 2005:
Average Adjusted Gross Income (AGI) in 2004: $89,930 (Individual Income Tax Returns)
Here:
$89,930
State:
$47,881
Salary/wage: $74,550 (reported on 81.1% of returns)
Here:
$74,550
State:
$41,947
(% of AGI for various income ranges: 110.3% for AGIs below $10k, 64.9% for AGIs $10k-25k, 70.3% for AGIs $25k-50k, 66.8% for AGIs $50k-75k, 78.8% for AGIs $75k-100k, 64.8% for AGIs over 100k)
Taxable interest for individuals: $3,069 (reported on 61.3% of returns)
This zip code:
$3,069
Texas:
$2,255
(% of AGI for various income ranges: 8.8% for AGIs below $10k, 4.1% for AGIs $10k-25k, 2.9% for AGIs $25k-50k, 3.4% for AGIs $50k-75k, 1.6% for AGIs $75k-100k, 1.8% for AGIs over 100k)
Taxable dividends: $2,706 (reported on 35.5% of returns)
Here:
$2,706
State:
$4,261
(% of AGI for various income ranges: 5.1% for AGIs below $10k, 2.2% for AGIs $10k-25k, 1.6% for AGIs $25k-50k, 1.4% for AGIs $50k-75k, 0.8% for AGIs $75k-100k, 0.9% for AGIs over 100k)
Net capital gain/loss: +$15,872 (reported on 34.7% of returns)
Here:
+$15,872
State:
+$16,110
(% of AGI for various income ranges: -6.7% for AGIs below $10k, 0.8% for AGIs $10k-25k, 0.1% for AGIs $25k-50k, 1.9% for AGIs $50k-75k, 1.0% for AGIs $75k-100k, 8.2% for AGIs over 100k)
Profit/loss from business: +$21,371 (reported on 25.8% of returns)
Here:
+$21,371
State:
+$11,013
(% of AGI for various income ranges: 6.7% for AGIs below $10k, 19.0% for AGIs $10k-25k, 5.9% for AGIs $25k-50k, 6.8% for AGIs $50k-75k, 4.9% for AGIs $75k-100k, 5.8% for AGIs over 100k)
IRA payment deduction: $4,029 (reported on 3.9% of returns)
75182:
$4,029
Texas:
$3,120
Self-employed pension: $16,182 (reported on 1.9% of returns)
Here:
$16,182
Texas:
$16,401
Total itemized deductions: $26,005 (20% of AGI, reported on 51.7% of returns)
Here:
$26,005
State:
$19,631
Here:
20.2% of AGI
State:
18.9% of AGI
(% of AGI for various income ranges: 30.0% for AGIs below $10k, 16.9% for AGIs $10k-25k, 17.1% for AGIs $25k-50k, 22.5% for AGIs $50k-75k, 22.4% for AGIs $75k-100k, 12.5% for AGIs over 100k)
Charity contributions deductions: $6,904 (5% of AGI, reported on 45.2% of returns)
Here:
$6,904
State:
$4,753
Here:
5.2% of AGI
State:
4.2% of AGI
(% of AGI for various income ranges: 1.3% for AGIs below $10k, 2.8% for AGIs $10k-25k, 2.4% for AGIs $25k-50k, 4.1% for AGIs $50k-75k, 4.3% for AGIs $75k-100k, 3.4% for AGIs over 100k)
Total tax: $17,488 (reported on 82.0% of returns)
75182:
$17,488
State:
$9,058
(% of AGI for various income ranges: 5.2% for AGIs below $10k, 6.1% for AGIs $10k-25k, 7.5% for AGIs $25k-50k, 8.8% for AGIs $50k-75k, 9.5% for AGIs $75k-100k, 18.9% for AGIs over 100k)
Earned income credit: $1,702 (reported on 6.8% of returns)
Here:
$1,702
State:
$2,024
Percentage of individuals using paid preparers for their 2004 taxes: 58.4%
Here:
58%
State:
57%
(% for various income ranges: 49.6% for AGIs below $10k, 57.8% for AGIs $10k-25k, 60.9% for AGIs $25k-50k, 65.0% for AGIs $50k-75k, 61.1% for AGIs $75k-100k, 59.6% for AGIs over 100k)
Likely homosexual households (counted as self-reported same-sex unmarried-partner households)
Lesbian couples: 0.0% of all households
Gay men: 0.3% of all households
Household received Food Stamps/SNAP in the past 12 months: 118 Household did not receive Food Stamps/SNAP in the past 12 months: 2,644
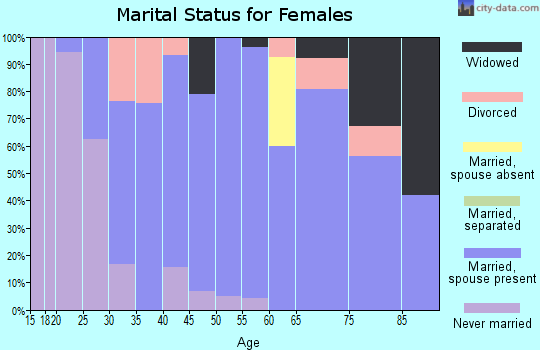
Women who had a birth in the past 12 months: 56 (57 now married, 0 unmarried) Women who did not have a birth in the past 12 months: 1,608 (949 now married, 651 unmarried)
Housing units in zip code 75182 with a mortgage: 1,711 (30 second mortgage, 32 both second mortgage and home equity loan) Median monthly owner costs for units with a mortgage: $3,322 Median monthly owner costs for units without a mortgage: $1,330
Residents with income below the poverty level in 2022:
This zip code:
7.1%
Whole state:
14.0%
Residents with income below 50% of the poverty level in 2022:
This zip code:
6.2%
Whole state:
7.4%
Median number of rooms in houses and condos:
Here:
10.0
State:
6.3
Median number of rooms in apartments:
Here:
4.8
State:
4.0
Notable locations in this zip code not listed on our city pages
Notable locations in zip code 75182: E-S Ranch (A), Sunnyvale Volunteer Fire Department (B), Sunnyvale Fire Department Station 2 (C), Sunnyvale Fire Department Station 3 (D), First Response Emergency Medical Services (E). Display/hide their locations on the map
Churches in zip code 75182 include: Tripp Baptist Church (A), New Covenant Baptist Church (B), Hilltop Church (C), Long Creek Church (D). Display/hide their locations on the map
Size of family households: 1,100 2-persons, 581 3-persons, 645 4-persons, 157 5-persons, 60 6-persons, 24 7-or-more-persons
Size of nonfamily households: 153 1-person, 21 2-persons
1,714 married couples with children.
383 single-parent households (48 men, 335 women).
77.9% of residents of 75182 zip code speak English at home.
3.4% of residents speak Spanish at home (82% very well, 18% not well).
3.8% of residents speak other Indo-European language at home (97% very well, 3% not well).
15.8% of residents speak Asian or Pacific Island language at home (85% very well, 11% well, 3% not well).
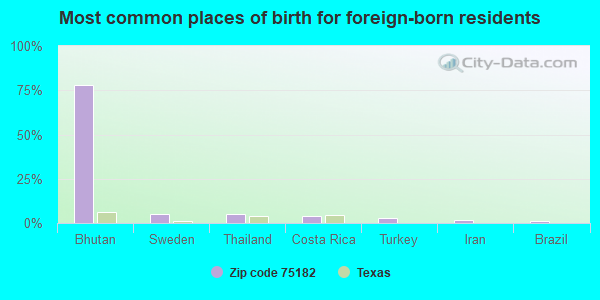
Foreign born population: 1,474 (18.2%) (78.9% of them are naturalized citizens)
This zip code:
18.2%
Whole state:
17.2%
78%Bhutan
5%Sweden
5%Thailand
4%Costa Rica
3%Turkey
2%Iran
1%Brazil
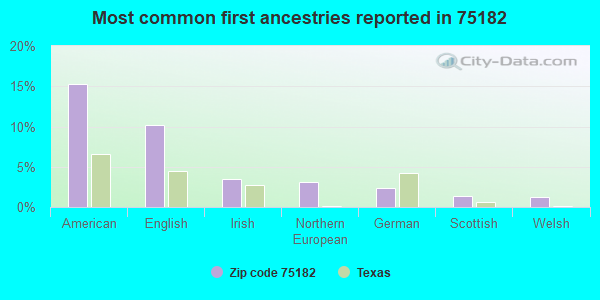
15%American
10%English
4%Irish
3%Northern European
2%German
1%Scottish
1%Welsh
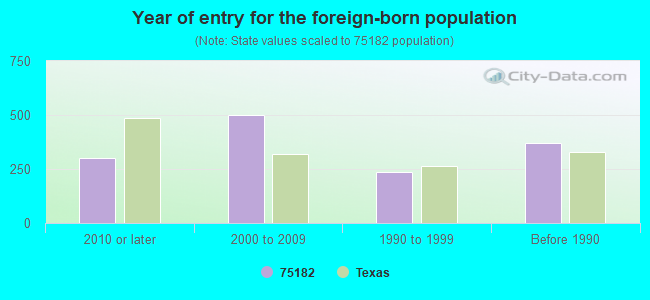
Year of entry for the foreign-born population
3012010 or later
5002000 to 2009
2351990 to 1999
369Before 1990
Facilities with environmental interests located in this zip code:
AMERICAN MARAZZI TILE INC (359 CLAY ROAD in SUNNYVALE, TX)
AIR MAJOR (AIRS/AFS) CRITERIA AND HAZARDOUS AIR POLLUTANT INVENTORY (Inventory of air pollution sources) Conditionally Exempt Small Quantity Generators, less than 100 kg/month of hazardous waste (Resource Conservation and Recovery Act (tracking hazardous waste)) TRI REPORTER (Tracking of toxic chemicals releasing facilities) Business SIC and NAICS classification: CERAMIC WALL AND FLOOR TILE Organizations: MARAZZIFILIPPO (CONTACT/OPERATOR)
ASSOCIATED TRUSS COMPANY (388 S LARKIN RD in SUNNYVALE, TX)
(Resource Conservation and Recovery Act (tracking hazardous waste)) Business NAICS classification: ALL OTHER MISCELLANEOUS WOOD PRODUCT MANUFACTURING. Alternative names: ASSOCIATED TRUSS CO#
APAC TEXAS INC. (999 SCYENE ROAD in SUNNYVALE, TX)
AIR MINOR (AIRS/AFS) Business SIC classification: ASPHALT PAVING MIXTURES AND BLOCKS
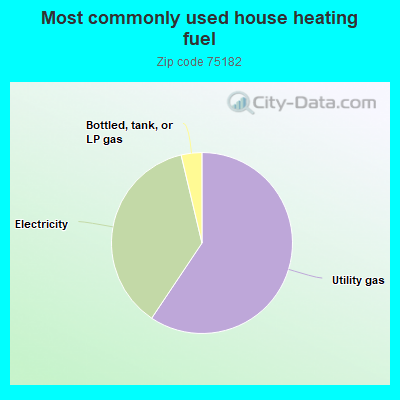
59.4%Utility gas
36.9%Electricity
3.7%Bottled, tank, or LP gas
Population in 1990: 1,959. Population change in the 1990s: +744 (+38.0%).
Place of birth for U.S.-born residents:
This state: 5,036
Northeast: 202
Midwest: 305
South: 551
West: 529
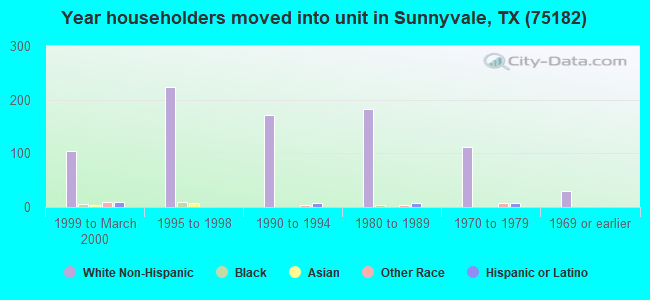
57% of the 75182 zip code residents lived in the same house 5 years ago. Out of people who lived in different houses, 94% lived in this county. Out of people who lived in different counties, 50% lived in Texas.
93% of the 75182 zip code residents lived in the same house 1 year ago. Out of people who lived in different houses, 69% moved from this county. Out of people who lived in different houses, 27% moved from different county within same state. Out of people who lived in different houses, 2% moved from different state.
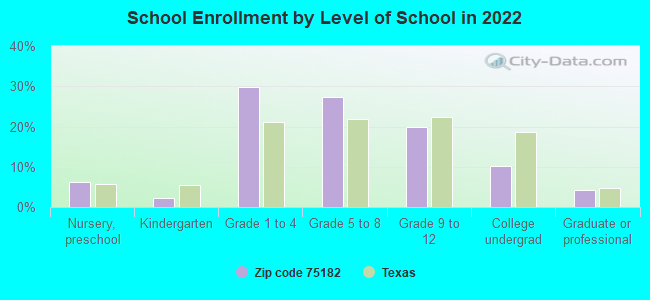
Private vs. public school enrollment:
Students in private schools in grades 1 to 8 (elementary and middle school): 135
Here:
10.2%
Texas:
8.8%
Students in private schools in grades 9 to 12 (high school): 22
Here:
4.9%
Texas:
8.0%
Students in private undergraduate colleges: 27
Here:
11.8%
Texas:
16.2%
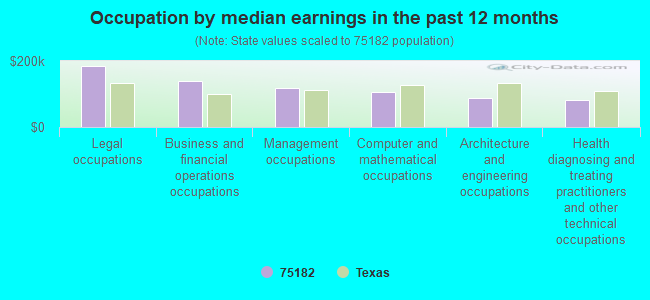
Occupation by median earnings in the past 12 months ($)
184,726Legal occupations
138,991Business and financial operations occupations
118,655Management occupations
106,780Computer and mathematical occupations
87,617Architecture and engineering occupations
83,226Health diagnosing and treating practitioners and other technical occupations
Companies with federal contracts located in this zip code:
TERLESKI JOHN (350 GLORIA RD in MESQUITE, TX; small business) : $340,472 in 8 contractsfrom 2001 to 2005
Contracts for Radio and Television Communication Equipment, Except Airborne, Radio Navigation Equipment, Except Airborne, Antennas, Waveguides, and Related Equipment, Miscellaneous Communication Equipment, and moreby Department of Defense, U.S. Special Operations Command, Navy, Department of State, and others Signed by year:2000: $0; 2001: $147,388; 2002: $0; 2003: $0; 2004: $75,375; 2005: $117,709; 2006: $0.
Biggest contracts:
$147,388 with Department of Defense for Radio and Television Communication Equipment, Except Airborne. Taking place in NC. Signed on 2001-04-25. Completion date: 2001-07-23.
$45,975 with U.S. Special Operations Command for Radio Navigation Equipment, Except Airborne. Taking place in NC. Signed on 2004-08-03. Completion date: 2004-08-31.
$45,810 with Navy for Antennas, Waveguides, and Related Equipment. Signed on 2005-03-27. Completion date: 2005-05-12.
$30,110 with Navy for Miscellaneous Communication Equipment. Taking place in CA. Signed on 2005-07-26. Completion date: 2005-10-03.
Top industries in this zip code by the number of employees in 2005:
Other Services (except Public Administration): Religious Organizations (50-99 employees: 1 establishment, 10-19 employees: 2 establishments, 5-9 employees: 2 establishments, 1-4 employees: 3 establishments)
Health Care and Social Assistance: Child Day Care Services (20-49: 1, 10-19: 3, 1-4: 1)
Fatal accident statistics in 2013:
Fatal accident count: 1
Vehicles involved in fatal accidents: 1
Fatal accidents caused by drunken drivers: 1
Fatalities: 1
Persons involved in fatal accidents: 1
Pedestrians involved in fatal accidents: 0
Fatal accident statistics in 2012:
Fatal accident count: 2
Vehicles involved in fatal accidents: 3
Fatal accidents caused by drunken drivers: 0
Fatalities: 2
Persons involved in fatal accidents: 4
Pedestrians involved in fatal accidents: 0
Home Mortgage Disclosure Act Aggregated Statistics For Year 2009 (Based on 4 partial tracts)
A) FHA, FSA/RHS & VA Home Purchase Loans
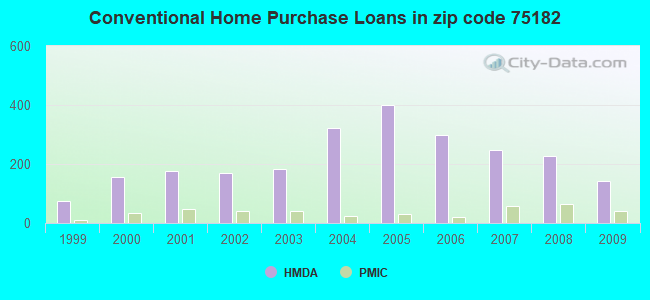
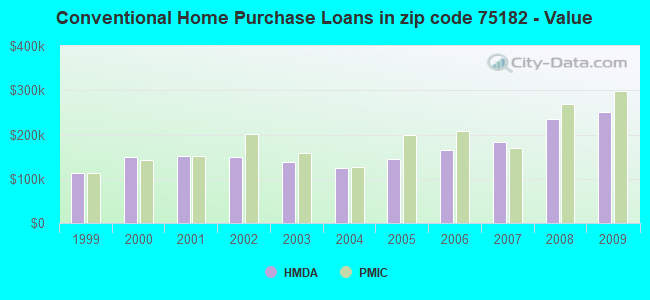
B) Conventional Home Purchase Loans
C) Refinancings
D) Home Improvement Loans
F) Non-occupant Loans on < 5 Family Dwellings (A B C & D)
G) Loans On Manufactured Home Dwelling (A B C & D)
Number
Average Value
Number
Average Value
Number
Average Value
Number
Average Value
Number
Average Value
Number
Average Value
LOANS ORIGINATED
59
$125,971
142
$251,322
248
$207,544
5
$105,612
24
$116,130
0
$0
APPLICATIONS APPROVED, NOT ACCEPTED
1
$74,130
13
$228,118
15
$193,859
0
$0
0
$0
0
$0
APPLICATIONS DENIED
14
$106,747
38
$343,069
106
$243,088
11
$15,064
2
$46,600
2
$29,635
APPLICATIONS WITHDRAWN
19
$204,849
33
$321,946
53
$219,255
5
$105,040
2
$243,665
0
$0
FILES CLOSED FOR INCOMPLETENESS
0
$0
12
$359,052
15
$196,337
4
$79,385
0
$0
0
$0
Aggregated Statistics For Year 2008 (Based on 4 partial tracts)
A) FHA, FSA/RHS & VA Home Purchase Loans
B) Conventional Home Purchase Loans
C) Refinancings
D) Home Improvement Loans
E) Loans on Dwellings For 5+ Families
F) Non-occupant Loans on < 5 Family Dwellings (A B C & D)
G) Loans On Manufactured Home Dwelling (A B C & D)
Number
Average Value
Number
Average Value
Number
Average Value
Number
Average Value
Number
Average Value
Number
Average Value
Number
Average Value
LOANS ORIGINATED
47
$129,071
226
$233,989
124
$189,404
21
$67,827
2
$11,936,400
26
$97,979
0
$0
APPLICATIONS APPROVED, NOT ACCEPTED
6
$194,898
32
$306,581
21
$132,697
3
$67,253
0
$0
0
$0
1
$22,480
APPLICATIONS DENIED
14
$107,119
56
$217,517
105
$166,854
32
$32,868
0
$0
7
$166,340
3
$245,863
APPLICATIONS WITHDRAWN
3
$207,447
46
$246,352
38
$182,325
2
$11,525
0
$0
2
$89,865
0
$0
FILES CLOSED FOR INCOMPLETENESS
1
$74,730
12
$271,996
18
$265,701
4
$23,270
0
$0
0
$0
0
$0
Aggregated Statistics For Year 2007 (Based on 4 partial tracts)
A) FHA, FSA/RHS & VA Home Purchase Loans
B) Conventional Home Purchase Loans
C) Refinancings
D) Home Improvement Loans
E) Loans on Dwellings For 5+ Families
F) Non-occupant Loans on < 5 Family Dwellings (A B C & D)
G) Loans On Manufactured Home Dwelling (A B C & D)
Number
Average Value
Number
Average Value
Number
Average Value
Number
Average Value
Number
Average Value
Number
Average Value
Number
Average Value
LOANS ORIGINATED
33
$110,841
249
$183,403
124
$189,977
42
$56,560
1
$2,430,400
36
$105,585
1
$21,270
APPLICATIONS APPROVED, NOT ACCEPTED
2
$66,680
44
$226,903
29
$190,013
10
$60,913
0
$0
7
$136,819
0
$0
APPLICATIONS DENIED
11
$102,653
61
$235,475
144
$173,072
45
$34,952
0
$0
24
$216,664
1
$100,250
APPLICATIONS WITHDRAWN
6
$154,703
53
$195,182
55
$141,241
6
$90,548
1
$14,157,080
8
$74,046
1
$30,380
FILES CLOSED FOR INCOMPLETENESS
2
$87,260
14
$175,859
17
$167,539
2
$65,855
0
$0
2
$91,690
0
$0
Aggregated Statistics For Year 2006 (Based on 4 partial tracts)
A) FHA, FSA/RHS & VA Home Purchase Loans
B) Conventional Home Purchase Loans
C) Refinancings
D) Home Improvement Loans
F) Non-occupant Loans on < 5 Family Dwellings (A B C & D)
G) Loans On Manufactured Home Dwelling (A B C & D)
Number
Average Value
Number
Average Value
Number
Average Value
Number
Average Value
Number
Average Value
Number
Average Value
LOANS ORIGINATED
19
$128,699
299
$164,026
165
$184,538
27
$51,862
38
$132,125
0
$0
APPLICATIONS APPROVED, NOT ACCEPTED
4
$94,830
36
$173,909
37
$134,758
13
$41,849
10
$75,531
0
$0
APPLICATIONS DENIED
3
$162,713
68
$178,202
141
$127,322
48
$54,202
19
$117,896
2
$82,320
APPLICATIONS WITHDRAWN
1
$111,190
57
$148,564
82
$156,439
9
$243,201
5
$147,050
0
$0
FILES CLOSED FOR INCOMPLETENESS
2
$83,145
9
$226,306
31
$171,865
0
$0
0
$0
0
$0
Aggregated Statistics For Year 2005 (Based on 4 partial tracts)
A) FHA, FSA/RHS & VA Home Purchase Loans
B) Conventional Home Purchase Loans
C) Refinancings
D) Home Improvement Loans
F) Non-occupant Loans on < 5 Family Dwellings (A B C & D)
G) Loans On Manufactured Home Dwelling (A B C & D)
Number
Average Value
Number
Average Value
Number
Average Value
Number
Average Value
Number
Average Value
Number
Average Value
LOANS ORIGINATED
36
$129,044
401
$144,883
188
$186,221
42
$98,274
45
$128,384
1
$12,150
APPLICATIONS APPROVED, NOT ACCEPTED
0
$0
29
$150,961
26
$118,373
16
$33,351
1
$75,950
0
$0
APPLICATIONS DENIED
4
$141,145
92
$124,230
159
$150,209
48
$48,092
17
$127,475
2
$18,110
APPLICATIONS WITHDRAWN
10
$132,427
69
$141,631
138
$166,508
26
$161,019
12
$125,797
0
$0
FILES CLOSED FOR INCOMPLETENESS
0
$0
7
$88,220
40
$134,724
0
$0
0
$0
0
$0
Aggregated Statistics For Year 2004 (Based on 4 partial tracts)
A) FHA, FSA/RHS & VA Home Purchase Loans
B) Conventional Home Purchase Loans
C) Refinancings
D) Home Improvement Loans
F) Non-occupant Loans on < 5 Family Dwellings (A B C & D)
G) Loans On Manufactured Home Dwelling (A B C & D)
Number
Average Value
Number
Average Value
Number
Average Value
Number
Average Value
Number
Average Value
Number
Average Value
LOANS ORIGINATED
49
$102,642
321
$124,398
329
$149,643
39
$52,277
49
$77,116
0
$0
APPLICATIONS APPROVED, NOT ACCEPTED
1
$68,660
44
$141,866
57
$168,326
11
$86,297
8
$65,079
1
$48,000
APPLICATIONS DENIED
5
$125,906
83
$115,871
189
$175,456
27
$33,235
10
$78,635
1
$43,140
APPLICATIONS WITHDRAWN
3
$100,777
44
$167,014
132
$155,838
6
$22,690
4
$69,825
0
$0
FILES CLOSED FOR INCOMPLETENESS
2
$83,965
8
$92,156
89
$179,067
3
$60,367
1
$44,960
0
$0
Aggregated Statistics For Year 2003 (Based on 4 partial tracts)
A) FHA, FSA/RHS & VA Home Purchase Loans
B) Conventional Home Purchase Loans
C) Refinancings
D) Home Improvement Loans
F) Non-occupant Loans on < 5 Family Dwellings (A B C & D)
Number
Average Value
Number
Average Value
Number
Average Value
Number
Average Value
Number
Average Value
LOANS ORIGINATED
40
$101,478
184
$138,502
724
$140,021
30
$40,043
32
$89,333
APPLICATIONS APPROVED, NOT ACCEPTED
1
$82,030
18
$203,535
78
$151,966
19
$80,420
6
$69,688
APPLICATIONS DENIED
10
$102,955
54
$125,668
249
$143,953
38
$25,892
10
$94,784
APPLICATIONS WITHDRAWN
3
$125,917
17
$109,416
180
$140,546
4
$58,090
7
$83,420
FILES CLOSED FOR INCOMPLETENESS
1
$91,750
9
$134,047
27
$112,624
2
$49,390
1
$94,790
Aggregated Statistics For Year 2002 (Based on 2 partial tracts)
A) FHA, FSA/RHS & VA Home Purchase Loans
B) Conventional Home Purchase Loans
C) Refinancings
D) Home Improvement Loans
F) Non-occupant Loans on < 5 Family Dwellings (A B C & D)
Number
Average Value
Number
Average Value
Number
Average Value
Number
Average Value
Number
Average Value
LOANS ORIGINATED
46
$95,527
170
$148,931
328
$149,401
31
$38,876
13
$60,790
APPLICATIONS APPROVED, NOT ACCEPTED
2
$74,910
23
$115,033
33
$122,832
7
$17,404
2
$49,390
APPLICATIONS DENIED
2
$71,620
31
$154,071
112
$160,965
30
$37,703
5
$144,884
APPLICATIONS WITHDRAWN
5
$71,784
48
$180,967
87
$164,167
2
$8,230
0
$0
FILES CLOSED FOR INCOMPLETENESS
2
$83,965
3
$164,640
31
$137,288
0
$0
0
$0
Aggregated Statistics For Year 2001 (Based on 2 partial tracts)
A) FHA, FSA/RHS & VA Home Purchase Loans
B) Conventional Home Purchase Loans
C) Refinancings
D) Home Improvement Loans
F) Non-occupant Loans on < 5 Family Dwellings (A B C & D)
Number
Average Value
Number
Average Value
Number
Average Value
Number
Average Value
Number
Average Value
LOANS ORIGINATED
61
$95,788
175
$151,365
222
$155,444
26
$15,514
2
$89,730
APPLICATIONS APPROVED, NOT ACCEPTED
3
$147,627
31
$112,061
48
$161,793
8
$28,195
2
$42,805
APPLICATIONS DENIED
3
$108,113
31
$157,098
94
$152,380
25
$14,686
5
$84,624
APPLICATIONS WITHDRAWN
3
$114,150
30
$166,232
59
$123,982
5
$49,722
2
$51,860
FILES CLOSED FOR INCOMPLETENESS
0
$0
8
$104,752
21
$270,637
0
$0
3
$68,050
Aggregated Statistics For Year 2000 (Based on 2 partial tracts)
A) FHA, FSA/RHS & VA Home Purchase Loans
B) Conventional Home Purchase Loans
C) Refinancings
D) Home Improvement Loans
F) Non-occupant Loans on < 5 Family Dwellings (A B C & D)
Number
Average Value
Number
Average Value
Number
Average Value
Number
Average Value
Number
Average Value
LOANS ORIGINATED
53
$92,105
155
$149,429
76
$147,678
35
$26,295
8
$91,786
APPLICATIONS APPROVED, NOT ACCEPTED
3
$93,297
33
$161,148
12
$57,487
13
$25,202
2
$46,920
APPLICATIONS DENIED
7
$77,616
35
$123,621
18
$162,262
30
$31,501
0
$0
APPLICATIONS WITHDRAWN
3
$139,397
25
$161,018
26
$94,668
5
$48,734
0
$0
FILES CLOSED FOR INCOMPLETENESS
0
$0
7
$97,373
16
$167,932
0
$0
2
$51,860
Aggregated Statistics For Year 1999 (Based on 2 partial tracts)
A) FHA, FSA/RHS & VA Home Purchase Loans
B) Conventional Home Purchase Loans
C) Refinancings
D) Home Improvement Loans
F) Non-occupant Loans on < 5 Family Dwellings (A B C & D)
Detailed PMIC statistics for the following Tracts:0178.14
, 0181.04
2003 - 2018 National Fire Incident Reporting System (NFIRS) incidents
According to the data from the years 2003 - 2018 the average number of fires per year is 25. The highest number of reported fires - 44 took place in 2011, and the least - 1 in 2006. The data has a rising trend.
When looking into fire subcategories, the most reports belonged to: Outside Fires (54.7%), and Structure Fires (23.9%).
Fire incident types reported to NFIRS in Zip Code 75182

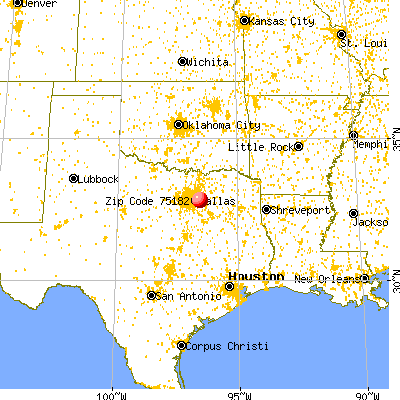


 Nearest zip codes: 75043, 75149, 75181, 75150, 75088, 75126.


 According to the data from the years 2003 - 2018 the average number of fires per year is 25. The highest number of reported fires - 44 took place in 2011, and the least - 1 in 2006. The data has a rising trend.
 When looking into fire subcategories, the most reports belonged to: Outside Fires (54.7%), and Structure Fires (23.9%).