Wilmington, DE (Delaware) Houses and Residents
| Wilmington: | $217,300 |
| Delaware: | $337,200 |
Mean price in 2022:
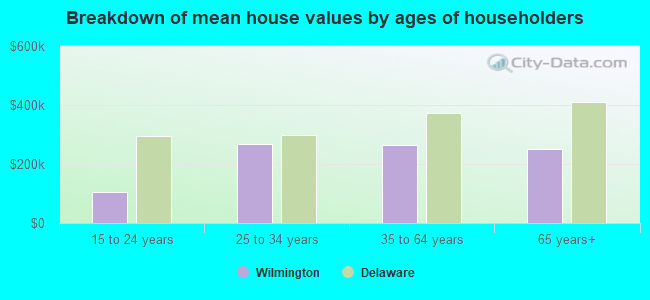
Detached houses: $517,826
Here: $517,826 State: $419,599 Townhouses or other attached units: $248,245
Here: $248,245 State: $291,415 In 2-unit structures: $140,225
Here: $140,225 State: $301,231 In 3-to-4-unit structures: $198,365
Here: $198,365 State: $543,616 In 5-or-more-unit structures: $286,732
Here: $286,732 State: $212,751 Mobile homes: $431,629
Here: $431,629 State: $106,273
Total population: 71,817 (All urban)
Houses: 36,697 (32,239 occupied: 15,037 owner occupied, 17,202 renter occupied)
| % of renters here: | 53% |
| State: | 26% |
Housing density: 3,383 houses/condos per square mile
Median price asked for vacant for-sale houses and condos in 2022: $306,127.
Median contract rent in 2022: $941 (lower quartile is $527, upper quartile is $1,230)
Median rent asked for vacant for-rent units in 2022: $575
Median gross rent in Wilmington, DE in 2022: $1,166
Housing units in Wilmington with a mortgage: 10,093 (552 second mortgage, 0 home equity loan, 372 both second mortgage and home equity loan)
Houses without a mortgage: 426
Median household income for houses/condos with a mortgage: $84,216
Median household income for apartments without a mortgage: $49,626
Median monthly housing costs: $1,137
Compare current foreclosures in Wilmington, DE:
| Photo | Address | Area | Beds / Baths | Price | Details |
|---|---|---|---|---|---|

|
#1
N Pine St
Wilmington, DE 19802
|
1,125 sq. feet
|
1 baths 3 beds |
$199,900
|
show details |

|
#2
Kirkwood St
Wilmington, DE 19801
|
1,375 sq. feet
|
1 baths 3 beds |
show details | |

|
#3
Seton Dr
Wilmington, DE 19809
|
2,100 sq. feet
|
3 baths 4 beds |
show details | |

|
#4
Forrest Ave # 12
Wilmington, DE 19805
|
1,625 sq. feet
|
1 baths 4 beds |
show details | |

|
#5
Vandever Ave
Wilmington, DE 19802
|
- sq. feet
|
1 baths 3 beds |
show details | |

|
#6
S Claymont St
Wilmington, DE 19801
|
- sq. feet
|
2 baths 3 beds |
show details | |

|
#7
E Ayre St
Wilmington, DE 19804
|
- sq. feet
|
1 baths 3 beds |
show details | |

|
#8
S Sycamore St
Wilmington, DE 19805
|
- sq. feet
|
1 baths 3 beds |
show details | |

|
#9
W 4th St
Wilmington, DE 19805
|
- sq. feet
|
1 baths 4 beds |
show details | |

|
#10
N Clayton St
Wilmington, DE 19805
|
- sq. feet
|
1 baths 3 beds |
show details |
| Photo | Address | Area | Beds / Baths | Price | Details |
|---|---|---|---|---|---|

|
#11
Eastlawn Ave
Wilmington, DE 19802
|
- sq. feet
|
1 baths 3 beds |
show details | |

|
#12
N Heald St
Wilmington, DE 19802
|
- sq. feet
|
1 baths 3 beds |
show details | |

|
#13
Taunton Rd
Wilmington, DE 19803
|
- sq. feet
|
2 baths 4 beds |
show details | |

|
#14
Rock Ave
Wilmington, DE 19804
|
- sq. feet
|
1 baths 4 beds |
show details | |

|
#15
Dartmouth Rd
Wilmington, DE 19808
|
- sq. feet
|
1 baths 4 beds |
show details | |

|
#16
Highland Ct
Wilmington, DE 19802
|
- sq. feet
|
2 baths 2 beds |
show details | |

|
#17
Dettling Rd
Wilmington, DE 19805
|
- sq. feet
|
1 baths 3 beds |
show details | |

|
#18
Ridgeland Rd
Wilmington, DE 19803
|
- sq. feet
|
1 baths 3 beds |
show details | |

|
#19
Barrett St
Wilmington, DE 19802
|
- sq. feet
|
1 baths 4 beds |
show details | |

|
#20
Balsam Ter
Wilmington, DE 19804
|
- sq. feet
|
1 baths 2 beds |
show details |
| Photo | Address | Area | Beds / Baths | Price | Details |
|---|---|---|---|---|---|

|
#21
Brandywine Blvd
Wilmington, DE 19809
|
- sq. feet
|
1 baths 4 beds |
show details | |

|
#22
Birch Ave
Wilmington, DE 19805
|
- sq. feet
|
1 baths 3 beds |
show details | |

|
#23
S Connell St
Wilmington, DE 19805
|
- sq. feet
|
1 baths 3 beds |
show details | |

|
#24
Verona Dr
Wilmington, DE 19808
|
- sq. feet
|
1 baths 3 beds |
show details | |

|
#25
Robinson Dr
Wilmington, DE 19801
|
- sq. feet
|
1 baths 3 beds |
show details | |

|
#26
W 9th St
Wilmington, DE 19801
|
- sq. feet
|
1 baths 5 beds |
show details | |

|
#27
Coleman St
Wilmington, DE 19805
|
- sq. feet
|
1 baths 3 beds |
show details | |

|
#28
W 31st St
Wilmington, DE 19802
|
- sq. feet
|
1 baths 3 beds |
show details | |

|
#29
Mousley Pl
Wilmington, DE 19810
|
- sq. feet
|
2 baths 4 beds |
show details | |

|
#30
W 39th St
Wilmington, DE 19802
|
- sq. feet
|
1 baths 3 beds |
show details |
| Photo | Address | Area | Beds / Baths | Price | Details |
|---|---|---|---|---|---|

|
#31
E 8th St
Wilmington, DE 19801
|
- sq. feet
|
1 baths 3 beds |
show details | |

|
#32
S Stuyvesant Dr
Wilmington, DE 19809
|
- sq. feet
|
1 baths 4 beds |
show details | |

|
#33
S Claymont St
Wilmington, DE 19801
|
- sq. feet
|
2 baths 3 beds |
show details | |

|
#34
Morrow St
Wilmington, DE 19801
|
- sq. feet
|
1 baths 3 beds |
show details | |

|
#35
Wynnewood Ave
Wilmington, DE 19803
|
- sq. feet
|
1 baths 3 beds |
show details | |

|
#36
Valley Ave
Wilmington, DE 19810
|
- sq. feet
|
1 baths 2 beds |
show details | |

|
#37
Jessup St
Wilmington, DE 19802
|
- sq. feet
|
1 baths 3 beds |
show details | |

|
#38
Carsdale Ct
Wilmington, DE 19808
|
- sq. feet
|
2 baths 4 beds |
show details | |

|
#39
Clifford Brown Walk
Wilmington, DE 19801
|
- sq. feet
|
1 baths 3 beds |
show details | |

|
#40
Denny Rd
Wilmington, DE 19809
|
- sq. feet
|
1 baths 3 beds |
show details |
| Photo | Address | Area | Beds / Baths | Price | Details |
|---|---|---|---|---|---|

|
#41
Weatherhill Dr
Wilmington, DE 19808
|
- sq. feet
|
2 baths 2 beds |
show details | |

|
#42
Dunlap Dr
Wilmington, DE 19808
|
- sq. feet
|
1 baths 4 beds |
show details | |

|
#43
Claremont Ct
Wilmington, DE 19808
|
- sq. feet
|
1 baths 1 beds |
show details | |

|
#44
Lamotte St
Wilmington, DE 19802
|
- sq. feet
|
1 baths 4 beds |
show details | |

|
#45
W 36th St
Wilmington, DE 19802
|
- sq. feet
|
1 baths 3 beds |
show details | |

|
#46
N Monroe St
Wilmington, DE 19802
|
- sq. feet
|
2 baths 4 beds |
show details | |

|
#47
N Waterford Ln
Wilmington, DE 19808
|
- sq. feet
|
2 baths 2 beds |
show details | |

|
#48
Hammond Pl
Wilmington, DE 19808
|
- sq. feet
|
1 baths 3 beds |
show details | |

|
#49
N Monroe St
Wilmington, DE 19802
|
- sq. feet
|
1 baths 4 beds |
show details | |

|
Check over 1 million property listings on Foreclosure.com!
|
browse all offers | |||

Latest news about housing in Wilmington, DE collected exclusively by city-data.com from local newspapers, TV, and radio stations

 | Thinking of buying a condo in Wilmington any recommendations? (3 replies) |
| Looking for apartments and car pool (2 replies) |
| saddle ridge crossing townhomes Wilmington DE Review (5 replies) |
| Fairfax Apartments in Wilmington (0 replies) |
| Apartments in Wilmington (1 reply) |
| Top of the Hill Apartments in Wilmington (4 replies) |
Median year apartment built: 1954
Household type by relationship:
Households: 71,568- Male householders: 14,122 (6,527 living alone), Female householders: 18,117 (8,448 living alone)
6,866 spouses (6,804 opposite-sex spouses), 2,728 unmarried partners, (2,361 opposite-sex unmarried partners), 17,321 children (15,867 natural, 968 adopted, 486 stepchildren), 3,963 grandchildren, 830 brothers or sisters, 686 parents, 0 foster children, 1,024 other relatives, 3,733 non-relatives
- In group quarters: 2,178
Size of family households: 5,351 2-persons, 4,381 3-persons, 3,564 4-persons, 634 5-persons, 225 6-persons, 358 7-or-more-persons.
Size of nonfamily households: 14,975 1-person, 2,636 2-persons, 115 4-persons.
3,306 married couples with children.
7,984 single-parent households (1,946 men, 6,038 women).
87.8% of residents of Wilmington speak English at home.
8.3% of residents speak Spanish at home (54% speak English very well, 21% speak English well, 22% speak English not well, 3% don't speak English at all).
1.8% of residents speak other Indo-European language at home (93% speak English very well, 7% speak English well).
0.5% of residents speak Asian or Pacific Island language at home (84% speak English very well, 11% speak English well, 5% speak English not well).
1.7% of residents speak other language at home (67% speak English very well, 21% speak English well, 12% speak English not well).
Foreign born population: 5,717 (8.0%)
(71.5% of them are naturalized citizens)
| Here: | 6.4 |
| State: | 6.9 |
| Here: | 3.7 |
| State: | 4.4 |
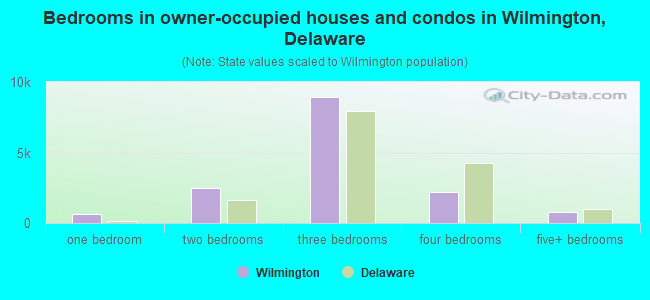
- Bedrooms in owner-occupied houses and condos in Wilmington, Delaware
- 0no bedroom
- 6721 bedroom
- 2,4842 bedrooms
- 8,9223 bedrooms
- 2,2104 bedrooms
- 7495+ bedrooms
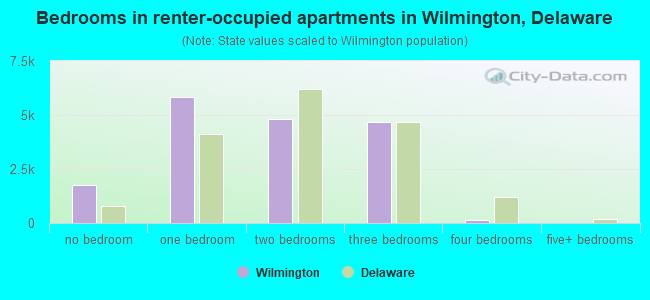
- Bedrooms in renter-occupied apartments in Wilmington, Delaware
- 1,741no bedroom
- 5,8521 bedroom
- 4,7952 bedrooms
- 4,6873 bedrooms
- 1274 bedrooms
- 05+ bedrooms
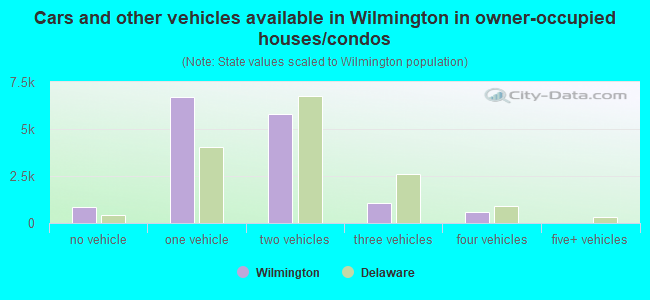
- Cars and other vehicles available in Wilmington in owner-occupied houses/condos
- 866no vehicle
- 6,6881 vehicle
- 5,8142 vehicles
- 1,0713 vehicles
- 5984 vehicles
- 05+ vehicles
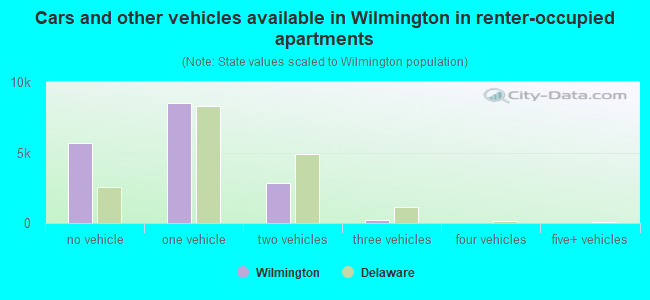
- Cars and other vehicles available in Wilmington in renter-occupied apartments
- 5,666no vehicle
- 8,4811 vehicle
- 2,8722 vehicles
- 1833 vehicles
- 04 vehicles
- 05+ vehicles
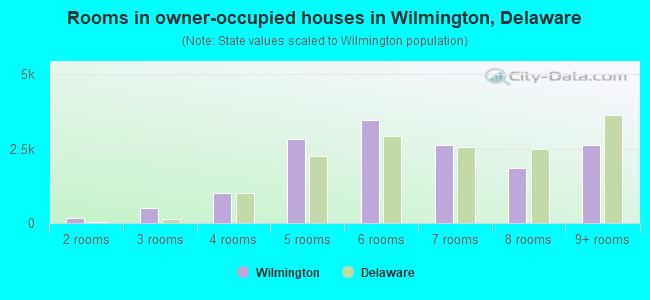
- Rooms in owner-occupied houses in Wilmington, Delaware
- 01 room
- 1722 rooms
- 5083 rooms
- 1,0084 rooms
- 2,8335 rooms
- 3,4536 rooms
- 2,6207 rooms
- 1,8398 rooms
- 2,6049+ rooms
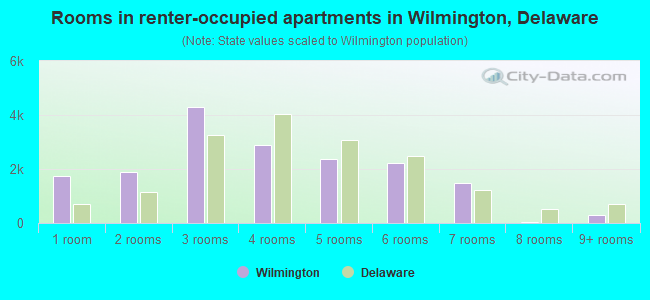
- Rooms in renter-occupied apartments in Wilmington, Delaware
- 1,7411 room
- 1,8712 rooms
- 4,3013 rooms
- 2,9004 rooms
- 2,3865 rooms
- 2,2246 rooms
- 1,4647 rooms
- 348 rooms
- 2819+ rooms
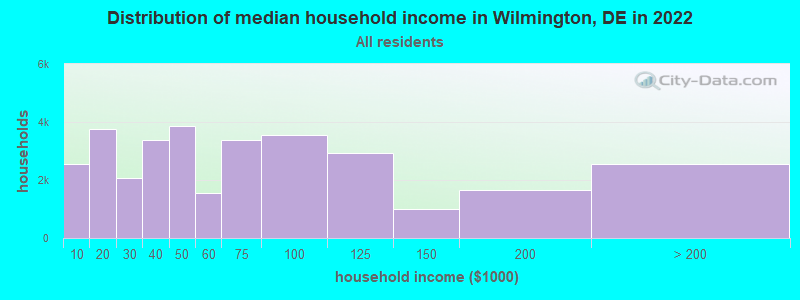
Wilmington, DE household income distribution

- 2,561Less than $10,000
- 3,764$10,000 to $19,999
- 2,072$20,000 to $29,999
- 3,366$30,000 to $39,999
- 3,876$40,000 to $49,999
- 1,537$50,000 to $59,999
- 3,370$60,000 to $74,999
- 3,565$75,000 to $99,999
- 2,916$100,000 to $124,999
- 1,017$125,000 to $149,999
- 1,644$150,000 to $199,999
- 2,551$200,000 or more
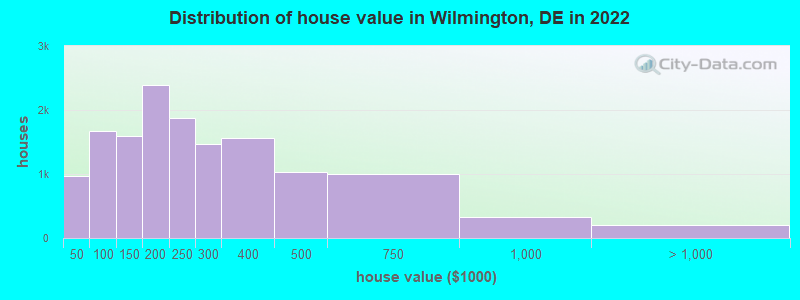
Home value of owner - occupied houses in 2022 in Wilmington, DE
-
- 151Less than $10,000
- 126$10,000 to $14,999
- 193$15,000 to $19,999
- 67$20,000 to $24,999
- 72$25,000 to $29,999
- 78$30,000 to $34,999
- 26$35,000 to $39,999
- 255$40,000 to $49,999
- 150$50,000 to $59,999
- 285$60,000 to $69,999
- 305$70,000 to $79,999
- 478$80,000 to $89,999
- 200$90,000 to $99,999
- 867$100,000 to $124,999
- 733$125,000 to $149,999
- 1,561$150,000 to $174,999
- 827$175,000 to $199,999
- 1,870$200,000 to $249,999
- 1,475$250,000 to $299,999
- 1,561$300,000 to $399,999
- 1,034$400,000 to $499,999
- 992$500,000 to $749,999
- 323$750,000 to $999,999
- 135$1,000,000 to $1,499,999
- 56$1,500,000 to $1,999,999
- 17$2,000,000 or more
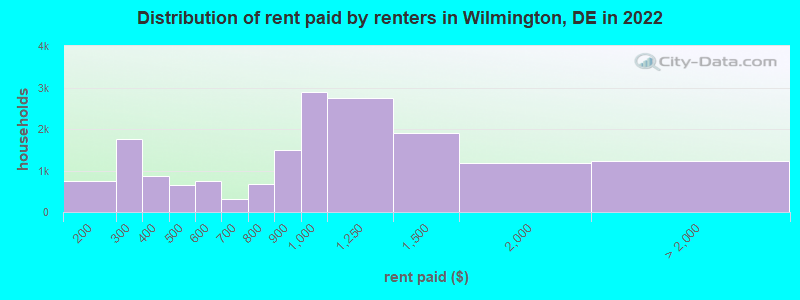
Rent paid by renters in 2022 in Wilmington, DE
-
- 689$100 to $149
- 62$150 to $199
- 964$200 to $249
- 793$250 to $299
- 358$300 to $349
- 519$350 to $399
- 425$400 to $449
- 215$450 to $499
- 357$500 to $549
- 402$550 to $599
- 201$600 to $649
- 107$650 to $699
- 216$700 to $749
- 458$750 to $799
- 1,492$800 to $899
- 2,881$900 to $999
- 2,737$1,000 to $1,249
- 1,914$1,250 to $1,499
- 1,184$1,500 to $1,999
- 778$2,000 to $2,499
- 125$2,500 to $2,999
- 325No cash rent
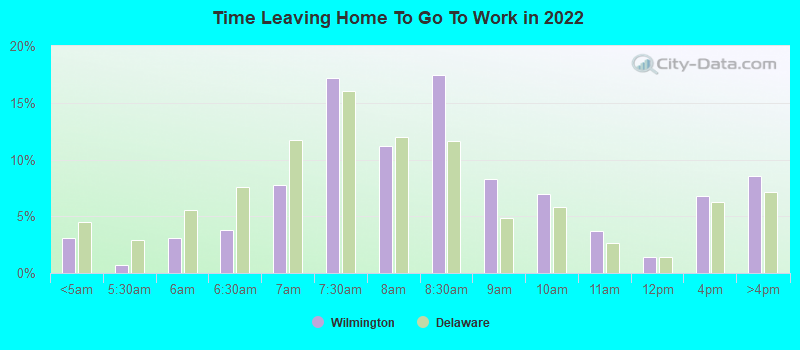
Percentage of workers working in this county: 85.9%
Number of people working at home: 5,426 (15.5% of all workers)
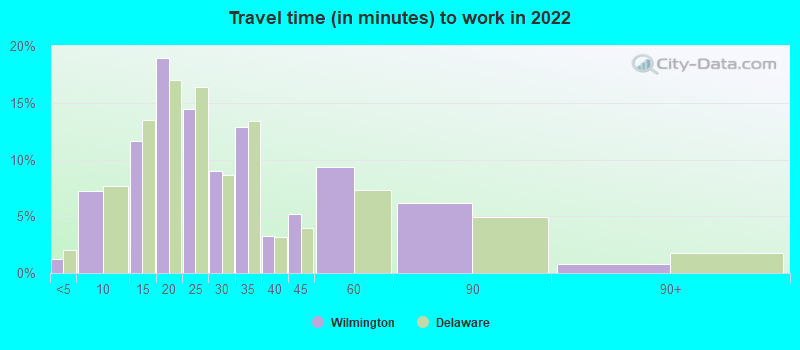
Travel time to work (commute)
- Less than 5 minutes: 285
- 5 to 9 minutes: 3,141
- 10 to 14 minutes: 4,098
- 15 to 19 minutes: 6,364
- 20 to 24 minutes: 5,822
- 25 to 29 minutes: 3,527
- 30 to 34 minutes: 2,926
- 35 to 39 minutes: 339
- 40 to 44 minutes: 381
- 45 to 59 minutes: 1,571
- 60 to 89 minutes: 1,447
- 90 or more minutes: 210
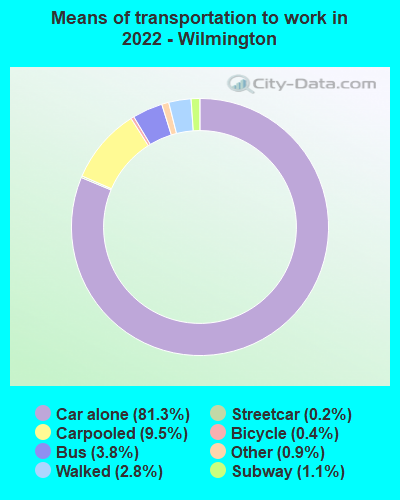
Means of transportation to work:
- Drove a car alone: 40,788 (72.1%)
- Carpooled: 4,493 (7.9%)
- Bus: 1,790 (3.2%)
- Subway or elevated rail: 135 (0.2%)
- Long-distance train or commuter rail: 367 (0.6%)
- Light rail, streetcar or trolley: 45 (0.1%)
- Taxi: 427 (0.8%)
- Bicycle: 345 (0.6%)
- Walked: 1,465 (2.6%)
- Worked at home: 5,426 (9.6%)
- Unemployment by race in 2022
- Unemployment rate for White non-Hispanic residents
- 0.5%Males
- 5.2%Females
- Unemployment rate for Black residents
- 7.2%Males
- 2.1%Females
- Unemployment rate for Asian residents
- 1.5%Males
- 1.4%Females
- Unemployment rate for two or more race residents
- 3.8%Males
- 13.2%Females
- Unemployment rate for Hispanic or Latino residents
- 2.8%Males
- 10.1%Females
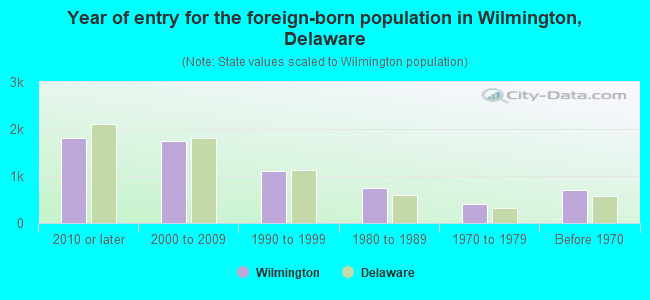
- Year of entry for the foreign-born population in Wilmington, Delaware
- 1,8132010 or later
- 1,7502000 to 2009
- 1,1171990 to 1999
- 7401980 to 1989
- 4051970 to 1979
- 705Before 1970
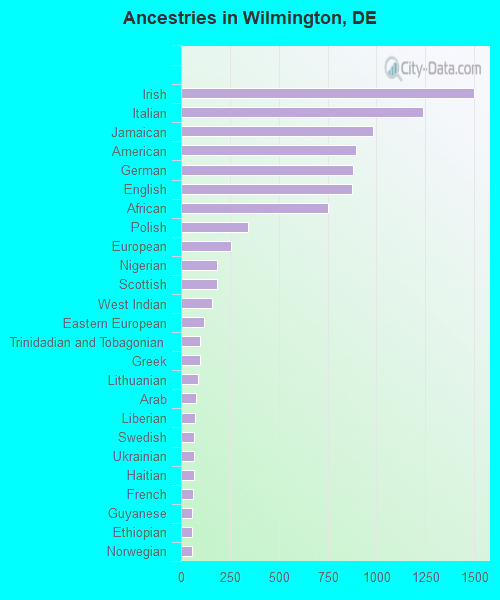
First ancestries reported:
- Irish: 1,501 (4.3%)
- Italian: 1,237 (3.5%)
- Jamaican: 981 (2.8%)
- American: 897 (2.6%)
- German: 880 (2.5%)
- English: 876 (2.5%)
- African: 753 (2.2%)
- Polish: 341 (1.0%)
- European: 258 (0.7%)
- Nigerian: 185 (0.5%)
- Scottish: 185 (0.5%)
- West Indian: 158 (0.5%)
- Eastern European: 118 (0.3%)
- Trinidadian and Tobagonian: 95 (0.3%)
- Greek: 95 (0.3%)
- Lithuanian: 87 (0.2%)
- Arab: 75 (0.2%)
- Liberian: 73 (0.2%)
- Swedish: 69 (0.2%)
- Ukrainian: 65 (0.2%)
- Haitian: 65 (0.2%)
- French: 63 (0.2%)
- Guyanese: 58 (0.2%)
- Ethiopian: 56 (0.2%)
- Norwegian: 54 (0.2%)
- Bermudan: 45 (0.1%)
- Slovak: 29 (0.08%)
- German Russian: 29 (0.08%)
- Finnish: 26 (0.07%)
- Czechoslovakian: 20 (0.06%)
- Austrian: 20 (0.06%)
- Ghanaian: 20 (0.06%)
- Welsh: 20 (0.06%)
- Turkish: 18 (0.05%)
- Scotch-Irish: 18 (0.05%)
- Israeli: 14 (0.04%)
- British: 13 (0.04%)
- Jordanian: 13 (0.04%)
- Portuguese: 12 (0.03%)
- Lebanese: 12 (0.03%)
- Slavic: 11 (0.03%)
- Czech: 11 (0.03%)
- Sudanese: 10 (0.03%)
- Armenian: 10 (0.03%)
- Slovene: 9 (0.03%)
- Swiss: 9 (0.03%)
- British West Indian: 9 (0.03%)
- Kenyan: 8 (0.02%)
- Dutch: 7 (0.02%)
- Iranian: 6 (0.02%)
- Alsatian: 6 (0.02%)
- Croatian: 5 (0.01%)
- Canadian: 5 (0.01%)
- Pennsylvania German: 5 (0.01%)
- Romanian: 4 (0.01%)
- Northern European: 4 (0.01%)
- Serbian: 4 (0.01%)
- Russian: 3 (0.01%)
- Egyptian: 3 (0.01%)
- Hungarian: 2 (0.01%)
Most common places of birth for foreign-born residents (%):
| Wilmington: | 21.1% (1,219) |
| Delaware: | 3.8% (3,727) |
| Wilmington: | 13.3% (768) |
| Delaware: | 15.3% (14,887) |
| Wilmington: | 8.0% (460) |
| Delaware: | 3.1% (2,996) |
| Wilmington: | 5.6% (322) |
| Delaware: | 1.4% (1,386) |
| Wilmington: | 4.6% (266) |
| Delaware: | 11.6% (11,288) |
| Wilmington: | 4.1% (239) |
| Delaware: | 0.4% (420) |
| Wilmington: | 3.7% (214) |
| Delaware: | 5.7% (5,583) |
| Wilmington: | 3.2% (184) |
| Delaware: | 0.4% (399) |
| Wilmington: | 3.0% (175) |
| Delaware: | 0.7% (659) |
| Wilmington: | 2.9% (170) |
| Delaware: | 1.3% (1,286) |
| Wilmington: | 2.5% (143) |
| Delaware: | 3.0% (2,919) |
| Wilmington: | 2.4% (140) |
| Delaware: | 1.6% (1,552) |
| Wilmington: | 2.0% (116) |
| Delaware: | 0.6% (577) |
| Wilmington: | 1.9% (108) |
| Delaware: | 0.4% (417) |
| Wilmington: | 1.7% (96) |
| Delaware: | 0.3% (313) |
Place of birth for U.S.-born residents:
- This state: 32,585
- Other state: 30,752
- Northeast: 21,431
- Midwest: 1,589
- South: 6,757
- West: 975
84.7% of Wilmington residents lived in the same house 1 years ago.
Out of people who lived in different houses, 36.1% lived in this county.
Out of people who lived in different counties, 5.6% lived in Delaware.
| Wilmington: | 84.7% |
| State average: | 89.2% |
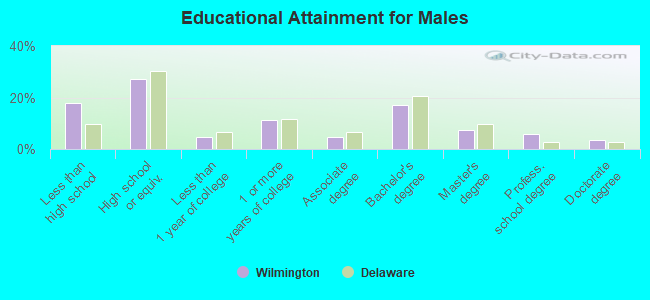
Education attainment for males 25 years and older:
- No schooling: 363
- Nursery to 4th grade: 91
- 5th and 6th grade: 90
- 7th and 8th grade: 127
- 9th grade: 227
- 10th grade: 1,905
- 11th grade: 393
- 12th grade, no diploma: 781
- High school graduate (or equivalency): 6,091
- Less than 1 year of college: 1,042
- Some college more than 1 year, no degree: 2,548
- Associate degree: 1,017
- Bachelor's degree: 3,818
- Master's degree: 1,680
- Professional school degree: 1,305
- Doctorate degree: 783
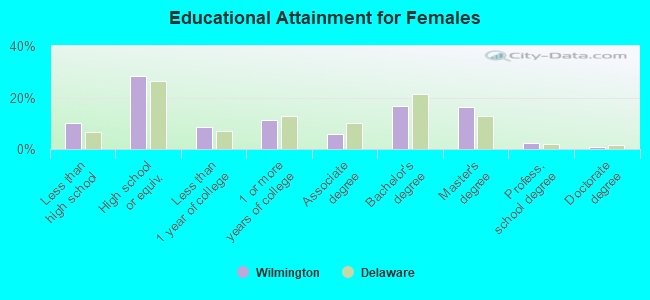
Education attainment for females 25 years and older:
- No schooling: 427
- Nursery to 4th grade: 168
- 5th and 6th grade: 49
- 7th and 8th grade: 0
- 9th grade: 246
- 10th grade: 577
- 11th grade: 700
- 12th grade, no diploma: 651
- High school graduate (or equivalency): 7,981
- Less than 1 year of college: 2,418
- Some college more than 1 year, no degree: 3,140
- Associate degree: 1,645
- Bachelor's degree: 4,719
- Master's degree: 4,534
- Professional school degree: 676
- Doctorate degree: 199
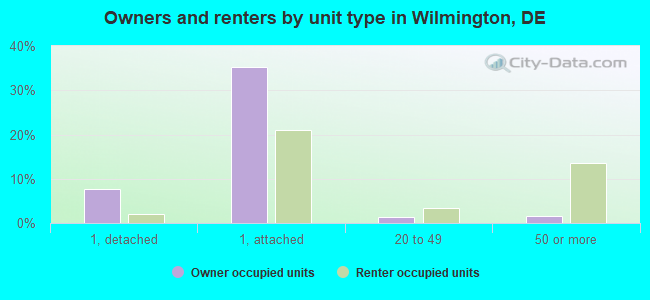
Housing units in structures:
- One, detached: 3,443
- One, attached: 21,034
- Two: 1,023
- 3 or 4: 1,874
- 5 to 9: 992
- 10 to 19: 1,982
- 20 to 49: 1,244
- 50 or more: 5,005
- Boats, RVs, vans, etc.: 100
Housing units lacking complete kitchen facilities in 2022: 3.4%
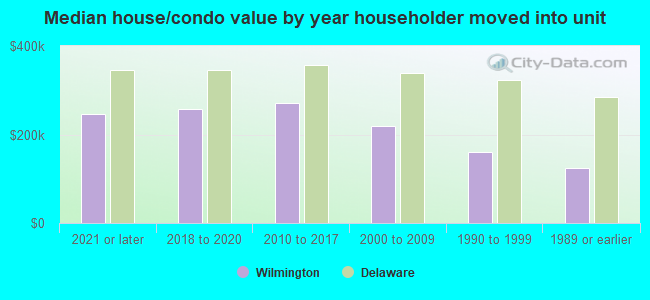
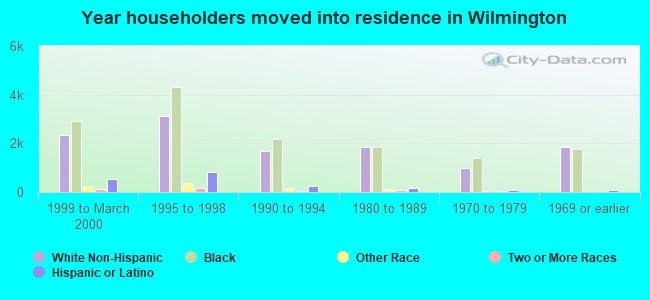
House/condo owner moved in on average 12 years ago
Renter moved in on average 2 years ago
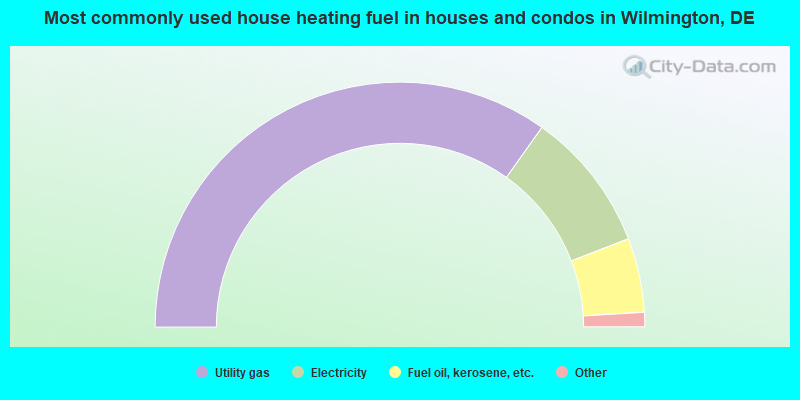
- 69.7%Utility gas
- 18.6%Electricity
- 9.8%Fuel oil, kerosene, etc.
- 1.5%Bottled, tank, or LP gas
- 0.2%Other fuel
- 0.2%No fuel used
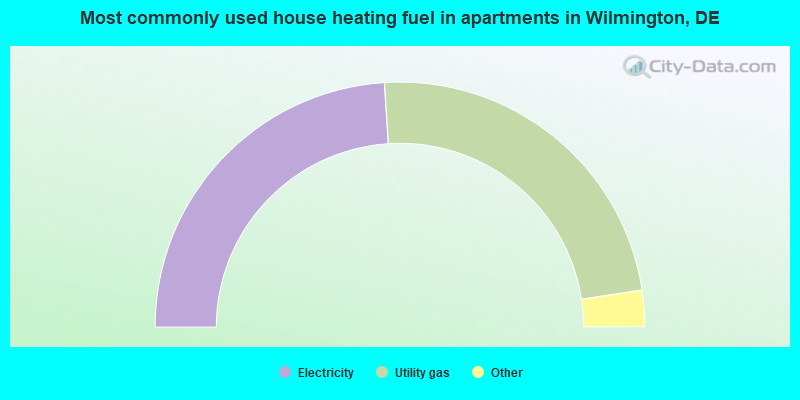
- 48.0%Electricity
- 47.2%Utility gas
- 2.7%Fuel oil, kerosene, etc.
- 1.2%Bottled, tank, or LP gas
- 0.6%No fuel used
- 0.3%Other fuel
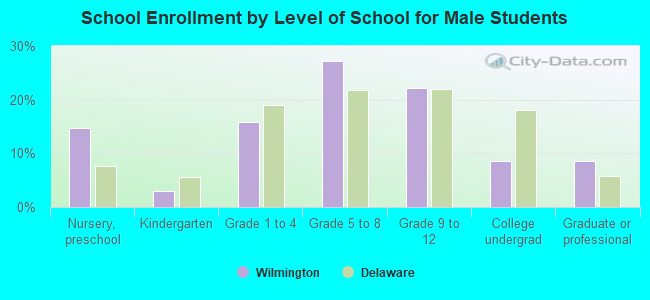
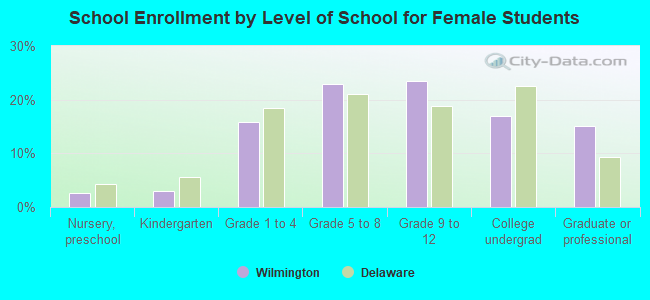
Private vs. public school enrollment:
| Here: | 5.1% |
| Delaware: | 11.5% |
| Here: | 13.2% |
| Delaware: | 12.1% |
| Here: | 57.6% |
| Delaware: | 19.2% |