Races in Wilmington, Delaware (DE) Detailed Stats
Data:
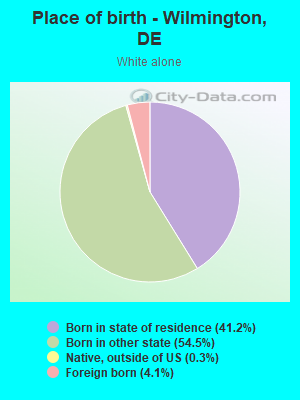
Races - White alone (%)
Races - White alone (% change since 2000)
Races - Black alone (%)
Races - Black alone (% change since 2000)
Races - American Indian alone (%)
Races - American Indian alone (% change since 2000)
Races - Asian alone (%)
Races - Asian alone (% change since 2000)
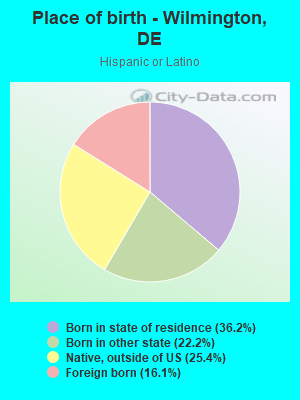
Races - Hispanic (%)
Races - Hispanic (% change since 2000)
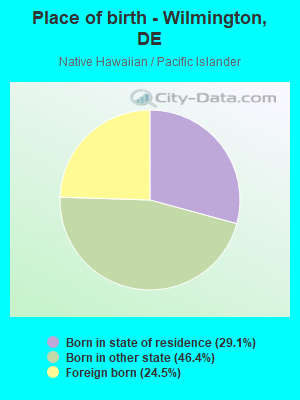
Races - Native Hawaiian and Other Pacific Islander alone (%)
Races - Native Hawaiian and Other Pacific Islander alone (% change since 2000)
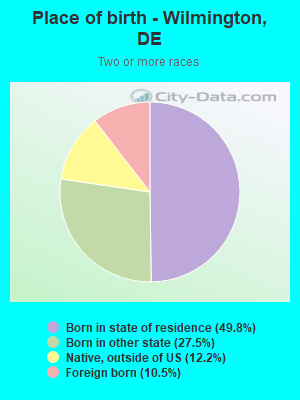
Races - Two or more races(%)
Races - Two or more races(% change since 2000)
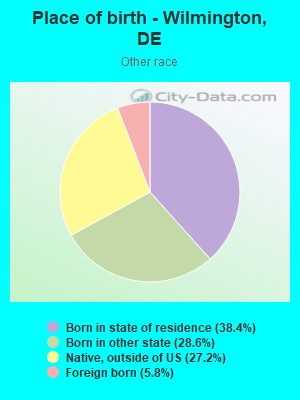
Races - Other race alone (%)
Races - Other race alone (% change since 2000)
Racial diversity
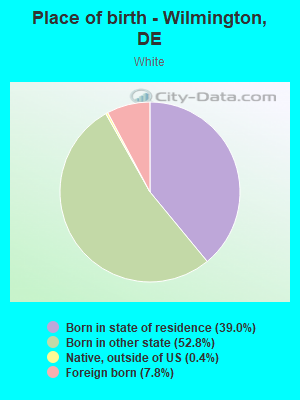
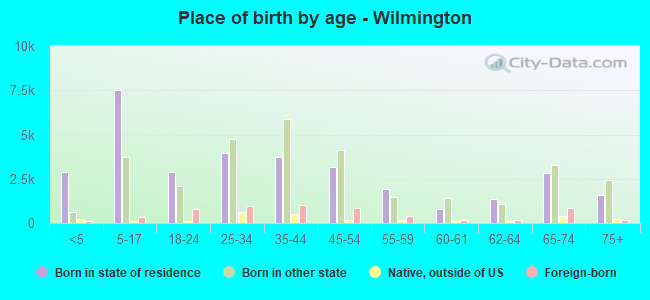
Place of birth - Born in state of residence (%)
Place of birth - Born in state of residence (%) - White
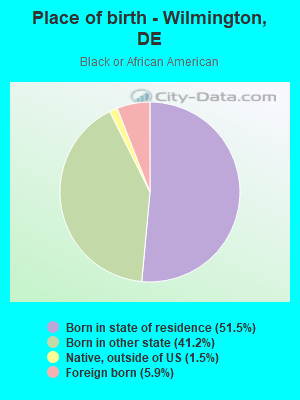
Place of birth - Born in state of residence (%) - Black or African American
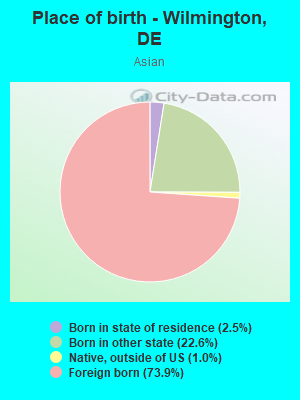
Place of birth - Born in state of residence (%) - Asian
Place of birth - Born in state of residence (%) - Hispanic or Latino
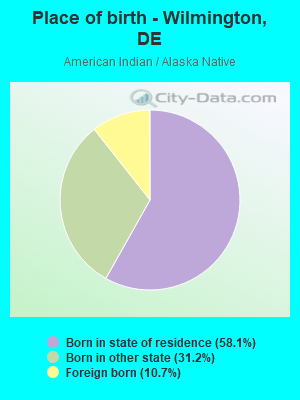
Place of birth - Born in state of residence (%) - American Indian and Alaska Native
Place of birth - Born in state of residence (%) - Multirace
Place of birth - Born in state of residence (%) - Other Race
Place of birth - Born in other state (%)
Place of birth - Born in other state (%) - White
Place of birth - Born in other state (%) - Black or African American
Place of birth - Born in other state (%) - Asian
Place of birth - Born in other state (%) - Hispanic or Latino
Place of birth - Born in other state (%) - American Indian and Alaska Native
Place of birth - Born in other state (%) - Multirace
Place of birth - Born in other state (%) - Other Race
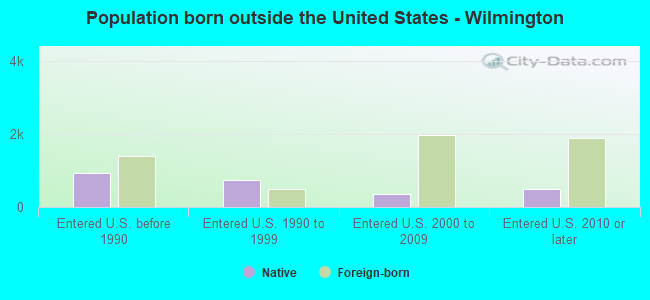
Place of birth - Native, outside of US (%)
Place of birth - Native, outside of US (%) - White
Place of birth - Native, outside of US (%) - Black or African American
Place of birth - Native, outside of US (%) - Asian
Place of birth - Native, outside of US (%) - Hispanic or Latino
Place of birth - Native, outside of US (%) - American Indian and Alaska Native
Place of birth - Native, outside of US (%) - Multirace
Place of birth - Native, outside of US (%) - Other Race
Place of birth - Foreign born (%)
Place of birth - Foreign born (%) - White
Place of birth - Foreign born (%) - Black or African American
Place of birth - Foreign born (%) - Asian
Place of birth - Foreign born (%) - Hispanic or Latino
Place of birth - Foreign born (%) - American Indian and Alaska Native
Place of birth - Foreign born (%) - Multirace
Place of birth - Foreign born (%) - Other Race
Residents speaking English at home (%)
Residents speaking English at home - Born in the United States (%)
Residents speaking English at home - Native, born elsewhere (%)
Residents speaking English at home - Foreign born (%)
Residents speaking Spanish at home (%)
Residents speaking Spanish at home - Born in the United States (%)
Residents speaking Spanish at home - Native, born elsewhere (%)
Residents speaking Spanish at home - Foreign born (%)
Residents speaking other language at home (%)
Residents speaking other language at home - Born in the United States (%)
Residents speaking other language at home - Native, born elsewhere (%)
Residents speaking other language at home - Foreign born (%)
Marital status - Never married (%)
Marital status - Now married (%)
Marital status - Separated (%)
Marital status - Widowed (%)
Marital status - Divorced (%)
Ancestries Reported - Arab (%)
Ancestries Reported - Czech (%)
Ancestries Reported - Danish (%)
Ancestries Reported - Dutch (%)
Ancestries Reported - English (%)
Ancestries Reported - French (%)
Ancestries Reported - French Canadian (%)
Ancestries Reported - German (%)
Ancestries Reported - Greek (%)
Ancestries Reported - Hungarian (%)
Ancestries Reported - Irish (%)
Ancestries Reported - Italian (%)
Ancestries Reported - Lithuanian (%)
Ancestries Reported - Norwegian (%)
Ancestries Reported - Polish (%)
Ancestries Reported - Portuguese (%)
Ancestries Reported - Russian (%)
Ancestries Reported - Scotch-Irish (%)
Ancestries Reported - Scottish (%)
Ancestries Reported - Slovak (%)
Ancestries Reported - Subsaharan African (%)
Ancestries Reported - Swedish (%)
Ancestries Reported - Swiss (%)
Ancestries Reported - Ukrainian (%)
Ancestries Reported - United States (%)
Ancestries Reported - Welsh (%)
Ancestries Reported - West Indian (%)
Ancestries Reported - Other (%)
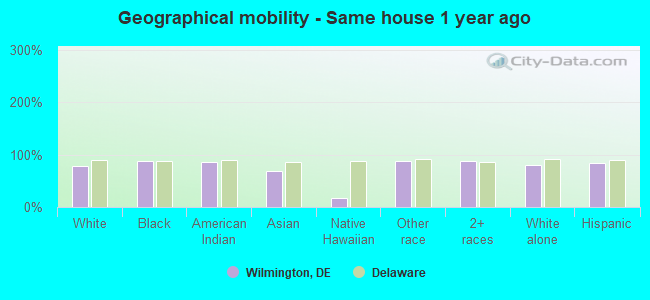
Geographical mobility - Same house 1 year ago (%)
Geographical mobility - Same house 1 year ago (%) - White
Geographical mobility - Same house 1 year ago (%) - Black or African American
Geographical mobility - Same house 1 year ago (%) - Asian
Geographical mobility - Same house 1 year ago (%) - Hispanic or Latino
Geographical mobility - Same house 1 year ago (%) - American Indian and Alaska Native
Geographical mobility - Same house 1 year ago (%) - Multirace
Geographical mobility - Same house 1 year ago (%) - Other Race
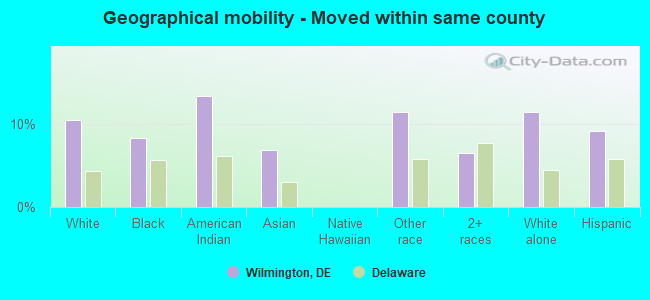
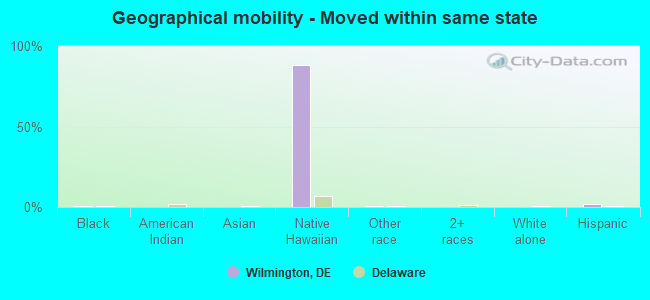
Geographical mobility - Moved within same county (%)
Geographical mobility - Moved within same county (%) - White
Geographical mobility - Moved within same county (%) - Black or African American
Geographical mobility - Moved within same county (%) - Asian
Geographical mobility - Moved within same county (%) - Hispanic or Latino
Geographical mobility - Moved within same county (%) - American Indian and Alaska Native
Geographical mobility - Moved within same county (%) - Multirace
Geographical mobility - Moved within same county (%) - Other Race
Geographical mobility - Moved from different county within same state (%)
Geographical mobility - Moved from different county within same state (%) - White
Geographical mobility - Moved from different county within same state (%) - Black or African American
Geographical mobility - Moved from different county within same state (%) - Asian
Geographical mobility - Moved from different county within same state (%) - Hispanic or Latino
Geographical mobility - Moved from different county within same state (%) - American Indian and Alaska Native
Geographical mobility - Moved from different county within same state (%) - Multirace
Geographical mobility - Moved from different county within same state (%) - Other Race
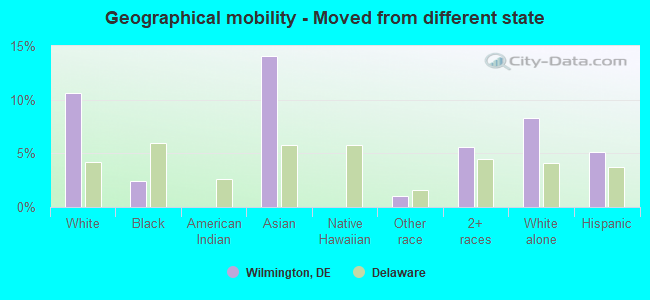
Geographical mobility - Moved from different state (%)
Geographical mobility - Moved from different state (%) - White
Geographical mobility - Moved from different state (%) - Black or African American
Geographical mobility - Moved from different state (%) - Asian
Geographical mobility - Moved from different state (%) - Hispanic or Latino
Geographical mobility - Moved from different state (%) - American Indian and Alaska Native
Geographical mobility - Moved from different state (%) - Multirace
Geographical mobility - Moved from different state (%) - Other Race
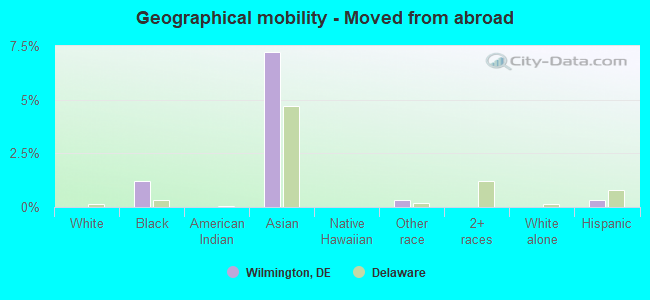
Geographical mobility - Moved from abroad (%)
Geographical mobility - Moved from abroad (%) - White
Geographical mobility - Moved from abroad (%) - Black or African American
Geographical mobility - Moved from abroad (%) - Asian
Geographical mobility - Moved from abroad (%) - Hispanic or Latino
Geographical mobility - Moved from abroad (%) - American Indian and Alaska Native
Geographical mobility - Moved from abroad (%) - Multirace
Geographical mobility - Moved from abroad (%) - Other Race
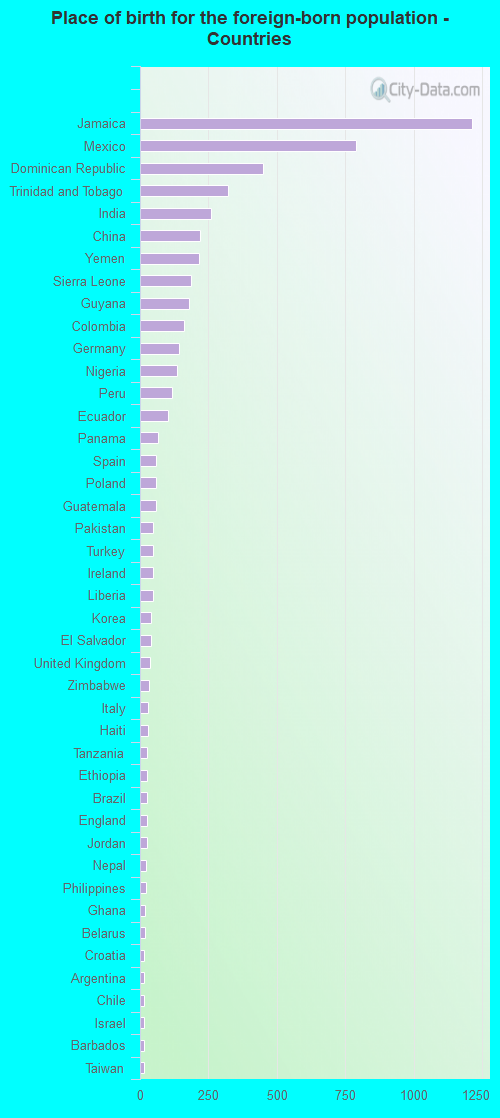
Place of birth for the foreign-born population - Ireland (%)
Place of birth for the foreign-born population - Denmark (%)
Place of birth for the foreign-born population - Norway (%)
Place of birth for the foreign-born population - Sweden (%)
Place of birth for the foreign-born population - United Kingdom (%)
Place of birth for the foreign-born population - England (%)
Place of birth for the foreign-born population - Scotland (%)
Place of birth for the foreign-born population - Other Northern Europe (%)
Place of birth for the foreign-born population - Austria (%)
Place of birth for the foreign-born population - Belgium (%)
Place of birth for the foreign-born population - France (%)
Place of birth for the foreign-born population - Germany (%)
Place of birth for the foreign-born population - Netherlands (%)
Place of birth for the foreign-born population - Switzerland (%)
Place of birth for the foreign-born population - Other Western Europe (%)
Place of birth for the foreign-born population - Greece (%)
Place of birth for the foreign-born population - Italy (%)
Place of birth for the foreign-born population - Portugal (%)
Place of birth for the foreign-born population - Spain (%)
Place of birth for the foreign-born population - Other Southern Europe (%)
Place of birth for the foreign-born population - Albania (%)
Place of birth for the foreign-born population - Belarus (%)
Place of birth for the foreign-born population - Bosnia and Herzegovina (%)
Place of birth for the foreign-born population - Bulgaria (%)
Place of birth for the foreign-born population - Croatia (%)
Place of birth for the foreign-born population - Czechoslovakia (%)
Place of birth for the foreign-born population - Hungary (%)
Place of birth for the foreign-born population - Latvia (%)
Place of birth for the foreign-born population - Lithuania (%)
Place of birth for the foreign-born population - North Macedonia (Macedonia) (%)
Place of birth for the foreign-born population - Moldova (%)
Place of birth for the foreign-born population - Poland (%)
Place of birth for the foreign-born population - Romania (%)
Place of birth for the foreign-born population - Russia (%)
Place of birth for the foreign-born population - Serbia (%)
Place of birth for the foreign-born population - Ukraine (%)
Place of birth for the foreign-born population - Other Eastern Europe (%)
Place of birth for the foreign-born population - China (%)
Place of birth for the foreign-born population - Hong Kong (%)
Place of birth for the foreign-born population - Taiwan (%)
Place of birth for the foreign-born population - Japan (%)
Place of birth for the foreign-born population - Korea (%)
Place of birth for the foreign-born population - Other Eastern Asia (%)
Place of birth for the foreign-born population - Afghanistan (%)
Place of birth for the foreign-born population - Bangladesh (%)
Place of birth for the foreign-born population - India (%)
Place of birth for the foreign-born population - Iran (%)
Place of birth for the foreign-born population - Kazakhstan (%)
Place of birth for the foreign-born population - Nepal (%)
Place of birth for the foreign-born population - Pakistan (%)
Place of birth for the foreign-born population - Sri Lanka (%)
Place of birth for the foreign-born population - Uzbekistan (%)
Place of birth for the foreign-born population - Other South Central Asia (%)
Place of birth for the foreign-born population - Burma (%)
Place of birth for the foreign-born population - Cambodia (%)
Place of birth for the foreign-born population - Indonesia (%)
Place of birth for the foreign-born population - Laos (%)
Place of birth for the foreign-born population - Malaysia (%)
Place of birth for the foreign-born population - Philippines (%)
Place of birth for the foreign-born population - Singapore (%)
Place of birth for the foreign-born population - Thailand (%)
Place of birth for the foreign-born population - Vietnam (%)
Place of birth for the foreign-born population - Other South Eastern Asia (%)
Place of birth for the foreign-born population - Armenia (%)
Place of birth for the foreign-born population - Iraq (%)
Place of birth for the foreign-born population - Israel (%)
Place of birth for the foreign-born population - Jordan (%)
Place of birth for the foreign-born population - Kuwait (%)
Place of birth for the foreign-born population - Lebanon (%)
Place of birth for the foreign-born population - Saudi Arabia (%)
Place of birth for the foreign-born population - Syria (%)
Place of birth for the foreign-born population - Turkey (%)
Place of birth for the foreign-born population - Yemen (%)
Place of birth for the foreign-born population - Other Western Asia (%)
Place of birth for the foreign-born population - Eritrea (%)
Place of birth for the foreign-born population - Ethiopia (%)
Place of birth for the foreign-born population - Kenya (%)
Place of birth for the foreign-born population - Somalia (%)
Place of birth for the foreign-born population - Uganda (%)
Place of birth for the foreign-born population - Zimbabwe (%)
Place of birth for the foreign-born population - Other Eastern Africa (%)
Place of birth for the foreign-born population - Cameroon (%)
Place of birth for the foreign-born population - Congo (%)
Place of birth for the foreign-born population - Democratic Republic of Congo (Zaire) (%)
Place of birth for the foreign-born population - Other Middle Africa (%)
Place of birth for the foreign-born population - Egypt (%)
Place of birth for the foreign-born population - Morocco (%)
Place of birth for the foreign-born population - Sudan (%)
Place of birth for the foreign-born population - Other Northern Africa (%)
Place of birth for the foreign-born population - South Africa (%)
Place of birth for the foreign-born population - Other Southern Africa (%)
Place of birth for the foreign-born population - Cabo Verde (%)
Place of birth for the foreign-born population - Ghana (%)
Place of birth for the foreign-born population - Liberia (%)
Place of birth for the foreign-born population - Nigeria (%)
Place of birth for the foreign-born population - Senegal (%)
Place of birth for the foreign-born population - Sierra Leone (%)
Place of birth for the foreign-born population - Other Western Africa (%)
Place of birth for the foreign-born population - Australia (%)
Place of birth for the foreign-born population - New Zealand (%)
Place of birth for the foreign-born population - Fiji (%)
Place of birth for the foreign-born population - Micronesia (%)
Place of birth for the foreign-born population - Bahamas (%)
Place of birth for the foreign-born population - Barbados (%)
Place of birth for the foreign-born population - Cuba (%)
Place of birth for the foreign-born population - Dominica (%)
Place of birth for the foreign-born population - Dominican Republic (%)
Place of birth for the foreign-born population - Grenada (%)
Place of birth for the foreign-born population - Haiti (%)
Place of birth for the foreign-born population - Jamaica (%)
Place of birth for the foreign-born population - St. Vincent and the Grenadines (%)
Place of birth for the foreign-born population - Trinidad and Tobago (%)
Place of birth for the foreign-born population - West Indies (%)
Place of birth for the foreign-born population - Other Caribbean (%)
Place of birth for the foreign-born population - Belize (%)
Place of birth for the foreign-born population - Costa Rica (%)
Place of birth for the foreign-born population - El Salvador (%)
Place of birth for the foreign-born population - Guatemala (%)
Place of birth for the foreign-born population - Honduras (%)
Place of birth for the foreign-born population - Mexico (%)
Place of birth for the foreign-born population - Nicaragua (%)
Place of birth for the foreign-born population - Panama (%)
Place of birth for the foreign-born population - Other Central America (%)
Place of birth for the foreign-born population - Argentina (%)
Place of birth for the foreign-born population - Bolivia (%)
Place of birth for the foreign-born population - Brazil (%)
Place of birth for the foreign-born population - Chile (%)
Place of birth for the foreign-born population - Colombia (%)
Place of birth for the foreign-born population - Ecuador (%)
Place of birth for the foreign-born population - Guyana (%)
Place of birth for the foreign-born population - Peru (%)
Place of birth for the foreign-born population - Uruguay (%)
Place of birth for the foreign-born population - Venezuela (%)
Place of birth for the foreign-born population - Other South America (%)
Place of birth for the foreign-born population - Canada (%)
Place of birth for the foreign-born population - Other Northern America (%)
Place of birth for the foreign-born population - Other (%)
Latest news about races in Wilmington, DE collected exclusively by city-data.com from local newspapers, TV, and radio stations
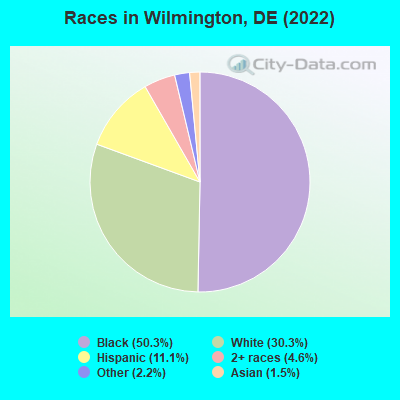
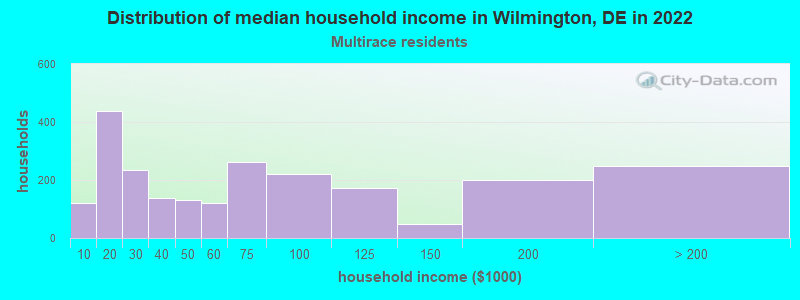
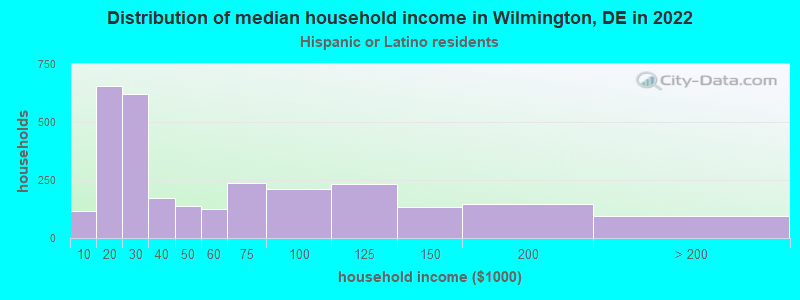
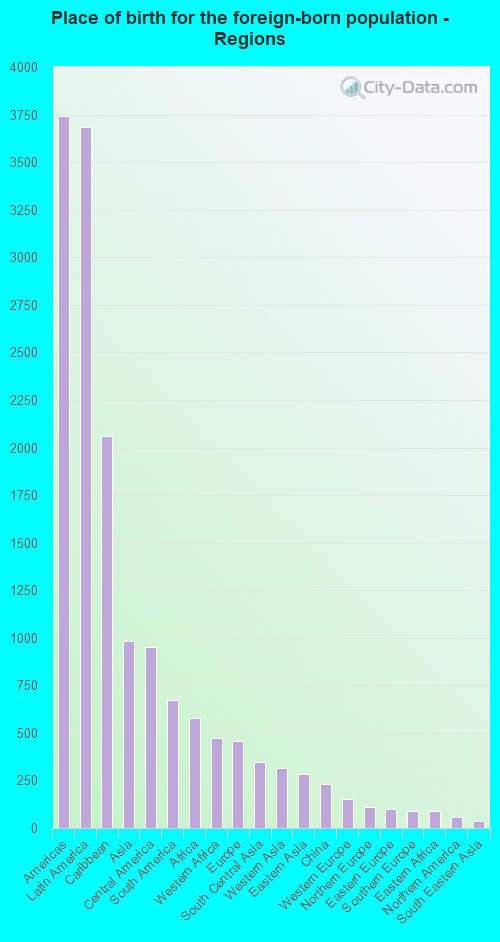
According to 2022 data, the most numerous races in Wilmington, DE are White alone (21,673 residents), Black alone (36,024 residents), and Hispanic (7,943 residents). 88.4% of Wilmington residents speak English at home. 8.1% of Wilmington, DE residents are foreign-born (5.1% born in Latin America, 1.4% born in Asia), which is 11.7% less than the foreign-born rate of 9.0% across the entire state of Delaware.
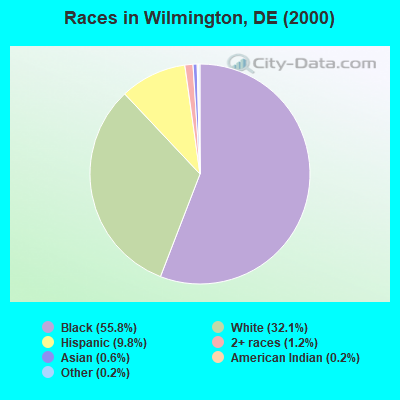
Race distribution in Wilmington
2000 2022
567,973 72.5% White alone 148,435 18.9% Black alone 37,277 4.8% Hispanic 16,110 2.1% Asian alone 10,222 1.3% Two or more races 2,324 0.3% American Indian alone 1,025 0.1% Other race alone 234 0.03% Native Hawaiian and Other
599,347 58.9% White alone 220,010 21.6% Black alone 105,300 10.3% Hispanic 46,016 4.5% Two or more races 41,350 4.1% Asian alone 5,097 0.5% Other race alone 1,276 0.1% American Indian alone
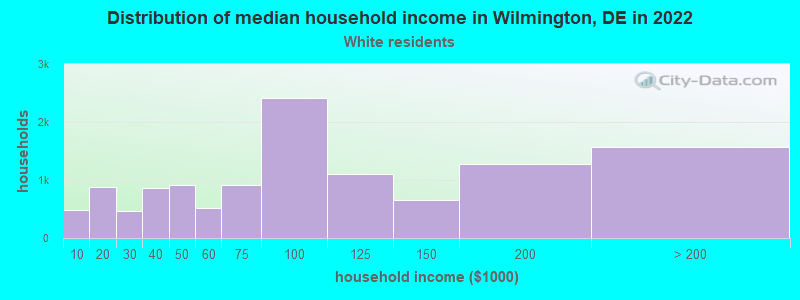
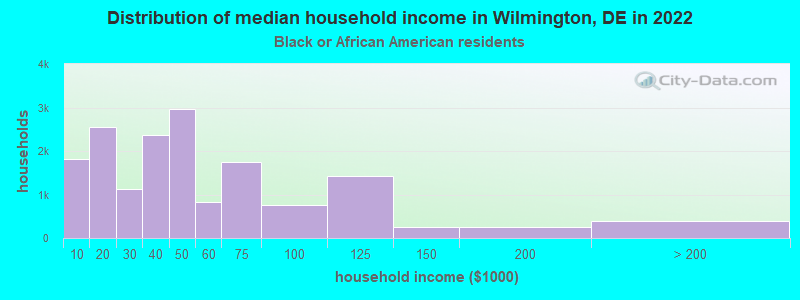
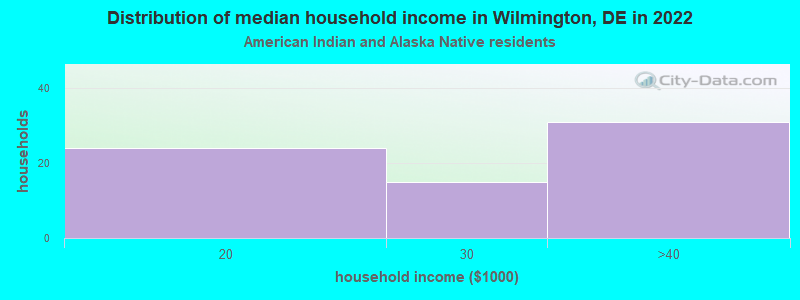
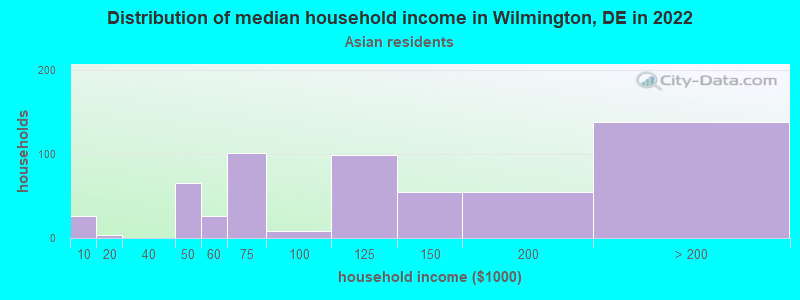
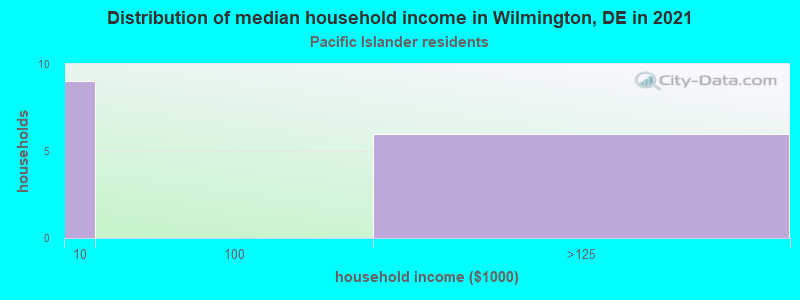
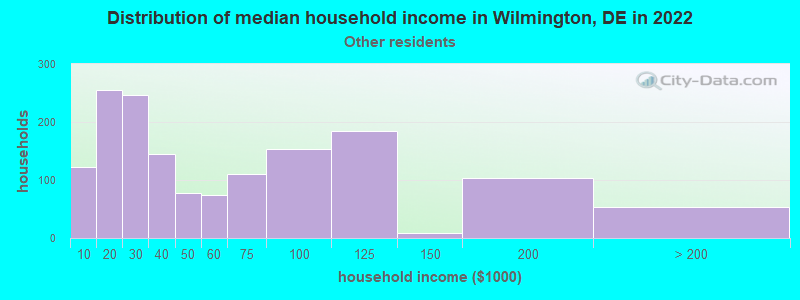
Income and house value in Wilmington Median household income in 2022 $85,141 White non-Hispanic householders$40,732 Black householders$160,035 Asian householders$42,322 Some other race householders$64,615 Two or more races householders$38,209 Hispanic or Latino race householdersMedian 2022 house value $266,697 White Non-Hispanic householders$191,506 Black or African American householders$177,636 American Indian or Alaska Native householders $263,534 Asian householders$176,662 Some other race householders$187,369 Two or more races householders$179,826 Hispanic or Latino householders
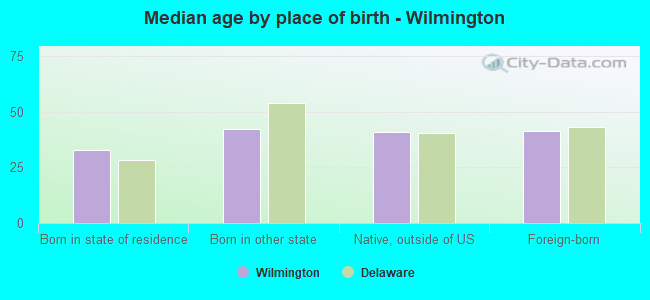
Median age by race in Wilmington
45.0 Median age for White residents40.7 50.3 39.7 Median age for Black or African American residents37.3 40.9 -666,666,666.0 Median age for American Indian / Alaska Native residents-666,666,666.0 -666,666,666.0 35.1 Median age for Asian residents35.5 34.7 -666,666,666.0 Median age for Native Hawaiian / Pacific Islander residents-666,666,666.0 -666,666,666.0 17.7 Median age for Other race residents13.5 24.8 30.5 Median age for Two or more races residents23.3 36.8 45.3 Median age for White alone residents39.9 50.7 29.3 Median age for Hispanic or Latino residents28.2 34.1
Owner/renter occupied households by race in Wilmington
House owners and renters - White residents 8,150 67.8% Owner occupied3,876 32.2% Renter occupiedHouse owners and renters - Black or African American residents 5,466 33.2% Owner occupied10,984 66.8% Renter occupiedHouse owners and renters - American Indian / Alaska Native residents 7 100.0% Owner occupiedHouse owners and renters - Asian residents 66 12.3% Owner occupied476 87.7% Renter occupiedHouse owners and renters - Native Hawaiian / Pacific Islander residents 10 54.1% Owner occupied9 45.9% Renter occupiedHouse owners and renters - Other race residents 657 52.6% Owner occupied592 47.4% Renter occupiedHouse owners and renters - Two or more races residents 683 34.3% Owner occupied1,309 65.7% Renter occupiedHouse owners and renters - White alone residents 7,677 69.0% Owner occupied3,446 31.0% Renter occupiedHouse owners and renters - Hispanic or Latino residents 996 41.6% Owner occupied1,400 58.4% Renter occupied
Language usage in Wilmington
English speakers - Total 88.4% of residents of Wilmington speak English at home.
6.9% of residents speak Spanish at home 2,265 48.3% Speak English very well2,421 51.7% Speak English less than very well4.7% of residents speak other language at home 2,486 78.6% Speak English very well676 21.4% Speak English less than very well
English speakers - Born in the United States 96.8% of residents of Wilmington speak English at home.
1.4% of residents speak Spanish at home 427 100.0% Speak English very well1.8% of residents speak other language at home 457 85.4% Speak English very well78 14.6% Speak English less than very well
English speakers - Native, born elsewhere 28.4% of residents of Wilmington speak English at home.
71.6% of residents speak Spanish at home 370 22.8% Speak English very well1,250 77.2% Speak English less than very well
English speakers - Foreign-born 40.6% of residents of Wilmington speak English at home.
22.6% of residents speak Spanish at home 309 23.9% Speak English very well985 76.1% Speak English less than very well36.7% of residents speak other language at home 1,699 80.9% Speak English very well401 19.1% Speak English less than very well
White (Caucasian) - Speak only English Native:
95.4% (20,573)Foreign-born:
17.5% (328)
White (Caucasian) - Speak another language Native:
4.6% (986)Foreign-born:
82.5% (1,545)
Black or African American - Speak only English Native:
97.8% (32,677)Foreign-born:
55.3% (1,208)
Black or African American - Speak another language Native:
2.2% (739)Foreign-born:
44.7% (977)
Asian - Speak only English Native:
39.9% (112)Foreign-born:
35.4% (253)
Asian - Speak another language Native:
61.0% (172)Foreign-born:
70.3% (501)
Native Hawaiian / Pacific Islander - Speak only English Native:
21.6% (5)Foreign-born:
96.3% (8)
Other race - Speak only English Native:
51.3% (1,505)Foreign-born:
5.2% (65)
Other race - Speak another language Native:
50.4% (1,479)Foreign-born:
88.8% (1,098)
Two or more races - Speak only English Native:
81.7% (2,720)Foreign-born:
63.8% (314)
Two or more races - Speak another language Native:
18.3% (609)Foreign-born:
36.2% (178)
White alone - Speak only English Native:
97.4% (19,609)Foreign-born:
37.4% (328)
White alone - Speak another language Native:
2.6% (522)Foreign-born:
62.6% (550)
Hispanic or Latino - Speak another language Native:
51.8% (2,963)Foreign-born:
100.0% (1,280)
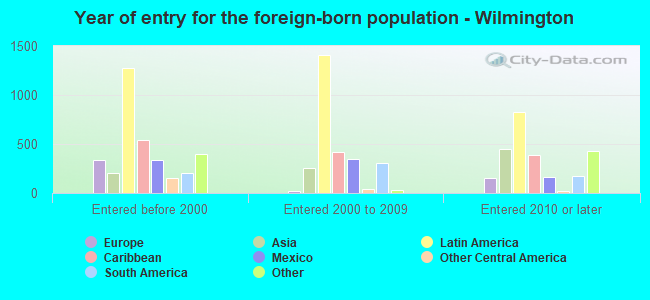
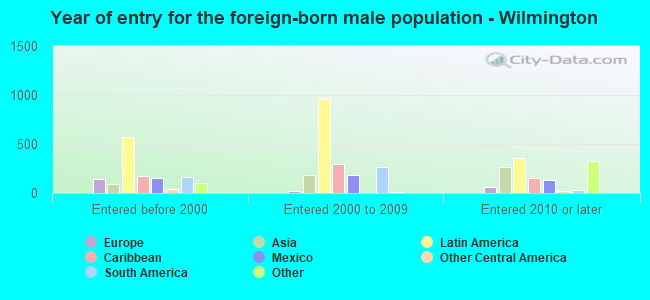
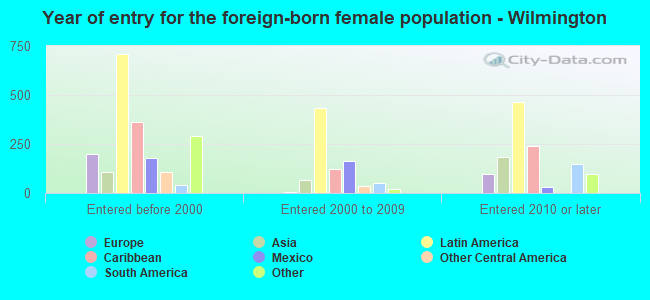
Foreign-born residents in Wilmington 5,771 residents are foreign born (5.1% Latin America , 1.4% Asia ).
This city:
8.1%Delaware:
9.8%
Marital status for residents in Wilmington Marital status - White (Caucasian) population 15 years and over
Males 39.8% Never married42.0% Now married2.3% Separated4.5% Widowed11.4% DivorcedFemales 33.5% Never married35.8% Now married1.3% Separated8.0% Widowed21.3% DivorcedWomen who gave birth in the past 12 months Now married:
100.0% (141)Unmarried:
0.0% (0)
Women who did not give birth in the past 12 months Now married:
34.0% (1,867)Unmarried:
66.0% (3,628)
Marital status - Black or African American population 15 years and over
Males 54.0% Never married17.8% Now married5.4% Separated4.8% Widowed18.0% DivorcedFemales 62.5% Never married10.7% Now married6.2% Separated8.1% Widowed12.6% DivorcedWomen who gave birth in the past 12 months Now married:
88.3% (384)Unmarried:
11.7% (51)
Women who did not give birth in the past 12 months Now married:
12.5% (1,241)Unmarried:
87.5% (8,710)
Marital status - American Indian / Alaska Native population 15 years and over
Males 76.9% Never married7.7% Now married0.0% Separated15.4% Widowed0.0% DivorcedFemales 63.6% Never married22.7% Now married0.0% Separated0.0% Widowed13.6% DivorcedWomen who did not give birth in the past 12 months Now married:
22.7% (6)Unmarried:
77.3% (20)
Marital status - Asian population 15 years and over
Males 76.7% Never married21.3% Now married0.0% Separated0.0% Widowed2.0% DivorcedFemales 60.5% Never married33.3% Now married0.0% Separated3.5% Widowed2.6% DivorcedWomen who gave birth in the past 12 months Now married:
100.0% (22)Unmarried:
0.0% (0)
Women who did not give birth in the past 12 months Now married:
29.7% (112)Unmarried:
70.3% (267)
Marital status - Native Hawaiian / Pacific Islander population 15 years and over
Males 0.0% Never married100.0% Now married0.0% Separated0.0% Widowed0.0% DivorcedFemales 0.0% Never married63.6% Now married36.4% Separated0.0% Widowed0.0% DivorcedWomen who did not give birth in the past 12 months Now married:
100.0% (15)Unmarried:
0.0% (0)
Marital status - Other race population 15 years and over
Males 44.6% Never married42.5% Now married1.8% Separated5.0% Widowed6.1% DivorcedFemales 50.5% Never married33.8% Now married0.8% Separated10.2% Widowed4.7% DivorcedWomen who gave birth in the past 12 months Now married:
0.0% (0)Unmarried:
100.0% (34)
Women who did not give birth in the past 12 months Now married:
27.5% (288)Unmarried:
72.5% (758)
Marital status - Two or more races population 15 years and over
Males 71.6% Never married17.2% Now married1.7% Separated0.0% Widowed9.5% DivorcedFemales 52.9% Never married36.3% Now married4.3% Separated0.2% Widowed6.2% DivorcedWomen who gave birth in the past 12 months Now married:
100.0% (36)Unmarried:
0.0% (0)
Women who did not give birth in the past 12 months Now married:
37.7% (684)Unmarried:
62.3% (1,131)
Marital status - White alone, not Hispanic / Latino population 15 years and over
Males 41.6% Never married42.9% Now married2.6% Separated3.8% Widowed9.1% DivorcedFemales 30.4% Never married36.4% Now married1.4% Separated8.9% Widowed22.8% DivorcedWomen who gave birth in the past 12 months Now married:
100.0% (141)Unmarried:
0.0% (0)
Women who did not give birth in the past 12 months Now married:
39.4% (1,867)Unmarried:
60.6% (2,870)
Marital status - Hispanic or Latino population 15 years and over
Males 55.6% Never married34.6% Now married2.6% Separated3.0% Widowed4.2% DivorcedFemales 40.9% Never married40.5% Now married5.0% Separated5.6% Widowed8.0% DivorcedWomen who gave birth in the past 12 months Now married:
44.3% (29)Unmarried:
55.7% (36)
Women who did not give birth in the past 12 months Now married:
38.6% (796)Unmarried:
61.4% (1,264)
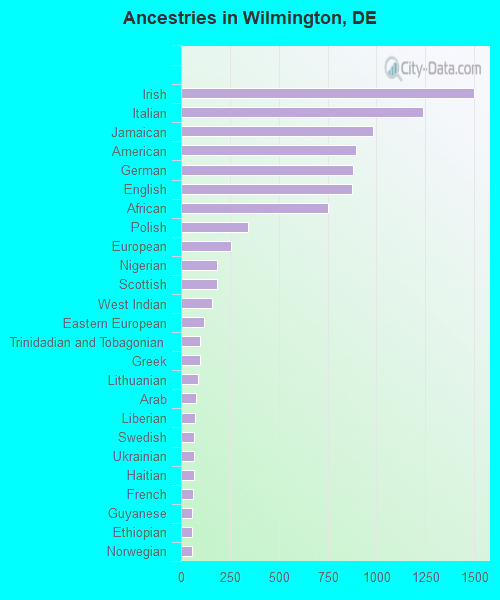
Ancestries in Wilmington
1,501 4.3% Irish1,237 3.5% Italian981 2.8% Jamaican897 2.6% American880 2.5% German876 2.5% English753 2.2% African341 1.0% Polish258 0.7% European185 0.5% Nigerian185 0.5% Scottish158 0.5% West Indian118 0.3% Eastern European95 0.3% Trinidadian and Tobagonian95 0.3% Greek87 0.2% Lithuanian75 0.2% Arab73 0.2% Liberian69 0.2% Swedish65 0.2% Ukrainian65 0.2% Haitian63 0.2% French58 0.2% Guyanese56 0.2% Ethiopian54 0.2% Norwegian45 0.1% Bermudan29 0.08% Slovak29 0.08% German Russian26 0.07% Finnish20 0.06% Czechoslovakian20 0.06% Austrian20 0.06% Ghanaian20 0.06% Welsh18 0.05% Turkish18 0.05% Scotch-Irish14 0.04% Israeli13 0.04% British13 0.04% Jordanian12 0.03% Portuguese12 0.03% Lebanese11 0.03% Slavic11 0.03% Czech10 0.03% Sudanese10 0.03% Armenian9 0.03% Slovene9 0.03% Swiss9 0.03% British West Indian8 0.02% Kenyan7 0.02% Dutch6 0.02% Iranian6 0.02% Alsatian5 0.01% Croatian5 0.01% Canadian5 0.01% Pennsylvania German4 0.01% Romanian4 0.01% Northern European4 0.01% Serbian3 0.01% Russian3 0.01% Egyptian2 0.01% Hungarian
Geographical mobility in Wilmington Same house 1 year ago 18,878 78.5% White (Caucasian)32,376 87.7% Black or African American47 84.9% American Indian / Alaska Native667 68.9% Asian5 16.3% Native Hawaiian / Pacific Islander3,912 88.4% Other race4,791 87.5% Two or more races17,272 79.9% White alone, not Hispanic / Latino7,039 83.9% Hispanic or LatinoMoved within same county 2,531 10.5% White / Caucasian3,076 8.3% Black or African American7 13.5% American Indian / Alaska Native66 6.9% Asian508 11.5% Other race358 6.5% Two or more races2,500 11.6% White alone, not Hispanic / Latino775 9.2% Hispanic or LatinoMoved within same state 72 0.3% White / Caucasian124 0.3% Black or African American29 87.9% Native Hawaiian / Pacific Islander18 0.4% Other race17 0.3% Two or more races51 0.2% White alone, not Hispanic / Latino138 1.7% Hispanic or LatinoMoved from different state 2,565 10.7% White / Caucasian888 2.4% Black or African American136 14.1% Asian46 1.0% Other race306 5.6% Two or more races1,800 8.3% White alone, not Hispanic / Latino429 5.1% Hispanic or LatinoMoved from abroad 439 1.2% Black or African American70 7.2% Asian15 0.3% Other race29 0.3% Hispanic or Latino
Children Nativity (place of birth) in Wilmington
Children under 6 years - Living with two parents Both parents native 1,038 100.0% NativeBoth parents foreign-born 106 77.4% Native31 22.6% Foreign-bornOne native, one foreign-born parent 348 100.0% NativeChildren under 6 years - Living with one parent Native parent 2,857 99.4% Native18 0.6% Foreign-bornForeign-born parent 161 74.5% Native55 25.5% Foreign-bornChildren 6 to 17 years - Living with two parents Both parents native 1,862 99.4% Native11 0.6% Foreign-bornBoth parents foreign-born 972 93.8% Native64 6.2% Foreign-bornOne native, one foreign-born parent 282 100.0% NativeChildren 6 to 17 years - Living with one parent Native parent 5,677 100.0% NativeForeign-born parent 583 58.2% Native419 41.8% Foreign-born
Grandparents responsible for own grandchildren in Wilmington
Grandparents (30 to 59 years) White / Caucasian 5 17.2% Responsible for grandchildren23 82.8% Not responsible for grandchildrenBlack or African American 321 43.1% Responsible for grandchildren423 56.9% Not responsible for grandchildrenOther race 1 2.4% Responsible for grandchildren45 97.6% Not responsible for grandchildrenTwo or more races 88 85.9% Responsible for grandchildren14 14.1% Not responsible for grandchildrenWhite alone, not Hispanic / Latino 6 32.8% Responsible for grandchildren11 67.2% Not responsible for grandchildrenHispanic or Latino 1 1.0% Responsible for grandchildren98 99.0% Not responsible for grandchildrenGrandparents (60 years and over) White / Caucasian 31 31.8% Responsible for grandchildren67 68.2% Not responsible for grandchildrenBlack or African American 651 81.5% Responsible for grandchildren148 18.5% Not responsible for grandchildrenOther race 157 54.6% Responsible for grandchildren130 45.4% Not responsible for grandchildrenTwo or more races 38 100.0% Not responsible for grandchildrenWhite alone, not Hispanic / Latino 32 37.3% Responsible for grandchildren55 62.7% Not responsible for grandchildrenHispanic or Latino 109 51.7% Responsible for grandchildren102 48.3% Not responsible for grandchildren