Work and Jobs in Wilmington, Delaware (DE) Detailed Stats
Occupations, Industries, Unemployment, Workers, Commute
Settings
X


Recent posts about work in Wilmington, Delaware on our local forum with over 2,400,000 registered users:

Latest news about work in Wilmington, DE collected exclusively by city-data.com from local newspapers, TV, and radio stations
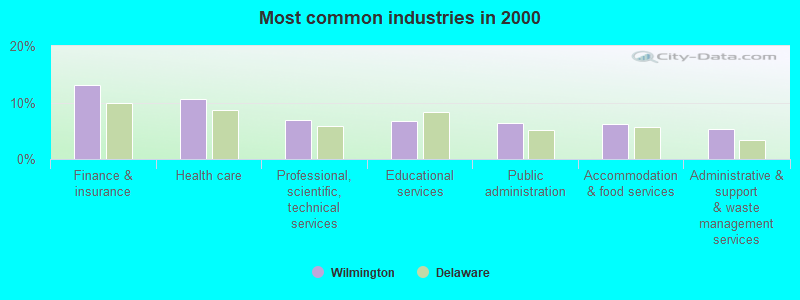
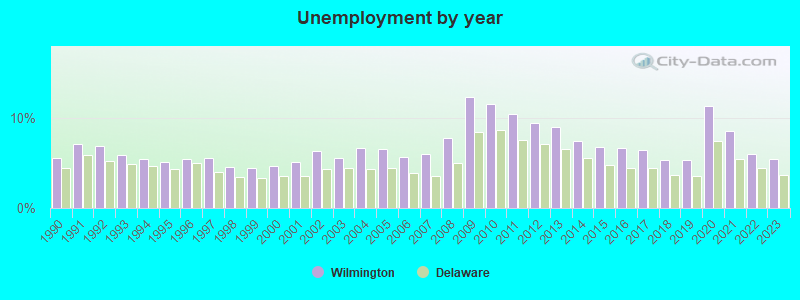
The unemployment rate in 2023 in Wilmington, DE was 5.4%, which was 31.5% greater than the unemployment rate of 3.7% across the entire state of Delaware. Compared to the unemployment rate of 9.0% in 2013, this represents a decrease of 66.7%. The most common industries in Wilmington are: Finance & insurance (13.1% of civilian employees), Health care (10.5% of civilian employees), Professional, scientific, technical services (6.9% of civilian employees). 85.9% of workers work in New Castle County and 11.9% of all workers work at home. 62.3% of workers are employees of private companies, which is 7.9% less than the rate of 67.1% across the entire state of Delaware.
Whole page based on the data from 2000 / 2022 when the population of Wilmington, Delaware was 72,664 / 71,568
Whole page based on the data from 2000 / 2022 when the population of Wilmington, Delaware was 72,664 / 71,568
Most common industries
Most common industries | |||
|---|---|---|---|
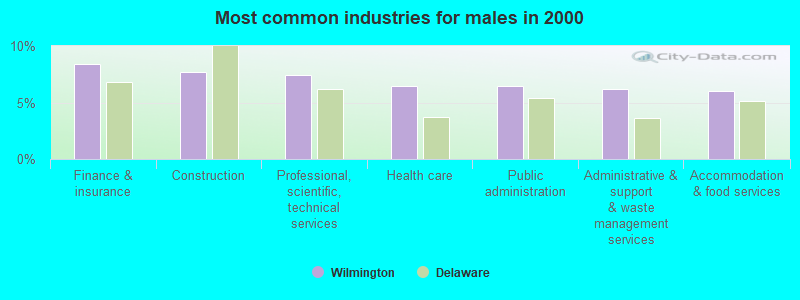
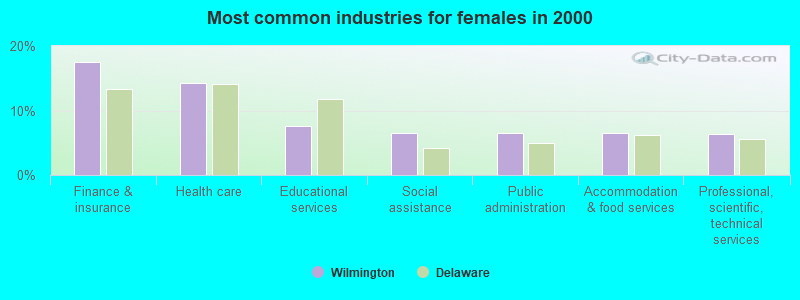
Industry | All | Males | Females |
| Finance and insurance | 13.1% (3,986) | 8.4% (1,229) | 17.5% (2,757) |
| Health care | 10.5% (3,206) | 6.5% (950) | 14.3% (2,256) |
| Professional, scientific, and technical services | 6.9% (2,105) | 7.5% (1,095) | 6.4% (1,010) |
| Educational services | 6.7% (2,031) | 5.8% (845) | 7.5% (1,186) |
| Public administration | 6.4% (1,958) | 6.4% (941) | 6.5% (1,017) |
| Accommodation and food services | 6.3% (1,901) | 6.0% (886) | 6.4% (1,015) |
| Administrative and support and waste management services | 5.4% (1,634) | 6.2% (907) | 4.6% (727) |
| Construction | 4.2% (1,285) | 7.7% (1,131) | 1.0% (154) |
| Social assistance | 3.9% (1,180) | 1.0% (153) | 6.5% (1,027) |
| Chemicals | 2.6% (805) | 2.6% (383) | 2.7% (422) |
| Arts, entertainment, and recreation | 2.2% (679) | 2.6% (385) | 1.9% (294) |
| Food and beverage stores | 2.0% (622) | 2.9% (431) | 1.2% (191) |
| Religious, grantmaking, civic, professional, and similar organizations | 1.9% (563) | 1.6% (230) | 2.1% (333) |
| Real estate and rental and leasing | 1.8% (558) | 1.6% (232) | 2.1% (326) |
| Personal and laundry services | 1.8% (557) | 1.1% (158) | 2.5% (399) |
| Department and other general merchandise stores | 1.8% (544) | 1.5% (222) | 2.0% (322) |
| Transportation equipment | 1.5% (442) | 2.1% (301) | 0.9% (141) |
| Food | 1.2% (374) | 1.2% (177) | 1.3% (197) |
| Motor vehicle and parts dealers | 1.2% (364) | 2.2% (327) | 0.2% (37) |
| Miscellaneous manufacturing | 1.1% (333) | 1.3% (186) | 0.9% (147) |
| Other transportation, and support activities, and couriers | 1.0% (310) | 1.9% (274) | 0.2% (36) |
| Broadcasting and telecommunications | 1.0% (309) | 0.9% (136) | 1.1% (173) |
| Repair and maintenance | 0.9% (266) | 1.7% (249) | 0.1% (17) |
| Publishing, and motion picture and sound recording industries | 0.7% (212) | 0.6% (94) | 0.7% (118) |
| Utilities | 0.7% (208) | 0.9% (132) | 0.5% (76) |
| U. S. Postal service | 0.7% (202) | 0.9% (135) | 0.4% (67) |
| Metal and metal products | 0.6% (193) | 1.2% (176) | 0.1% (17) |
| Truck transportation | 0.6% (192) | 1.3% (185) | 0.0% (7) |
| Data processing, libraries, and other information services | 0.6% (178) | 0.3% (50) | 0.8% (128) |
| Plastics and rubber products | 0.6% (173) | 0.7% (102) | 0.5% (71) |
| Clothing and accessories, including shoe, stores | 0.5% (151) | 0.3% (51) | 0.6% (100) |
| Furniture and home furnishings, and household appliance stores | 0.5% (146) | 0.7% (108) | 0.2% (38) |
| Other direct selling establishments | 0.5% (145) | 0.7% (97) | 0.3% (48) |
| Used merchandise, gift, novelty, and souvenir, and other miscellaneous stores | 0.4% (134) | 0.4% (62) | 0.5% (72) |
| Building material and garden equipment and supplies dealers | 0.4% (123) | 0.4% (52) | 0.5% (71) |
| Pharmacies and drug stores | 0.4% (116) | 0.3% (40) | 0.5% (76) |
| Rail transportation | 0.4% (109) | 0.6% (86) | 0.1% (23) |
| Private households | 0.3% (103) | 0.1% (12) | 0.6% (91) |
| Miscellaneous nondurable goods merchant wholesalers | 0.3% (84) | 0.3% (45) | 0.2% (39) |
| Groceries and related products merchant wholesalers | 0.3% (82) | 0.5% (76) | 0.0% (6) |
| Electronic shopping and mail-order houses | 0.3% (81) | 0.3% (38) | 0.3% (43) |
| Furniture and related product manufacturing | 0.3% (80) | 0.3% (49) | 0.2% (31) |
| Nonmetallic mineral products | 0.3% (77) | 0.3% (50) | 0.2% (27) |
| Sporting goods, camera, and hobby and toy stores | 0.2% (74) | 0.5% (74) | 0.0% (0) |
| Machinery | 0.2% (73) | 0.5% (73) | 0.0% (0) |
| Drugs, sundries, and chemical and allied products merchant wholesalers | 0.2% (71) | 0.2% (34) | 0.2% (37) |
| Agriculture, forestry, fishing and hunting | 0.2% (69) | 0.3% (49) | 0.1% (20) |
| Textile mills and textile products | 0.2% (68) | 0.3% (49) | 0.1% (19) |
| Paper | 0.2% (68) | 0.5% (68) | 0.0% (0) |
| Printing and related support activities | 0.2% (66) | 0.4% (66) | 0.0% (0) |
| Furniture and home furnishing merchant wholesalers | 0.2% (63) | 0.4% (63) | 0.0% (0) |
| Warehousing and storage | 0.2% (62) | 0.4% (54) | 0.1% (8) |
| Computer and electronic products | 0.2% (61) | 0.3% (38) | 0.1% (23) |
| Air transportation | 0.2% (60) | 0.4% (54) | 0.0% (6) |
| Radio, TV, and computer stores | 0.2% (54) | 0.3% (47) | 0.0% (7) |
| Gasoline stations | 0.2% (53) | 0.3% (48) | 0.0% (5) |
| Electrical and electronic goods merchant wholesalers | 0.2% (52) | 0.3% (44) | 0.1% (8) |
| Office supplies and stationery stores | 0.2% (51) | 0.2% (30) | 0.1% (21) |
| Professional and commercial equipment and supplies merchant wholesalers | 0.1% (44) | 0.2% (30) | 0.1% (14) |
| Farm product raw materials merchant wholesalers | 0.1% (42) | 0.1% (17) | 0.2% (25) |
| Apparel | 0.1% (38) | 0.1% (10) | 0.2% (28) |
| Book stores and news dealers | 0.1% (38) | 0.0% (5) | 0.2% (33) |
| Management of companies and enterprises | 0.1% (37) | 0.1% (8) | 0.2% (29) |
| Recyclable material merchant wholesalers | 0.1% (37) | 0.3% (37) | 0.0% (0) |
| Alcoholic beverages merchant wholesalers | 0.1% (37) | 0.3% (37) | 0.0% (0) |
| Retail florists | 0.1% (36) | 0.2% (27) | 0.1% (9) |
| Health and personal care, except drug, stores | 0.1% (35) | 0.1% (22) | 0.1% (13) |
| Jewelry, luggage, and leather goods stores | 0.1% (34) | 0.1% (10) | 0.2% (24) |
| Hardware, plumbing and heating equipment, and supplies merchant wholesalers | 0.1% (32) | 0.2% (25) | 0.0% (7) |
| Electrical equipment, appliances, and components | 0.1% (30) | 0.2% (24) | 0.0% (6) |
| Motor vehicles, parts and supplies merchant wholesalers | 0.1% (29) | 0.2% (23) | 0.0% (6) |
| Petroleum and coal products | 0.1% (27) | 0.1% (19) | 0.1% (8) |
| Music stores | 0.1% (26) | 0.1% (19) | 0.0% (7) |
| Petroleum and petroleum products merchant wholesalers | 0.1% (24) | 0.2% (24) | 0.0% (0) |
| Miscellaneous durable goods merchant wholesalers | 0.1% (24) | 0.1% (18) | 0.0% (6) |
| Wood products | 0.1% (17) | 0.1% (17) | 0.0% (0) |
Unemployment in Wilmington
- Unemployment by race in 2022
- Unemployment rate for White non-Hispanic residents
- 0.5%Males
- 5.2%Females
- Unemployment rate for Black residents
- 7.2%Males
- 2.1%Females
- Unemployment rate for Asian residents
- 1.5%Males
- 1.4%Females
- Unemployment rate for two or more race residents
- 3.8%Males
- 13.2%Females
- Unemployment rate for Hispanic or Latino residents
- 2.8%Males
- 10.1%Females
- Unemployment by race in 2000
- Unemployment rate for White non-Hispanic residents
- 4.3%Males
- 2.1%Females
- Unemployment rate for Black residents
- 14.0%Males
- 12.7%Females
- Unemployment rate for American Indian and Alaska Native residents
- 13.0%Males
- 7.9%Females
- Unemployment rate for Asian residents
- 2.8%Males
- 12.8%Females
- Unemployment rate for other race residents
- 12.3%Males
- 11.5%Females
- Unemployment rate for two or more race residents
- 17.1%Males
- 24.8%Females
- Unemployment rate for Hispanic or Latino residents
- 15.4%Males
- 14.5%Females
Unemployment in 2023:
| Wilmington: | 5.4% |
| Delaware: | 3.7% |
Unemployment in 2022:
| Wilmington: | 6.0% |
| Delaware: | 4.5% |
Unemployment in 2021:
| Wilmington: | 8.6% |
| Delaware: | 5.5% |
Unemployment in 2020:
| Wilmington: | 11.3% |
| Delaware: | 7.5% |
Unemployment in 2019:
| Wilmington: | 5.3% |
| Delaware: | 3.6% |
Unemployment in 2018:
| Wilmington: | 5.3% |
| Delaware: | 3.7% |
Unemployment in 2017:
| Wilmington: | 6.4% |
| Delaware: | 4.5% |
Unemployment in 2016:
| Wilmington: | 6.7% |
| Delaware: | 4.5% |
Unemployment in 2015:
| Wilmington: | 6.8% |
| Delaware: | 4.8% |
Unemployment in 2014:
| Wilmington: | 7.5% |
| Delaware: | 5.6% |
Unemployment in 2013:
| Wilmington: | 9.0% |
| Delaware: | 6.6% |
Unemployment in 2012:
| Wilmington: | 9.5% |
| Delaware: | 7.1% |
Unemployment in 2011:
| Wilmington: | 10.5% |
| Delaware: | 7.6% |
Unemployment in 2010:
| Wilmington: | 11.6% |
| Delaware: | 8.7% |
Unemployment in 2009:
| Wilmington: | 12.3% |
| Delaware: | 8.4% |
Unemployment in 2008:
| Wilmington: | 7.8% |
| Delaware: | 5.0% |
Unemployment in 2007:
| Wilmington: | 6.0% |
| Delaware: | 3.6% |
Unemployment in 2006:
| Wilmington: | 5.7% |
| Delaware: | 3.9% |
Unemployment in 2005:
| Wilmington: | 6.6% |
| Delaware: | 4.5% |
Unemployment in 2004:
| Wilmington: | 6.7% |
| Delaware: | 4.3% |
Unemployment in 2003:
| Wilmington: | 5.6% |
| Delaware: | 4.5% |
Unemployment in 2002:
| Wilmington: | 6.3% |
| Delaware: | 4.3% |
Unemployment in 2001:
| Wilmington: | 5.1% |
| Delaware: | 3.6% |
Unemployment in 2000:
| Wilmington: | 4.7% |
| Delaware: | 3.6% |
Unemployment in 1999:
| Wilmington: | 4.5% |
| Delaware: | 3.3% |
Unemployment in 1998:
| Wilmington: | 4.6% |
| Delaware: | 3.5% |
Unemployment in 1997:
| Wilmington: | 5.6% |
| Delaware: | 4.0% |
Unemployment in 1996:
| Wilmington: | 5.5% |
| Delaware: | 5.0% |
Unemployment in 1995:
| Wilmington: | 5.1% |
| Delaware: | 4.3% |
Unemployment in 1994:
| Wilmington: | 5.4% |
| Delaware: | 4.7% |
Unemployment in 1993:
| Wilmington: | 5.9% |
| Delaware: | 4.9% |
Unemployment in 1992:
| Wilmington: | 6.9% |
| Delaware: | 5.2% |
Unemployment in 1991:
| Wilmington: | 7.1% |
| Delaware: | 5.9% |
Unemployment in 1990:
| Wilmington: | 5.6% |
| Delaware: | 4.4% |
Time leaving home to go to work
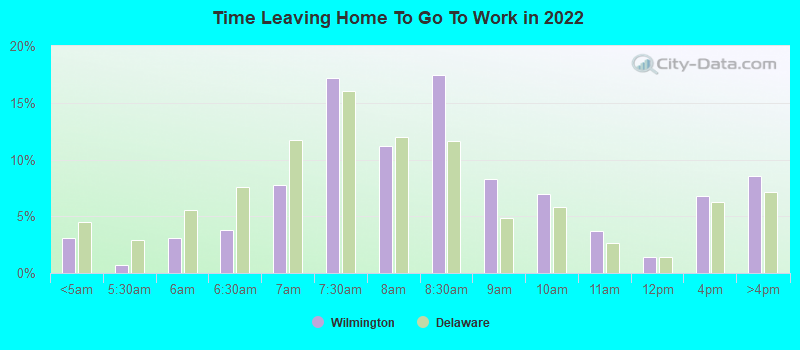
12:00 a.m. to 4:59 a.m.:
| Wilmington: | 3.1% (925) |
| Delaware: | 4.5% (18,770) |
5:00 a.m. to 5:29 a.m.:
| Wilmington: | 0.7% (212) |
| Delaware: | 2.9% (12,265) |
5:30 a.m. to 5:59 a.m.:
| Wilmington: | 3.1% (931) |
| Delaware: | 5.5% (23,080) |
6:00 a.m. to 6:29 a.m.:
| Wilmington: | 3.8% (1,137) |
| Delaware: | 7.6% (31,782) |
6:30 a.m. to 6:59 a.m.:
| Wilmington: | 7.8% (2,338) |
| Delaware: | 11.7% (48,961) |
7:00 a.m. to 7:29 a.m.:
| Wilmington: | 17.2% (5,185) |
| Delaware: | 16.0% (67,035) |
7:30 a.m. to 7:59 a.m.:
| Wilmington: | 11.2% (3,374) |
| Delaware: | 12.0% (49,956) |
8:00 a.m. to 8:29 a.m.:
| Wilmington: | 17.4% (5,244) |
| Delaware: | 11.6% (48,568) |
8:30 a.m. to 8:59 a.m.:
| Wilmington: | 8.3% (2,498) |
| Delaware: | 4.8% (20,249) |
9:00 a.m. to 9:59 a.m.:
| Wilmington: | 7.0% (2,106) |
| Delaware: | 5.8% (24,361) |
10:00 a.m. to 10:59 a.m.:
| Wilmington: | 3.7% (1,105) |
| Delaware: | 2.6% (11,055) |
11:00 a.m. to 11:59 a.m.:
| Wilmington: | 1.5% (437) |
| Delaware: | 1.4% (5,871) |
12:00 p.m. to 3:59 p.m.:
| Wilmington: | 6.8% (2,046) |
| Delaware: | 6.2% (26,082) |
4:00 p.m. to 11:59 p.m.:
| Wilmington: | 8.5% (2,573) |
| Delaware: | 7.1% (29,682) |

<5am:
| Wilmington: | 2.9% (857) |
| Delaware: | 2.8% (10,365) |
5:30am:
| Wilmington: | 1.2% (363) |
| Delaware: | 2.2% (8,081) |
6am:
| Wilmington: | 3.2% (937) |
| Delaware: | 3.5% (13,243) |
6:30am:
| Wilmington: | 7.1% (2,095) |
| Delaware: | 7.7% (28,805) |
7am:
| Wilmington: | 9.7% (2,871) |
| Delaware: | 11.4% (42,698) |
7:30am:
| Wilmington: | 13.1% (3,893) |
| Delaware: | 16.6% (61,926) |
8am:
| Wilmington: | 17.5% (5,194) |
| Delaware: | 16.2% (60,395) |
8:30am:
| Wilmington: | 14.4% (4,288) |
| Delaware: | 10.6% (39,554) |
9am:
| Wilmington: | 6.9% (2,050) |
| Delaware: | 5.0% (18,691) |
10am:
| Wilmington: | 5.1% (1,527) |
| Delaware: | 4.7% (17,404) |
11am:
| Wilmington: | 2.0% (580) |
| Delaware: | 2.0% (7,556) |
12pm:
| Wilmington: | 1.1% (327) |
| Delaware: | 1.0% (3,667) |
4pm:
| Wilmington: | 7.4% (2,198) |
| Delaware: | 6.9% (25,586) |
>4pm:
| Wilmington: | 5.8% (1,725) |
| Delaware: | 6.4% (24,008) |

12:00 a.m. to 4:59 a.m. - Males:
| Wilmington: | 3.8% (569) |
| Delaware: | 6.1% (13,359) |
5:00 a.m. to 5:29 a.m. - Males:
| Wilmington: | 1.2% (174) |
| Delaware: | 4.3% (9,377) |
5:30 a.m. to 5:59 a.m. - Males:
| Wilmington: | 4.4% (665) |
| Delaware: | 7.0% (15,329) |
6:00 a.m. to 6:29 a.m. - Males:
| Wilmington: | 2.7% (413) |
| Delaware: | 9.1% (19,990) |
6:30 a.m. to 6:59 a.m. - Males:
| Wilmington: | 7.8% (1,177) |
| Delaware: | 11.8% (26,094) |
7:00 a.m. to 7:29 a.m. - Males:
| Wilmington: | 21.8% (3,286) |
| Delaware: | 15.5% (34,275) |
7:30 a.m. to 7:59 a.m. - Males:
| Wilmington: | 5.2% (780) |
| Delaware: | 10.2% (22,481) |
8:00 a.m. to 8:29 a.m. - Males:
| Wilmington: | 18.5% (2,790) |
| Delaware: | 10.4% (23,027) |
8:30 a.m. to 8:59 a.m. - Males:
| Wilmington: | 12.7% (1,915) |
| Delaware: | 4.4% (9,640) |
9:00 a.m. to 9:59 a.m. - Males:
| Wilmington: | 5.1% (769) |
| Delaware: | 4.9% (10,697) |
10:00 a.m. to 10:59 a.m. - Males:
| Wilmington: | 0.9% (137) |
| Delaware: | 2.4% (5,315) |
11:00 a.m. to 11:59 a.m. - Males:
| Wilmington: | 1.7% (257) |
| Delaware: | 1.1% (2,526) |
12:00 p.m. to 3:59 p.m. - Males:
| Wilmington: | 3.9% (591) |
| Delaware: | 5.4% (12,011) |
4:00 p.m. to 11:59 p.m. - Males:
| Wilmington: | 10.1% (1,526) |
| Delaware: | 7.4% (16,430) |

12:00 a.m. to 4:59 a.m. - Females:
| Wilmington: | 2.4% (356) |
| Delaware: | 2.7% (5,411) |
5:00 a.m. to 5:29 a.m. - Females:
| Wilmington: | 0.3% (38) |
| Delaware: | 1.5% (2,888) |
5:30 a.m. to 5:59 a.m. - Females:
| Wilmington: | 1.8% (266) |
| Delaware: | 3.9% (7,751) |
6:00 a.m. to 6:29 a.m. - Females:
| Wilmington: | 4.8% (724) |
| Delaware: | 6.0% (11,792) |
6:30 a.m. to 6:59 a.m. - Females:
| Wilmington: | 7.7% (1,161) |
| Delaware: | 11.6% (22,867) |
7:00 a.m. to 7:29 a.m. - Females:
| Wilmington: | 12.6% (1,899) |
| Delaware: | 16.6% (32,760) |
7:30 a.m. to 7:59 a.m. - Females:
| Wilmington: | 17.2% (2,594) |
| Delaware: | 13.9% (27,475) |
8:00 a.m. to 8:29 a.m. - Females:
| Wilmington: | 16.3% (2,454) |
| Delaware: | 13.0% (25,541) |
8:30 a.m. to 8:59 a.m. - Females:
| Wilmington: | 3.9% (583) |
| Delaware: | 5.4% (10,609) |
9:00 a.m. to 9:59 a.m. - Females:
| Wilmington: | 8.9% (1,337) |
| Delaware: | 6.9% (13,664) |
10:00 a.m. to 10:59 a.m. - Females:
| Wilmington: | 6.4% (968) |
| Delaware: | 2.9% (5,740) |
11:00 a.m. to 11:59 a.m. - Females:
| Wilmington: | 1.2% (180) |
| Delaware: | 1.7% (3,345) |
12:00 p.m. to 3:59 p.m. - Females:
| Wilmington: | 9.7% (1,455) |
| Delaware: | 7.1% (14,071) |
4:00 p.m. to 11:59 p.m. - Females:
| Wilmington: | 7.0% (1,047) |
| Delaware: | 6.7% (13,252) |
Travel time to work
Percentage of workers working in this county: 85.9%
Number of people working at home: 4,147 (11.9% of all workers)
Daytime population change due to commuting: +28,387 (+39.1%)
Workers who live and work in this city: 12,674 (42.7%)
Number of people working at home: 4,147 (11.9% of all workers)
Daytime population change due to commuting: +28,387 (+39.1%)
Workers who live and work in this city: 12,674 (42.7%)

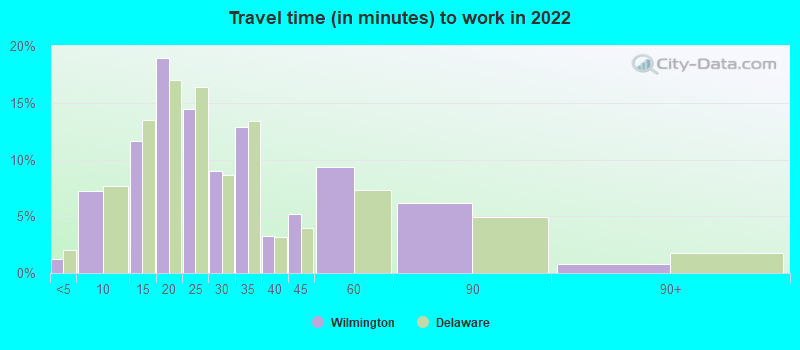

Less than 5 minutes:
| Wilmington: | 1.2% (504) |
| Delaware: | 2.1% (8,409) |
5 to 9 minutes:
| Wilmington: | 7.2% (3,024) |
| Delaware: | 7.7% (31,449) |
10 to 14 minutes:
| Wilmington: | 11.6% (4,878) |
| Delaware: | 13.5% (55,392) |
15 to 19 minutes:
| Wilmington: | 18.9% (7,930) |
| Delaware: | 17.0% (69,782) |
20 to 24 minutes:
| Wilmington: | 14.5% (6,069) |
| Delaware: | 16.4% (67,241) |
25 to 29 minutes:
| Wilmington: | 9.0% (3,768) |
| Delaware: | 8.6% (35,245) |
30 to 34 minutes:
| Wilmington: | 12.9% (5,413) |
| Delaware: | 13.4% (55,018) |
35 to 39 minutes:
| Wilmington: | 3.2% (1,360) |
| Delaware: | 3.2% (13,116) |
40 to 44 minutes:
| Wilmington: | 5.2% (2,186) |
| Delaware: | 4.0% (16,358) |
45 to 59 minutes:
| Wilmington: | 9.3% (3,913) |
| Delaware: | 7.3% (30,098) |
60 to 89 minutes:
| Wilmington: | 6.1% (2,572) |
| Delaware: | 5.0% (20,366) |
90 or more minutes:
| Wilmington: | 0.8% (342) |
| Delaware: | 1.8% (7,388) |


Less than 5 minutes:
| Wilmington: | 2.3% (685) |
| Delaware: | 2.6% (9,817) |
5 to 9 minutes:
| Wilmington: | 10.5% (3,109) |
| Delaware: | 9.9% (37,056) |
10 to 14 minutes:
| Wilmington: | 18.1% (5,384) |
| Delaware: | 15.2% (56,533) |
15 to 19 minutes:
| Wilmington: | 19.9% (5,898) |
| Delaware: | 17.5% (65,194) |
20 to 24 minutes:
| Wilmington: | 16.8% (4,979) |
| Delaware: | 16.5% (61,600) |
25 to 29 minutes:
| Wilmington: | 5.0% (1,496) |
| Delaware: | 6.7% (25,011) |
30 to 34 minutes:
| Wilmington: | 10.9% (3,230) |
| Delaware: | 12.0% (44,932) |
35 to 39 minutes:
| Wilmington: | 1.5% (435) |
| Delaware: | 2.3% (8,671) |
40 to 44 minutes:
| Wilmington: | 1.5% (446) |
| Delaware: | 2.6% (9,805) |
45 to 59 minutes:
| Wilmington: | 4.4% (1,315) |
| Delaware: | 5.6% (20,867) |
60 to 89 minutes:
| Wilmington: | 4.1% (1,212) |
| Delaware: | 3.8% (14,200) |
90 or more minutes:
| Wilmington: | 2.4% (716) |
| Delaware: | 2.2% (8,293) |

Less than 5 minutes - Males:
| Wilmington: | 1.7% (357) |
| Delaware: | 2.3% (4,903) |
5 to 9 minutes - Males:
| Wilmington: | 6.6% (1,379) |
| Delaware: | 8.6% (18,396) |
10 to 14 minutes - Males:
| Wilmington: | 11.2% (2,339) |
| Delaware: | 11.6% (24,818) |
15 to 19 minutes - Males:
| Wilmington: | 15.7% (3,298) |
| Delaware: | 17.4% (37,217) |
20 to 24 minutes - Males:
| Wilmington: | 17.2% (3,600) |
| Delaware: | 16.0% (34,220) |
25 to 29 minutes - Males:
| Wilmington: | 8.3% (1,737) |
| Delaware: | 7.8% (16,811) |
30 to 34 minutes - Males:
| Wilmington: | 10.9% (2,281) |
| Delaware: | 12.7% (27,253) |
35 to 39 minutes - Males:
| Wilmington: | 2.7% (556) |
| Delaware: | 3.0% (6,533) |
40 to 44 minutes - Males:
| Wilmington: | 3.7% (776) |
| Delaware: | 3.6% (7,706) |
45 to 59 minutes - Males:
| Wilmington: | 11.8% (2,462) |
| Delaware: | 8.4% (17,960) |
60 to 89 minutes - Males:
| Wilmington: | 9.3% (1,945) |
| Delaware: | 6.1% (13,080) |
90 or more minutes - Males:
| Wilmington: | 1.0% (219) |
| Delaware: | 2.5% (5,310) |

Less than 5 minutes - Females:
| Wilmington: | 0.7% (147) |
| Delaware: | 1.8% (3,506) |
5 to 9 minutes - Females:
| Wilmington: | 7.8% (1,645) |
| Delaware: | 6.7% (13,053) |
10 to 14 minutes - Females:
| Wilmington: | 12.1% (2,539) |
| Delaware: | 15.6% (30,574) |
15 to 19 minutes - Females:
| Wilmington: | 22.0% (4,632) |
| Delaware: | 16.6% (32,565) |
20 to 24 minutes - Females:
| Wilmington: | 11.8% (2,469) |
| Delaware: | 16.9% (33,021) |
25 to 29 minutes - Females:
| Wilmington: | 9.7% (2,031) |
| Delaware: | 9.4% (18,434) |
30 to 34 minutes - Females:
| Wilmington: | 14.9% (3,132) |
| Delaware: | 14.2% (27,765) |
35 to 39 minutes - Females:
| Wilmington: | 3.8% (804) |
| Delaware: | 3.4% (6,583) |
40 to 44 minutes - Females:
| Wilmington: | 6.7% (1,410) |
| Delaware: | 4.4% (8,652) |
45 to 59 minutes - Females:
| Wilmington: | 6.9% (1,451) |
| Delaware: | 6.2% (12,138) |
60 to 89 minutes - Females:
| Wilmington: | 3.0% (627) |
| Delaware: | 3.7% (7,286) |
90 or more minutes - Females:
| Wilmington: | 0.6% (123) |
| Delaware: | 1.1% (2,078) |
Means of transportation to work
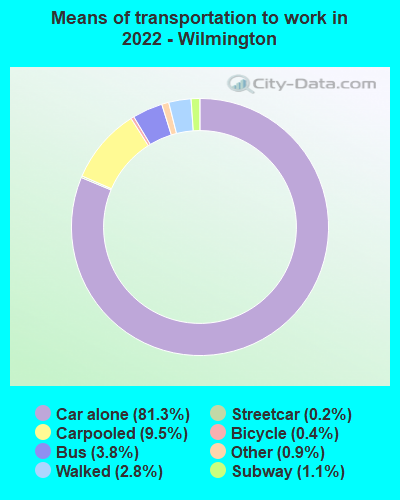
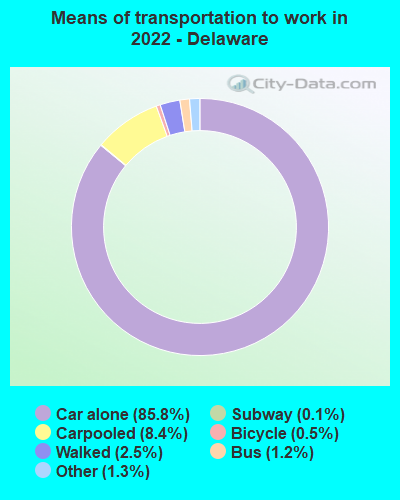
Drove car alone:
| Wilmington: | 81.3% (42,599) |
| Delaware: | 85.8% (169,034) |
Carpooled:
| Wilmington: | 9.5% (4,992) |
| Delaware: | 8.4% (16,581) |
Bus:
| Wilmington: | 3.8% (2,003) |
| Delaware: | 1.2% (2,524) |
Subway or elevated rail:
| Wilmington: | 0.2% (87) |
| Delaware: | 0.1% (128) |
Long-distance train or commuter rail:
| Wilmington: | 1.1% (559) |
| Delaware: | 0.1% (160) |
Light rail, streetcar or trolley:
| Wilmington: | 0.1% (47) |
| Delaware: | 0.0% (0) |
Bicycle:
| Wilmington: | 0.4% (189) |
| Delaware: | 0.5% (464) |
Walked:
| Wilmington: | 2.8% (1,461) |
| Delaware: | 2.5% (4,711) |
Other means:
| Wilmington: | 0.9% (465) |
| Delaware: | 1.3% (2,053) |

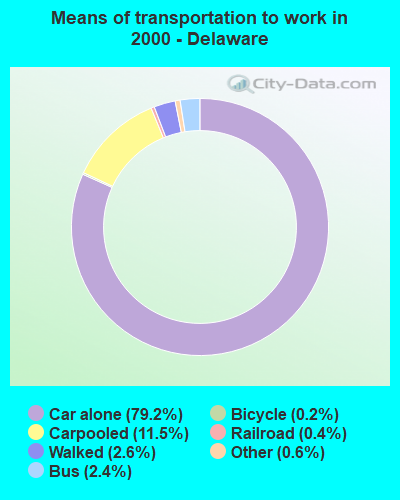
Drove car alone:
| Wilmington: | 62.4% (18,521) |
| Delaware: | 79.2% (295,413) |
Carpooled:
| Wilmington: | 14.5% (4,296) |
| Delaware: | 11.5% (42,990) |
Bus or trolley bus:
| Wilmington: | 11.3% (3,355) |
| Delaware: | 2.4% (8,770) |
Subway or elevated:
| Wilmington: | 0.0% (5) |
| Delaware: | 0.0% (140) |
Railroad:
| Wilmington: | 0.7% (198) |
| Delaware: | 0.4% (1,361) |
Motorcycle:
| Wilmington: | 0.2% (51) |
| Delaware: | 0.1% (359) |
Bicycle:
| Wilmington: | 0.2% (58) |
| Delaware: | 0.2% (851) |
Walked:
| Wilmington: | 7.6% (2,245) |
| Delaware: | 2.6% (9,637) |
Other means:
| Wilmington: | 0.6% (176) |
| Delaware: | 0.6% (2,375) |

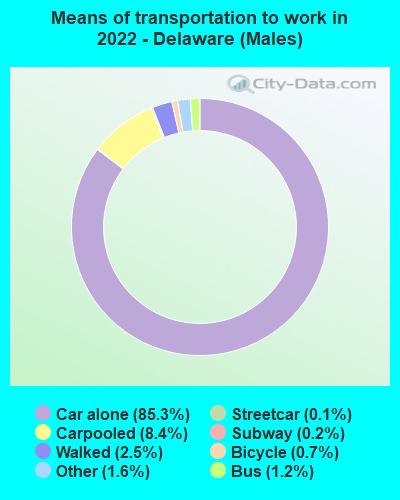
Drove car alone - Males:
| Wilmington: | 83.3% (22,909) |
| Delaware: | 85.3% (169,034) |
Carpooled - Males:
| Wilmington: | 8.5% (2,327) |
| Delaware: | 8.4% (16,581) |
Bus - Males:
| Wilmington: | 2.9% (800) |
| Delaware: | 1.2% (2,524) |
Subway or elevated rail - Males:
| Wilmington: | 0.2% (47) |
| Delaware: | 0.1% (128) |
Long-distance train or commuter rail - Males:
| Wilmington: | 1.2% (328) |
| Delaware: | 0.2% (160) |
Bicycle - Males:
| Wilmington: | 0.5% (147) |
| Delaware: | 0.7% (464) |
Walked - Males:
| Wilmington: | 3.0% (818) |
| Delaware: | 2.5% (4,711) |
Other means - Males:
| Wilmington: | 0.5% (140) |
| Delaware: | 1.6% (2,053) |

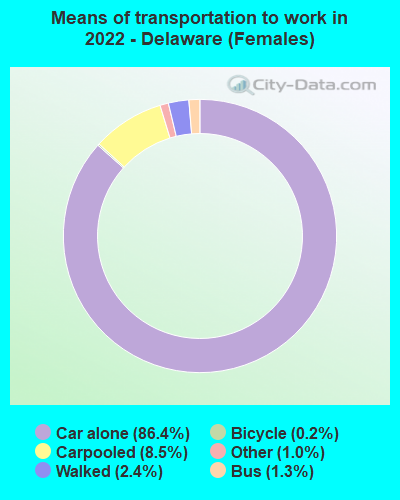
Drove car alone - Females:
| Wilmington: | 79.2% (19,714) |
| Delaware: | 86.4% (169,034) |
Carpooled - Females:
| Wilmington: | 10.7% (2,653) |
| Delaware: | 8.5% (16,581) |
Bus - Females:
| Wilmington: | 4.8% (1,192) |
| Delaware: | 1.3% (2,524) |
Subway or elevated rail - Females:
| Wilmington: | 0.2% (41) |
| Delaware: | 0.1% (128) |
Long-distance train or commuter rail - Females:
| Wilmington: | 0.9% (232) |
| Delaware: | 0.1% (160) |
Light rail, streetcar or trolley - Females:
| Wilmington: | 0.2% (46) |
| Delaware: | 0.0% (0) |
Bicycle - Females:
| Wilmington: | 0.2% (45) |
| Delaware: | 0.2% (464) |
Walked - Females:
| Wilmington: | 2.6% (645) |
| Delaware: | 2.4% (4,711) |
Other means - Females:
| Wilmington: | 1.3% (321) |
| Delaware: | 1.0% (2,053) |
Private vehicle occupancy

Drove alone:
| Wilmington: | 91.8% (21,890) |
| Delaware: | 91.1% (357,857) |
In 2 person carpool:
| Wilmington: | 5.2% (1,228) |
| Delaware: | 6.2% (24,360) |
In 3 person carpool:
| Wilmington: | 1.9% (455) |
| Delaware: | 1.7% (6,592) |
In 4 person carpool:
| Wilmington: | 0.1% (13) |
| Delaware: | 0.4% (1,564) |
In 5-6 person carpool:
| Wilmington: | 0.6% (137) |
| Delaware: | 0.4% (1,605) |
In 7+ person carpool:
| Wilmington: | 0.5% (124) |
| Delaware: | 0.2% (960) |

Drove alone:
| Wilmington: | 81.2% (18,521) |
| Delaware: | 87.3% (295,413) |
In 2 person carpool:
| Wilmington: | 15.4% (3,513) |
| Delaware: | 10.1% (34,179) |
In 3 person carpool:
| Wilmington: | 2.0% (459) |
| Delaware: | 1.6% (5,574) |
In 4 person carpool:
| Wilmington: | 0.7% (157) |
| Delaware: | 0.5% (1,816) |
In 5-6 person carpool:
| Wilmington: | 0.4% (99) |
| Delaware: | 0.3% (852) |
In 7+ person carpool:
| Wilmington: | 0.3% (68) |
| Delaware: | 0.2% (569) |
Class of workers
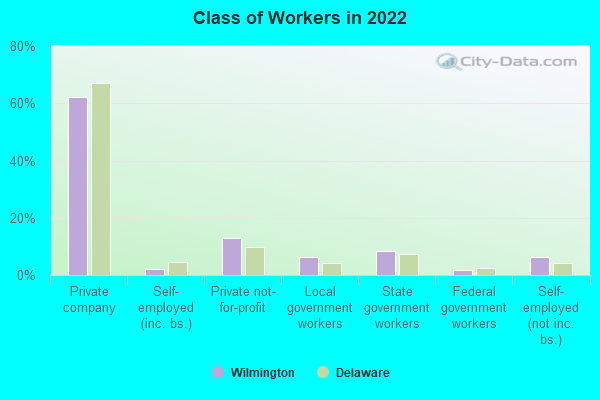
Employee of private company:
| Wilmington: | 62.3% (22,751) |
| Delaware: | 67.1% (334,862) |
Self-employed in own incorporated business:
| Wilmington: | 2.1% (754) |
| Delaware: | 4.4% (21,905) |
Private not-for-profit wage and salary workers:
| Wilmington: | 13.1% (4,786) |
| Delaware: | 9.8% (48,848) |
Local government workers:
| Wilmington: | 6.2% (2,271) |
| Delaware: | 4.3% (21,448) |
State government workers:
| Wilmington: | 8.5% (3,106) |
| Delaware: | 7.5% (37,360) |
Federal government workers:
| Wilmington: | 1.7% (617) |
| Delaware: | 2.5% (12,299) |
Self-employed workers in own not incorporated business:
| Wilmington: | 6.2% (2,262) |
| Delaware: | 4.3% (21,479) |

Employee of private company:
| Wilmington: | 70.0% (21,293) |
| Delaware: | 70.4% (265,154) |
Self-employed in own incorporated business:
| Wilmington: | 2.0% (597) |
| Delaware: | 3.3% (12,474) |
Private not-for-profit wage and salary workers:
| Wilmington: | 9.9% (3,024) |
| Delaware: | 7.4% (27,793) |
Local government workers:
| Wilmington: | 5.2% (1,582) |
| Delaware: | 2.8% (10,645) |
State government workers:
| Wilmington: | 7.8% (2,375) |
| Delaware: | 8.8% (33,093) |
Federal government workers:
| Wilmington: | 1.6% (482) |
| Delaware: | 2.2% (8,305) |
Self-employed workers in own not incorporated business:
| Wilmington: | 3.4% (1,021) |
| Delaware: | 5.0% (18,686) |
Unpaid family workers:
| Wilmington: | 0.1% (38) |
| Delaware: | 0.2% (661) |

Employee of private company - Males:
| Wilmington: | 68.8% (11,712) |
| Delaware: | 72.0% (184,648) |
Self-employed in own incorporated business - Males:
| Wilmington: | 2.1% (352) |
| Delaware: | 5.7% (14,494) |
Private not-for-profit wage and salary workers - Males:
| Wilmington: | 6.1% (1,045) |
| Delaware: | 6.6% (16,969) |
Local government workers - Males:
| Wilmington: | 5.3% (898) |
| Delaware: | 2.8% (7,098) |
State government workers - Males:
| Wilmington: | 7.5% (1,268) |
| Delaware: | 5.4% (13,924) |
Federal government workers - Males:
| Wilmington: | 3.1% (526) |
| Delaware: | 2.6% (6,619) |
Self-employed workers in own not incorporated business - Males:
| Wilmington: | 7.1% (1,215) |
| Delaware: | 4.8% (12,219) |

Employee of private company - Females:
| Wilmington: | 56.5% (11,039) |
| Delaware: | 62.0% (150,214) |
Self-employed in own incorporated business - Females:
| Wilmington: | 2.1% (402) |
| Delaware: | 3.1% (7,411) |
Private not-for-profit wage and salary workers - Females:
| Wilmington: | 19.2% (3,741) |
| Delaware: | 13.2% (31,879) |
Local government workers - Females:
| Wilmington: | 7.0% (1,373) |
| Delaware: | 5.9% (14,350) |
State government workers - Females:
| Wilmington: | 9.4% (1,838) |
| Delaware: | 9.7% (23,436) |
Federal government workers - Females:
| Wilmington: | 0.5% (91) |
| Delaware: | 2.3% (5,680) |
Self-employed workers in own not incorporated business - Females:
| Wilmington: | 5.4% (1,047) |
| Delaware: | 3.8% (9,260) |