West Grove, PA (Pennsylvania) Houses and Residents
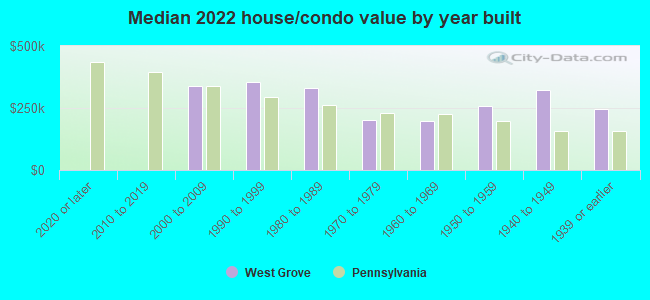
| West Grove: | $285,969 |
| Pennsylvania: | $245,500 |
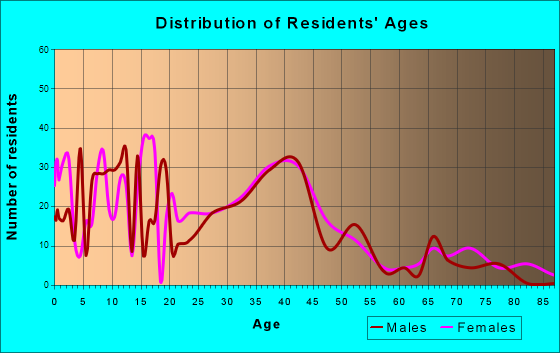
Total population: 2,863 (Urban population: 2,652, Rural population: 0)
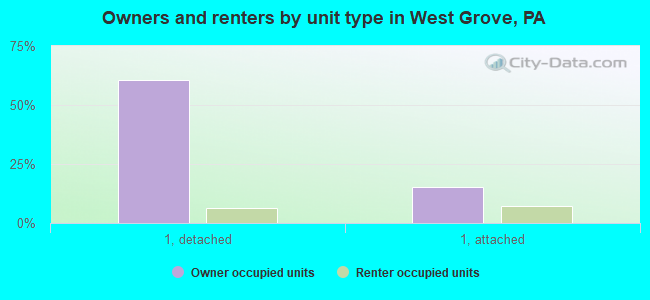
Houses: 987 (982 occupied: 735 owner occupied, 246 renter occupied)
| % of renters here: | 25% |
| State: | 31% |
Housing density: 1,555 houses/condos per square mile
Median price asked for vacant for-sale houses and condos in 2022 in this county: $402,427.
Median contract rent in 2022: $1,112 (lower quartile is $947, upper quartile is $1,628)
Median rent asked for vacant for-rent units in 2022: $1,307
Median gross rent in West Grove, PA in 2022: $1,360
Housing units in West Grove with a mortgage: 514 (72 second mortgage, 0 home equity loan, 46 both second mortgage and home equity loan)
Houses without a mortgage: 19
Median household income for houses/condos with a mortgage: $104,954
Median household income for apartments without a mortgage: $84,112
Median monthly housing costs: $1,494
Compare current foreclosures near West Grove, PA:
| Photo | Address | Area | Beds / Baths | Price | Details |
|---|---|---|---|---|---|

|
#1
S Guernsey Rd
West Grove, PA 19390
|
2,400 sq. feet
|
3 baths 6 beds |
$283,973
|
show details |

|
#2
Briarcliff Cir
West Grove, PA 19390
|
3,423 sq. feet
|
2 baths 4 beds |
$337,610
|
show details |

|
#3
Blanca Ct
West Grove, PA 19390
|
4,300 sq. feet
|
2 baths 4 beds |
show details | |

|
#4
E Hillcrest Ave
West Grove, PA 19390
|
2,359 sq. feet
|
2 baths 3 beds |
show details | |

|
#5
Clonmell Upland Rd
West Grove, PA 19390
|
- sq. feet
|
- baths - beds |
$351,061
|
show details |

|
#6
English Ln
West Grove, PA 19390
|
2,552 sq. feet
|
2 baths 4 beds |
show details | |

|
#7
N Pine St
Wilmington, DE 19802
|
1,125 sq. feet
|
1 baths 3 beds |
$199,900
|
show details |

|
#8
Springton Rd
Glenmoore, PA 19343
|
1,388 sq. feet
|
2 baths 3 beds |
$286,000
|
show details |

|
#9
W Bridge St
Parkesburg, PA 19365
|
1,056 sq. feet
|
1 baths 4 beds |
$327,500
|
show details |

|
#10
Barbara Dr
Downingtown, PA 19335
|
1,908 sq. feet
|
2 baths 4 beds |
$275,782
|
show details |
| Photo | Address | Area | Beds / Baths | Price | Details |
|---|---|---|---|---|---|

|
#11
Autumn Trl
Coatesville, PA 19320
|
2,820 sq. feet
|
2 baths 4 beds |
$308,490
|
show details |

|
#12
Coventry Ln
West Chester, PA 19382
|
1,580 sq. feet
|
2 baths 3 beds |
$205,686
|
show details |

|
#13
Huntington Cir
Coatesville, PA 19320
|
3,124 sq. feet
|
3 baths 4 beds |
$71,206
|
show details |

|
#14
Carlyn Ct
Downingtown, PA 19335
|
1,599 sq. feet
|
2 baths 3 beds |
$139,895
|
show details |

|
#15
Poorhouse Rd
Downingtown, PA 19335
|
2,402 sq. feet
|
2 baths 3 beds |
$496,564
|
show details |

|
#16
Compass Rd
Honey Brook, PA 19344
|
2,088 sq. feet
|
2 baths 3 beds |
$392,017
|
show details |

|
#17
Center Hall Rd
Cochranville, PA 19330
|
1,472 sq. feet
|
1 baths 3 beds |
$120,017
|
show details |

|
#18
Birmingham Rd
West Chester, PA 19382
|
3,671 sq. feet
|
3 baths 6 beds |
$672,488
|
show details |

|
#19
Schoolview Ln
Oxford, PA 19363
|
3,504 sq. feet
|
2 baths 4 beds |
$346,389
|
show details |

|
#20
Oxford Rd
West Chester, PA 19380
|
2,116 sq. feet
|
2 baths 4 beds |
$173,254
|
show details |
| Photo | Address | Area | Beds / Baths | Price | Details |
|---|---|---|---|---|---|

|
#21
Bowman Ave
West Chester, PA 19380
|
1,031 sq. feet
|
1 baths 3 beds |
$159,163
|
show details |

|
#22
Mimosa Cir
Kennett Square, PA 19348
|
2,024 sq. feet
|
2 baths 3 beds |
$500,493
|
show details |

|
#23
Quill Ct
Oxford, PA 19363
|
2,454 sq. feet
|
2 baths 3 beds |
$291,550
|
show details |

|
#24
Compass Rd
Parkesburg, PA 19365
|
1,796 sq. feet
|
2 baths 5 beds |
$202,920
|
show details |

|
#25
Barnsley Rd
Oxford, PA 19363
|
1,288 sq. feet
|
1 baths 3 beds |
$176,718
|
show details |

|
#26
Larson Dr
Downingtown, PA 19335
|
1,594 sq. feet
|
2 baths 2 beds |
$5,454
|
show details |

|
#27
Stonegate Dr
Downingtown, PA 19335
|
2,870 sq. feet
|
2 baths 4 beds |
$5,336
|
show details |

|
#28
Madison St
Coatesville, PA 19320
|
1,880 sq. feet
|
1 baths 3 beds |
$137,707
|
show details |

|
#29
Valley Rd
Coatesville, PA 19320
|
2,170 sq. feet
|
2 baths 3 beds |
$179,599
|
show details |

|
#30
E Kings Hwy
Coatesville, PA 19320
|
1,504 sq. feet
|
2 baths 3 beds |
$194,489
|
show details |
| Photo | Address | Area | Beds / Baths | Price | Details |
|---|---|---|---|---|---|

|
#31
Overhill Rd
Coatesville, PA 19320
|
1,104 sq. feet
|
1 baths 3 beds |
$111,962
|
show details |

|
#32
Lamberts Ln
Coatesville, PA 19320
|
1,892 sq. feet
|
2 baths 4 beds |
$395,461
|
show details |

|
#33
Doe Run Rd
Coatesville, PA 19320
|
1,112 sq. feet
|
1 baths 2 beds |
$8,223
|
show details |

|
#34
Macduff Ct
Chadds Ford, PA 19317
|
1,796 sq. feet
|
2 baths 3 beds |
$215,884
|
show details |

|
#35
Magpie Ln
Coatesville, PA 19320
|
1,968 sq. feet
|
2 baths 3 beds |
$141,863
|
show details |

|
#36
Walnut Valley Rd
Chadds Ford, PA 19317
|
2,248 sq. feet
|
2 baths 3 beds |
$518,830
|
show details |

|
#37
Grove Rd
West Chester, PA 19380
|
875 sq. feet
|
1 baths 3 beds |
$19,782
|
show details |

|
#38
Freedom Valley Cir
Coatesville, PA 19320
|
2,703 sq. feet
|
2 baths 4 beds |
$343,828
|
show details |

|
#39
Wagners Ln
Coatesville, PA 19320
|
2,910 sq. feet
|
2 baths 4 beds |
$568,157
|
show details |

|
#40
Humpton Rd
Downingtown, PA 19335
|
1,896 sq. feet
|
1 baths 4 beds |
$6,080
|
show details |
| Photo | Address | Area | Beds / Baths | Price | Details |
|---|---|---|---|---|---|

|
#41
Leeward St
Coatesville, PA 19320
|
1,746 sq. feet
|
2 baths 3 beds |
$274,728
|
show details |

|
#42
Astor Ct
Downingtown, PA 19335
|
1,439 sq. feet
|
2 baths 3 beds |
$3,245
|
show details |

|
#43
Shropshire Dr
West Chester, PA 19382
|
2,470 sq. feet
|
2 baths 4 beds |
$63,361
|
show details |

|
#44
Lafayette Ave
Coatesville, PA 19320
|
1,120 sq. feet
|
1 baths 3 beds |
$119,212
|
show details |

|
#45
Bala Ter W
West Chester, PA 19380
|
1,632 sq. feet
|
1 baths 3 beds |
$180,258
|
show details |

|
#46
Elkdale Rd
Lincoln University, PA 19352
|
1,895 sq. feet
|
1 baths 3 beds |
$58,117
|
show details |

|
#47
Larchwood Rd
West Chester, PA 19382
|
2,276 sq. feet
|
2 baths 3 beds |
$3,640
|
show details |

|
#48
Ewing Rd
Cochranville, PA 19330
|
3,110 sq. feet
|
1 baths 6 beds |
$471,404
|
show details |

|
#49
Stirling St
Coatesville, PA 19320
|
1,462 sq. feet
|
1 baths 3 beds |
$120,087
|
show details |

|
Check over 1 million property listings on Foreclosure.com!
|
browse all offers | |||


 | Retirement Move from Newton, MA to PA (Philly Suburbs) (73 replies) |
| High radon reading in PA (14 replies) |
| Moving to PA w/in 11 Months (15 replies) |
| Family Doctor in Chester Co (3 replies) |
| Buying house in Chester County vs state of Delaware (6 replies) |
| Anyone move from Delaware to Pennsylvania (3 replies) |
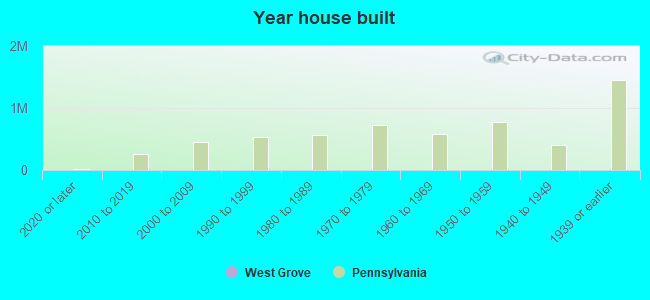
Median year apartment built: 1968
Household type by relationship:
Households: 2,832- Male householders: 332 (41 living alone), Female householders: 648 (108 living alone)
445 spouses (445 opposite-sex spouses), 47 unmarried partners, (47 opposite-sex unmarried partners), 1,014 children (987 natural, 22 adopted, 4 stepchildren), 61 grandchildren, 52 brothers or sisters, 63 parents, 0 foster children, 24 other relatives, 142 non-relatives
Size of family households: 319 2-persons, 235 3-persons, 100 4-persons, 92 5-persons, 28 6-persons, 4 7-or-more-persons.
Size of nonfamily households: 142 1-person, 31 2-persons, 12 3-persons.
371 married couples with children.
284 single-parent households (42 men, 242 women).
76.9% of residents of West Grove speak English at home.
17.4% of residents speak Spanish at home (56% speak English very well, 16% speak English well, 18% speak English not well, 10% don't speak English at all).
2.1% of residents speak Asian or Pacific Island language at home (61% speak English very well, 18% speak English well, 21% speak English not well).
Foreign born population: 354 (12.5%)
(49.7% of them are naturalized citizens)
| Here: | 6.4 |
| State: | 6.8 |
| Here: | 5.0 |
| State: | 4.3 |
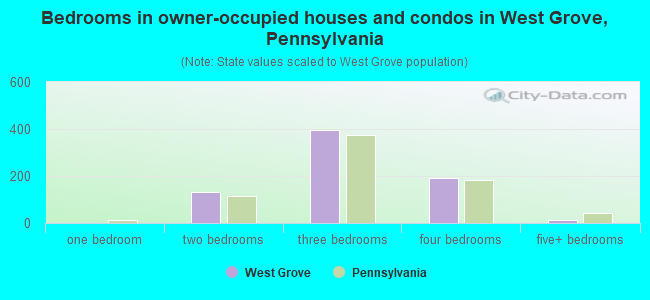
- Bedrooms in owner-occupied houses and condos in West Grove, Pennsylvania
- 0no bedroom
- 01 bedroom
- 1322 bedrooms
- 3963 bedrooms
- 1934 bedrooms
- 135+ bedrooms
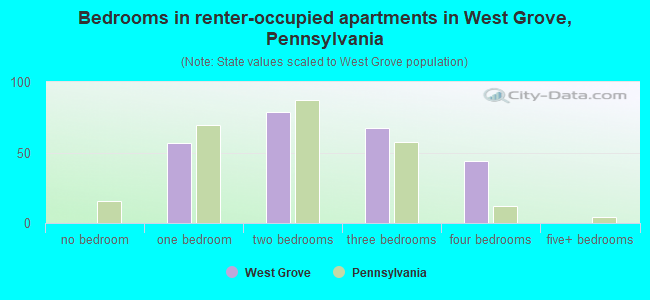
- Bedrooms in renter-occupied apartments in West Grove, Pennsylvania
- 0no bedroom
- 571 bedroom
- 782 bedrooms
- 673 bedrooms
- 444 bedrooms
- 05+ bedrooms
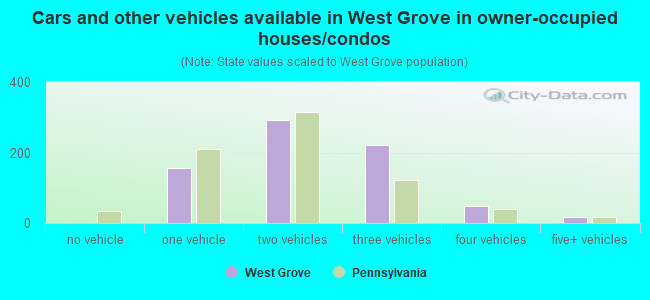
- Cars and other vehicles available in West Grove in owner-occupied houses/condos
- 0no vehicle
- 1571 vehicle
- 2912 vehicles
- 2223 vehicles
- 474 vehicles
- 185+ vehicles
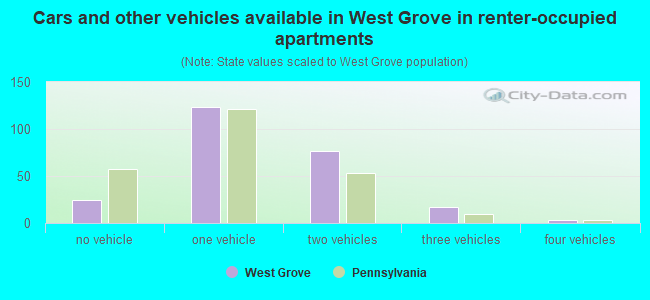
- Cars and other vehicles available in West Grove in renter-occupied apartments
- 25no vehicle
- 1231 vehicle
- 772 vehicles
- 173 vehicles
- 34 vehicles
- 05+ vehicles
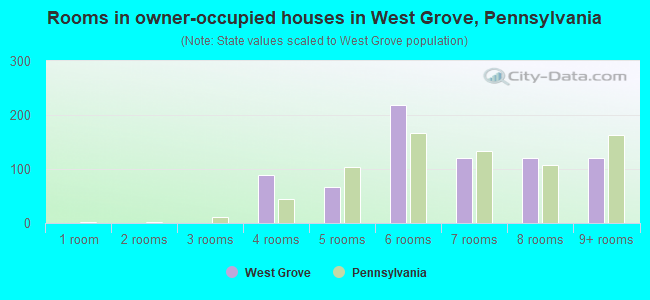
- Rooms in owner-occupied houses in West Grove, Pennsylvania
- 01 room
- 02 rooms
- 03 rooms
- 894 rooms
- 665 rooms
- 2186 rooms
- 1217 rooms
- 1218 rooms
- 1209+ rooms
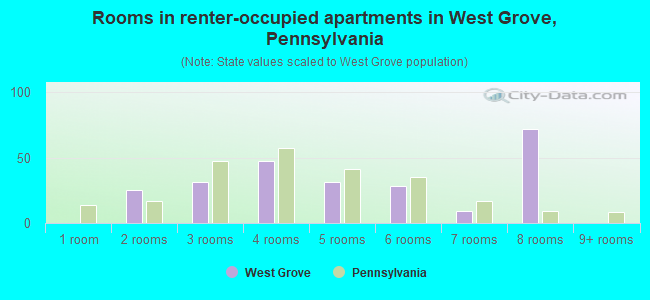
- Rooms in renter-occupied apartments in West Grove, Pennsylvania
- 01 room
- 252 rooms
- 323 rooms
- 484 rooms
- 325 rooms
- 296 rooms
- 97 rooms
- 728 rooms
- 09+ rooms
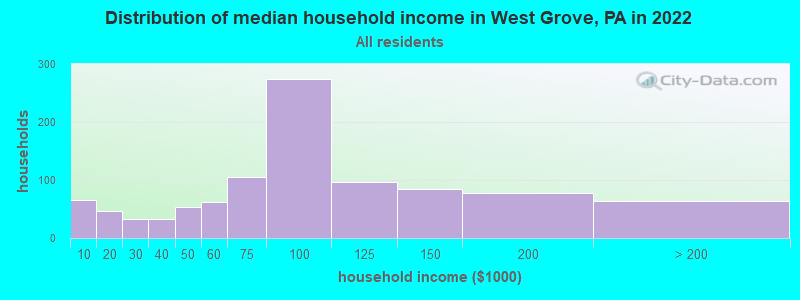
West Grove, PA household income distribution

- 66Less than $10,000
- 46$10,000 to $19,999
- 32$20,000 to $29,999
- 32$30,000 to $39,999
- 53$40,000 to $49,999
- 62$50,000 to $59,999
- 105$60,000 to $74,999
- 275$75,000 to $99,999
- 97$100,000 to $124,999
- 85$125,000 to $149,999
- 78$150,000 to $199,999
- 64$200,000 or more
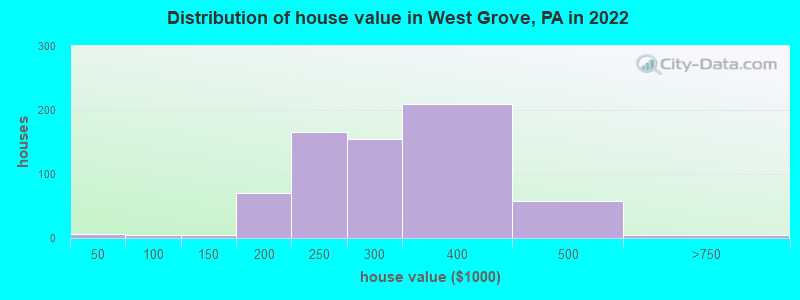
Home value of owner - occupied houses in 2022 in West Grove, PA
-
- 5Less than $10,000
- 3$70,000 to $79,999
- 5$125,000 to $149,999
- 48$150,000 to $174,999
- 20$175,000 to $199,999
- 165$200,000 to $249,999
- 155$250,000 to $299,999
- 209$300,000 to $399,999
- 58$400,000 to $499,999
- 4$500,000 to $749,999
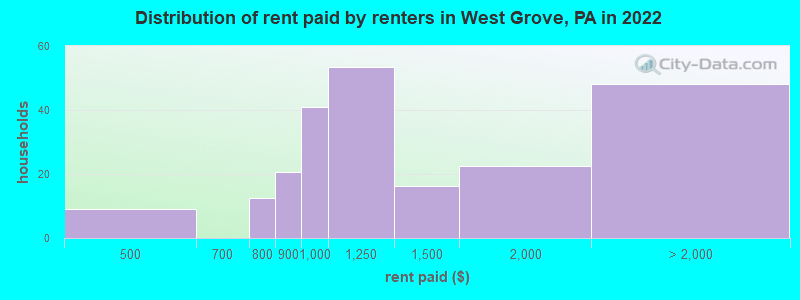
Rent paid by renters in 2022 in West Grove, PA
-
- 9$450 to $499
- 12$750 to $799
- 20$800 to $899
- 40$900 to $999
- 53$1,000 to $1,249
- 16$1,250 to $1,499
- 22$1,500 to $1,999
- 42$2,000 to $2,499
- 5No cash rent
Percentage of workers working in this county: 77.5%
Number of people working at home: 141 (8.9% of all workers)
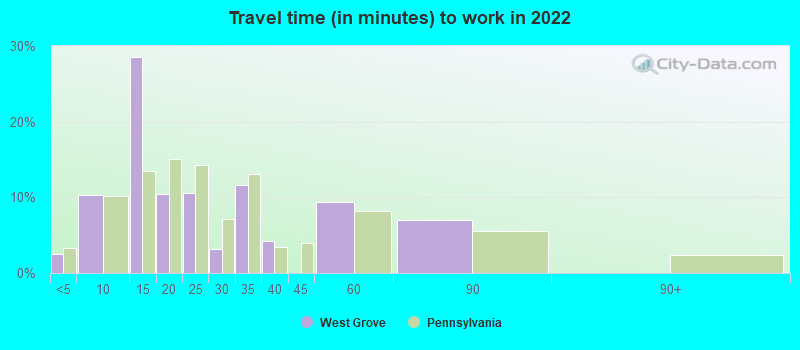
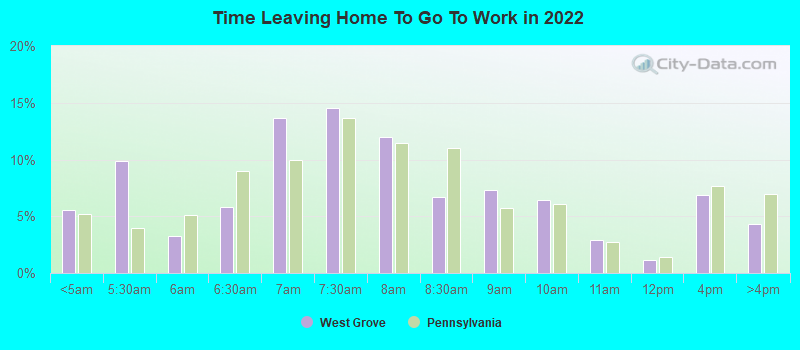
Travel time to work (commute)
- Less than 5 minutes: 141
- 5 to 9 minutes: 168
- 10 to 14 minutes: 266
- 15 to 19 minutes: 165
- 20 to 24 minutes: 110
- 25 to 29 minutes: 35
- 30 to 34 minutes: 93
- 35 to 39 minutes: 67
- 40 to 44 minutes: 30
- 45 to 59 minutes: 123
- 60 to 89 minutes: 158
- 90 or more minutes: 40
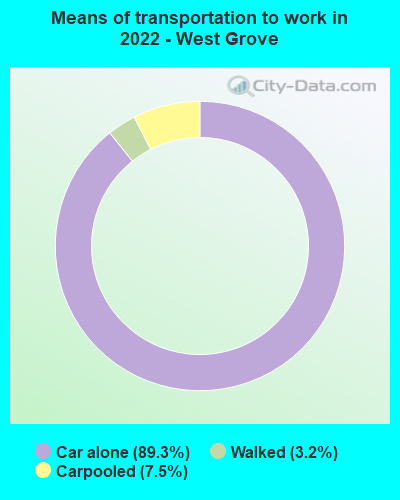
Means of transportation to work:
- Drove a car alone: 495 (70.9%)
- Carpooled: 39 (5.6%)
- Walked: 20 (2.9%)
- Worked at home: 141 (20.2%)
- Unemployment by race in 2022
- Unemployment rate for White non-Hispanic residents
- 3.7%Males
- 0.8%Females
- Unemployment rate for Black residents
- 50.8%Males
- Unemployment rate for two or more race residents
- 15.4%Males
- Unemployment rate for Hispanic or Latino residents
- 9.3%Males
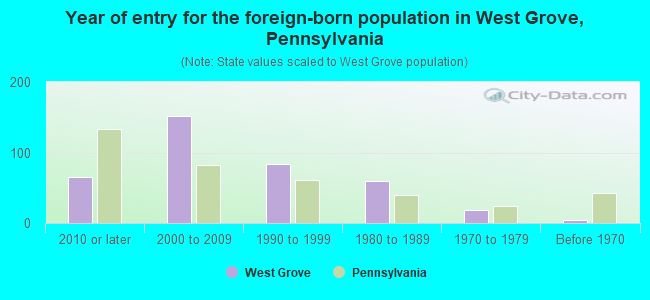
- Year of entry for the foreign-born population in West Grove, Pennsylvania
- 652010 or later
- 1522000 to 2009
- 841990 to 1999
- 591980 to 1989
- 181970 to 1979
- 4Before 1970
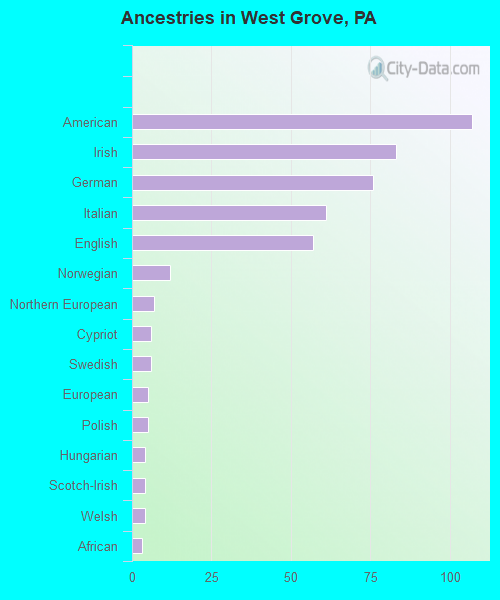
First ancestries reported:
- American: 107 (8.6%)
- Irish: 83 (6.7%)
- German: 76 (6.1%)
- Italian: 61 (4.9%)
- English: 57 (4.6%)
- Norwegian: 12 (1.0%)
- Northern European: 7 (0.6%)
- Cypriot: 6 (0.5%)
- Swedish: 6 (0.5%)
- European: 5 (0.4%)
- Polish: 5 (0.4%)
- Hungarian: 4 (0.3%)
- Scotch-Irish: 4 (0.3%)
- Welsh: 4 (0.3%)
- African: 3 (0.2%)
Most common places of birth for foreign-born residents (%):
| West Grove: | 79.9% (283) |
| Pennsylvania: | 5.8% (54,190) |
| West Grove: | 9.0% (32) |
| Pennsylvania: | 3.3% (31,542) |
| West Grove: | 4.5% (16) |
| Pennsylvania: | 1.4% (13,077) |
| West Grove: | 2.8% (10) |
| Pennsylvania: | 7.2% (67,704) |
| West Grove: | 1.7% (6) |
| Pennsylvania: | 0.1% (600) |
Place of birth for U.S.-born residents:
- This state: 1,849
- Other state: 574
- Northeast: 133
- Midwest: 103
- South: 249
- West: 73
95.5% of West Grove residents lived in the same house 1 years ago.
Out of people who lived in different houses, 23.2% lived in this county.
Out of people who lived in different counties, 26.4% lived in Pennsylvania.
| West Grove: | 95.5% |
| State average: | 89.3% |
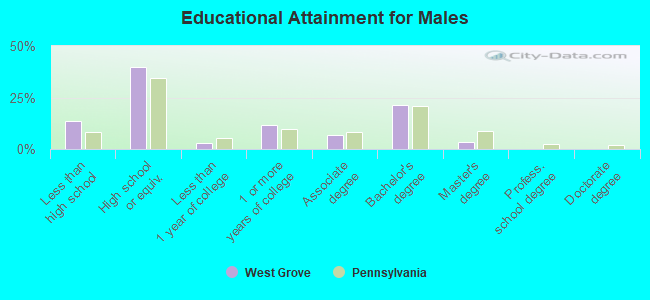
Education attainment for males 25 years and older:
- No schooling: 17
- Nursery to 4th grade: 0
- 5th and 6th grade: 28
- 7th and 8th grade: 0
- 9th grade: 2
- 10th grade: 17
- 11th grade: 0
- 12th grade, no diploma: 33
- High school graduate (or equivalency): 286
- Less than 1 year of college: 22
- Some college more than 1 year, no degree: 84
- Associate degree: 48
- Bachelor's degree: 155
- Master's degree: 26
- Professional school degree: 0
- Doctorate degree: 1
Education attainment for females 25 years and older:
- No schooling: 55
- Nursery to 4th grade: 7
- 5th and 6th grade: 84
- 7th and 8th grade: 8
- 9th grade: 2
- 10th grade: 27
- 11th grade: 0
- 12th grade, no diploma: 35
- High school graduate (or equivalency): 193
- Less than 1 year of college: 85
- Some college more than 1 year, no degree: 131
- Associate degree: 126
- Bachelor's degree: 233
- Master's degree: 77
- Professional school degree: 5
- Doctorate degree: 25

Housing units in structures:
- One, detached: 664
- One, attached: 221
- Two: 68
- 5 to 9: 28
- 10 to 19: 5
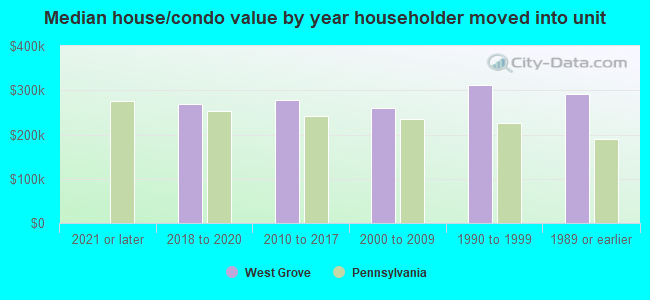
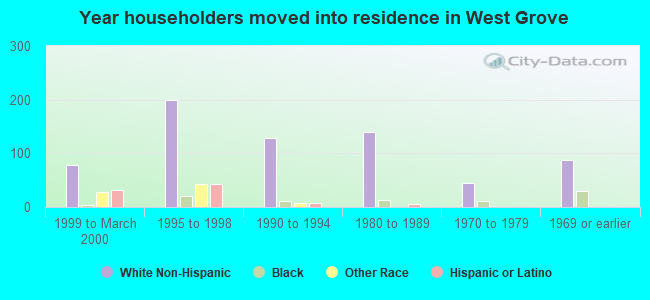
House/condo owner moved in on average 16 years ago
Renter moved in on average 5 years ago
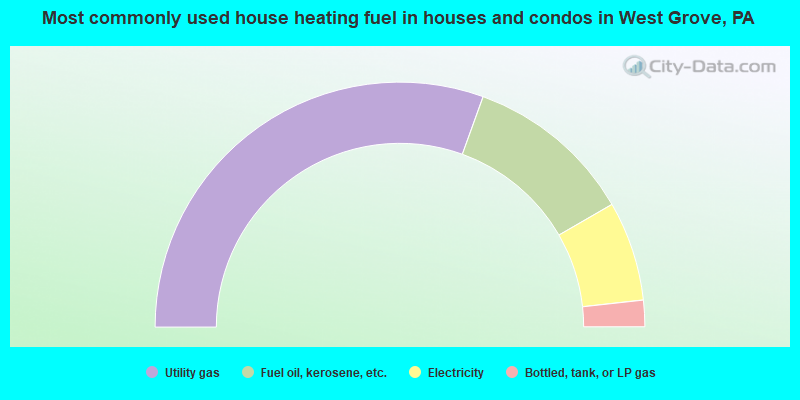
- 61.1%Utility gas
- 22.3%Fuel oil, kerosene, etc.
- 13.2%Electricity
- 3.5%Bottled, tank, or LP gas
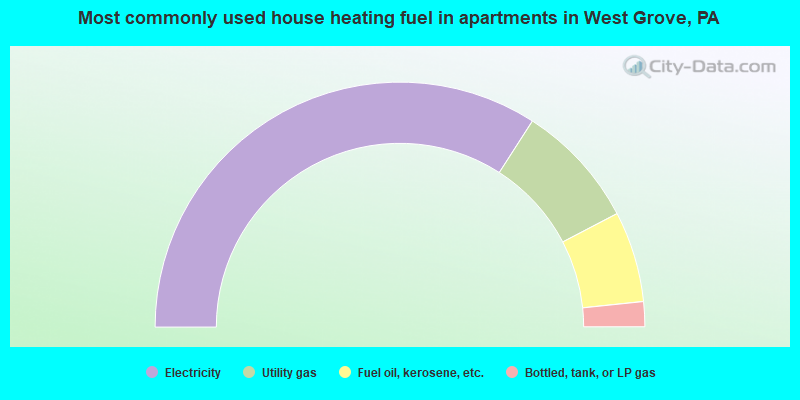
- 68.2%Electricity
- 16.5%Utility gas
- 12.0%Fuel oil, kerosene, etc.
- 3.3%Bottled, tank, or LP gas
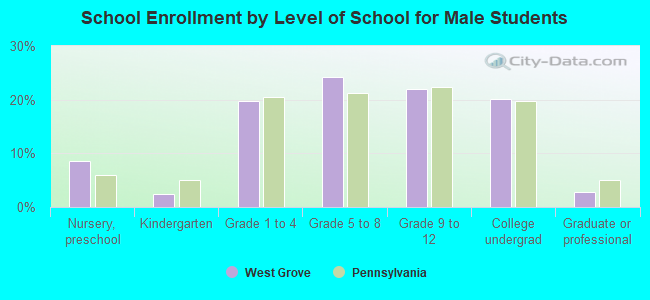
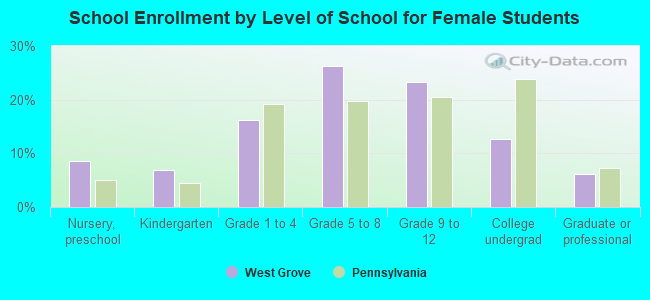
Private vs. public school enrollment:
| Here: | 1.5% |
| Pennsylvania: | 15.7% |
| Here: | 2.2% |
| Pennsylvania: | 13.4% |
| Here: | 10.2% |
| Pennsylvania: | 39.8% |