Races in West Grove, Pennsylvania (PA) Detailed Stats
Data:
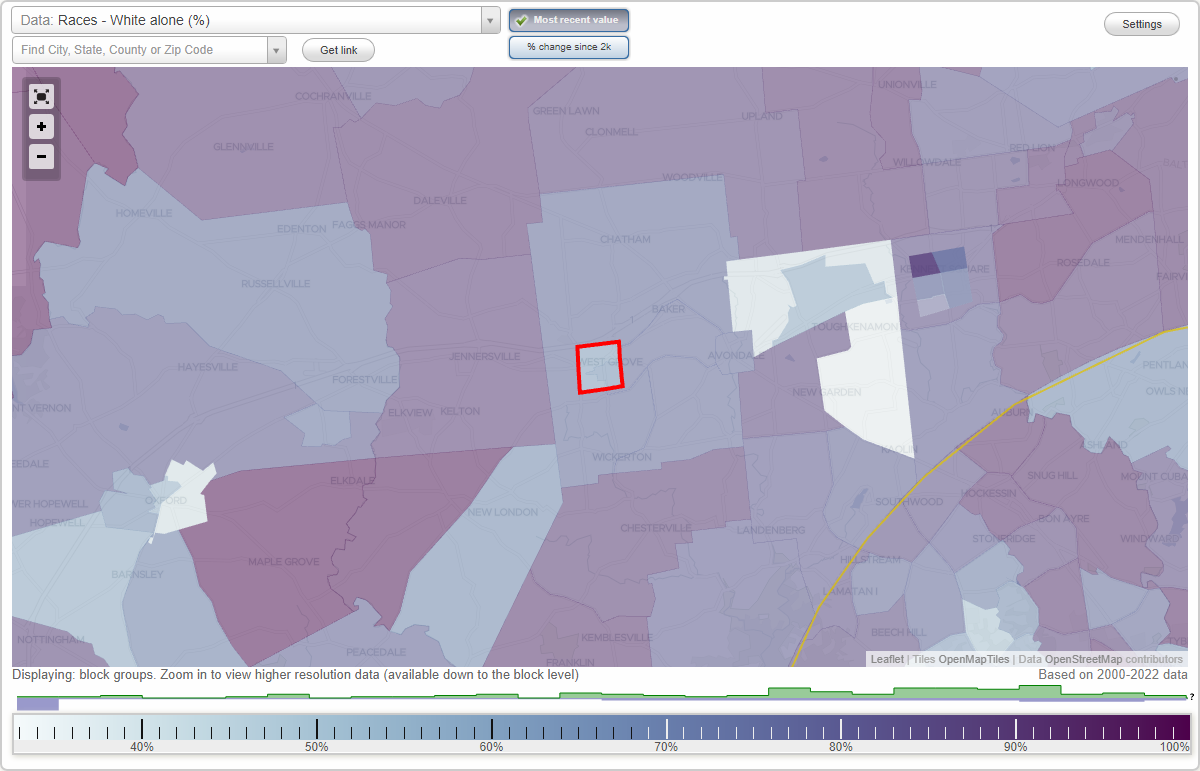
Races - White alone (%)
Races - White alone (% change since 2000)
Races - Black alone (%)
Races - Black alone (% change since 2000)
Races - American Indian alone (%)
Races - American Indian alone (% change since 2000)
Races - Asian alone (%)
Races - Asian alone (% change since 2000)
Races - Hispanic (%)
Races - Hispanic (% change since 2000)
Races - Native Hawaiian and Other Pacific Islander alone (%)
Races - Native Hawaiian and Other Pacific Islander alone (% change since 2000)
Races - Two or more races(%)
Races - Two or more races(% change since 2000)
Races - Other race alone (%)
Races - Other race alone (% change since 2000)
Racial diversity
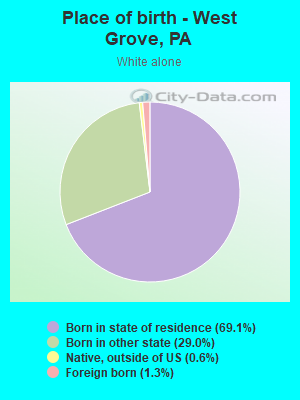
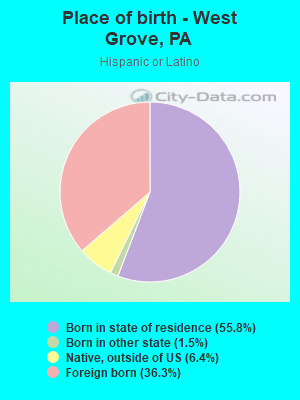
Place of birth - Born in state of residence (%)
Place of birth - Born in state of residence (%) - White
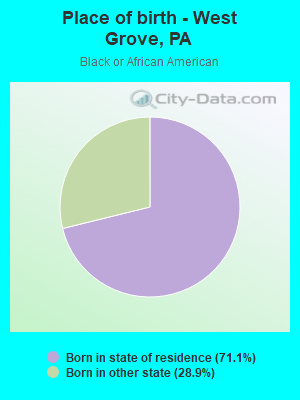
Place of birth - Born in state of residence (%) - Black or African American
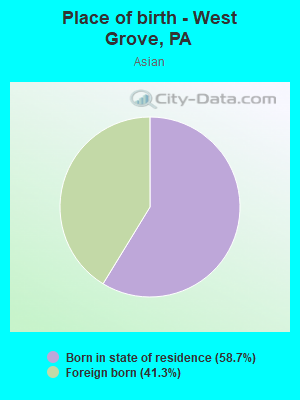
Place of birth - Born in state of residence (%) - Asian
Place of birth - Born in state of residence (%) - Hispanic or Latino
Place of birth - Born in state of residence (%) - American Indian and Alaska Native
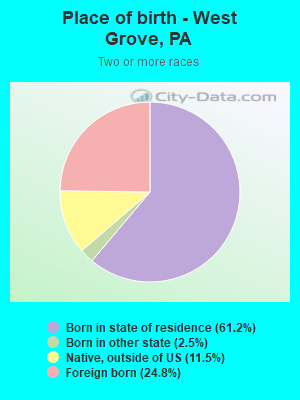
Place of birth - Born in state of residence (%) - Multirace
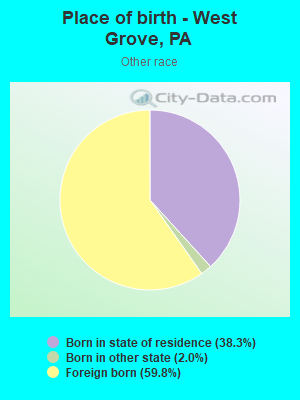
Place of birth - Born in state of residence (%) - Other Race
Place of birth - Born in other state (%)
Place of birth - Born in other state (%) - White
Place of birth - Born in other state (%) - Black or African American
Place of birth - Born in other state (%) - Asian
Place of birth - Born in other state (%) - Hispanic or Latino
Place of birth - Born in other state (%) - American Indian and Alaska Native
Place of birth - Born in other state (%) - Multirace
Place of birth - Born in other state (%) - Other Race
Place of birth - Native, outside of US (%)
Place of birth - Native, outside of US (%) - White
Place of birth - Native, outside of US (%) - Black or African American
Place of birth - Native, outside of US (%) - Asian
Place of birth - Native, outside of US (%) - Hispanic or Latino
Place of birth - Native, outside of US (%) - American Indian and Alaska Native
Place of birth - Native, outside of US (%) - Multirace
Place of birth - Native, outside of US (%) - Other Race
Place of birth - Foreign born (%)
Place of birth - Foreign born (%) - White
Place of birth - Foreign born (%) - Black or African American
Place of birth - Foreign born (%) - Asian
Place of birth - Foreign born (%) - Hispanic or Latino
Place of birth - Foreign born (%) - American Indian and Alaska Native
Place of birth - Foreign born (%) - Multirace
Place of birth - Foreign born (%) - Other Race
Residents speaking English at home (%)
Residents speaking English at home - Born in the United States (%)
Residents speaking English at home - Native, born elsewhere (%)
Residents speaking English at home - Foreign born (%)
Residents speaking Spanish at home (%)
Residents speaking Spanish at home - Born in the United States (%)
Residents speaking Spanish at home - Native, born elsewhere (%)
Residents speaking Spanish at home - Foreign born (%)
Residents speaking other language at home (%)
Residents speaking other language at home - Born in the United States (%)
Residents speaking other language at home - Native, born elsewhere (%)
Residents speaking other language at home - Foreign born (%)
Marital status - Never married (%)
Marital status - Now married (%)
Marital status - Separated (%)
Marital status - Widowed (%)
Marital status - Divorced (%)
Ancestries Reported - Arab (%)
Ancestries Reported - Czech (%)
Ancestries Reported - Danish (%)
Ancestries Reported - Dutch (%)
Ancestries Reported - English (%)
Ancestries Reported - French (%)
Ancestries Reported - French Canadian (%)
Ancestries Reported - German (%)
Ancestries Reported - Greek (%)
Ancestries Reported - Hungarian (%)
Ancestries Reported - Irish (%)
Ancestries Reported - Italian (%)
Ancestries Reported - Lithuanian (%)
Ancestries Reported - Norwegian (%)
Ancestries Reported - Polish (%)
Ancestries Reported - Portuguese (%)
Ancestries Reported - Russian (%)
Ancestries Reported - Scotch-Irish (%)
Ancestries Reported - Scottish (%)
Ancestries Reported - Slovak (%)
Ancestries Reported - Subsaharan African (%)
Ancestries Reported - Swedish (%)
Ancestries Reported - Swiss (%)
Ancestries Reported - Ukrainian (%)
Ancestries Reported - United States (%)
Ancestries Reported - Welsh (%)
Ancestries Reported - West Indian (%)
Ancestries Reported - Other (%)
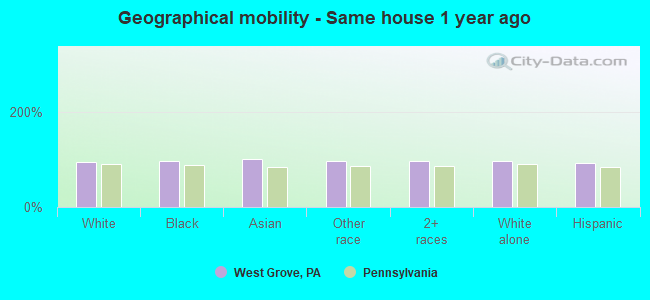
Geographical mobility - Same house 1 year ago (%)
Geographical mobility - Same house 1 year ago (%) - White
Geographical mobility - Same house 1 year ago (%) - Black or African American
Geographical mobility - Same house 1 year ago (%) - Asian
Geographical mobility - Same house 1 year ago (%) - Hispanic or Latino
Geographical mobility - Same house 1 year ago (%) - American Indian and Alaska Native
Geographical mobility - Same house 1 year ago (%) - Multirace
Geographical mobility - Same house 1 year ago (%) - Other Race
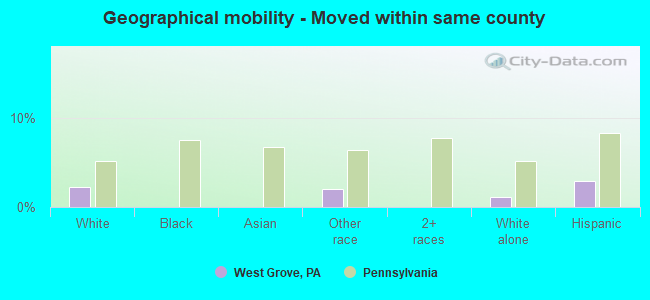
Geographical mobility - Moved within same county (%)
Geographical mobility - Moved within same county (%) - White
Geographical mobility - Moved within same county (%) - Black or African American
Geographical mobility - Moved within same county (%) - Asian
Geographical mobility - Moved within same county (%) - Hispanic or Latino
Geographical mobility - Moved within same county (%) - American Indian and Alaska Native
Geographical mobility - Moved within same county (%) - Multirace
Geographical mobility - Moved within same county (%) - Other Race
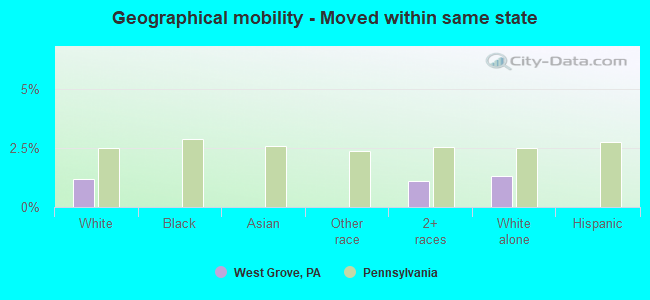
Geographical mobility - Moved from different county within same state (%)
Geographical mobility - Moved from different county within same state (%) - White
Geographical mobility - Moved from different county within same state (%) - Black or African American
Geographical mobility - Moved from different county within same state (%) - Asian
Geographical mobility - Moved from different county within same state (%) - Hispanic or Latino
Geographical mobility - Moved from different county within same state (%) - American Indian and Alaska Native
Geographical mobility - Moved from different county within same state (%) - Multirace
Geographical mobility - Moved from different county within same state (%) - Other Race
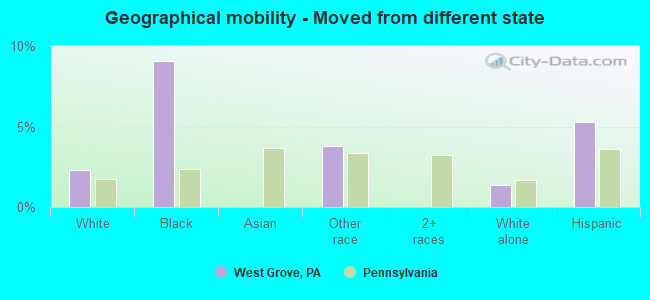
Geographical mobility - Moved from different state (%)
Geographical mobility - Moved from different state (%) - White
Geographical mobility - Moved from different state (%) - Black or African American
Geographical mobility - Moved from different state (%) - Asian
Geographical mobility - Moved from different state (%) - Hispanic or Latino
Geographical mobility - Moved from different state (%) - American Indian and Alaska Native
Geographical mobility - Moved from different state (%) - Multirace
Geographical mobility - Moved from different state (%) - Other Race
Geographical mobility - Moved from abroad (%)
Geographical mobility - Moved from abroad (%) - White
Geographical mobility - Moved from abroad (%) - Black or African American
Geographical mobility - Moved from abroad (%) - Asian
Geographical mobility - Moved from abroad (%) - Hispanic or Latino
Geographical mobility - Moved from abroad (%) - American Indian and Alaska Native
Geographical mobility - Moved from abroad (%) - Multirace
Geographical mobility - Moved from abroad (%) - Other Race
Place of birth for the foreign-born population - Ireland (%)
Place of birth for the foreign-born population - Denmark (%)
Place of birth for the foreign-born population - Norway (%)
Place of birth for the foreign-born population - Sweden (%)
Place of birth for the foreign-born population - United Kingdom (%)
Place of birth for the foreign-born population - England (%)
Place of birth for the foreign-born population - Scotland (%)
Place of birth for the foreign-born population - Other Northern Europe (%)
Place of birth for the foreign-born population - Austria (%)
Place of birth for the foreign-born population - Belgium (%)
Place of birth for the foreign-born population - France (%)
Place of birth for the foreign-born population - Germany (%)
Place of birth for the foreign-born population - Netherlands (%)
Place of birth for the foreign-born population - Switzerland (%)
Place of birth for the foreign-born population - Other Western Europe (%)
Place of birth for the foreign-born population - Greece (%)
Place of birth for the foreign-born population - Italy (%)
Place of birth for the foreign-born population - Portugal (%)
Place of birth for the foreign-born population - Spain (%)
Place of birth for the foreign-born population - Other Southern Europe (%)
Place of birth for the foreign-born population - Albania (%)
Place of birth for the foreign-born population - Belarus (%)
Place of birth for the foreign-born population - Bosnia and Herzegovina (%)
Place of birth for the foreign-born population - Bulgaria (%)
Place of birth for the foreign-born population - Croatia (%)
Place of birth for the foreign-born population - Czechoslovakia (%)
Place of birth for the foreign-born population - Hungary (%)
Place of birth for the foreign-born population - Latvia (%)
Place of birth for the foreign-born population - Lithuania (%)
Place of birth for the foreign-born population - North Macedonia (Macedonia) (%)
Place of birth for the foreign-born population - Moldova (%)
Place of birth for the foreign-born population - Poland (%)
Place of birth for the foreign-born population - Romania (%)
Place of birth for the foreign-born population - Russia (%)
Place of birth for the foreign-born population - Serbia (%)
Place of birth for the foreign-born population - Ukraine (%)
Place of birth for the foreign-born population - Other Eastern Europe (%)
Place of birth for the foreign-born population - China (%)
Place of birth for the foreign-born population - Hong Kong (%)
Place of birth for the foreign-born population - Taiwan (%)
Place of birth for the foreign-born population - Japan (%)
Place of birth for the foreign-born population - Korea (%)
Place of birth for the foreign-born population - Other Eastern Asia (%)
Place of birth for the foreign-born population - Afghanistan (%)
Place of birth for the foreign-born population - Bangladesh (%)
Place of birth for the foreign-born population - India (%)
Place of birth for the foreign-born population - Iran (%)
Place of birth for the foreign-born population - Kazakhstan (%)
Place of birth for the foreign-born population - Nepal (%)
Place of birth for the foreign-born population - Pakistan (%)
Place of birth for the foreign-born population - Sri Lanka (%)
Place of birth for the foreign-born population - Uzbekistan (%)
Place of birth for the foreign-born population - Other South Central Asia (%)
Place of birth for the foreign-born population - Burma (%)
Place of birth for the foreign-born population - Cambodia (%)
Place of birth for the foreign-born population - Indonesia (%)
Place of birth for the foreign-born population - Laos (%)
Place of birth for the foreign-born population - Malaysia (%)
Place of birth for the foreign-born population - Philippines (%)
Place of birth for the foreign-born population - Singapore (%)
Place of birth for the foreign-born population - Thailand (%)
Place of birth for the foreign-born population - Vietnam (%)
Place of birth for the foreign-born population - Other South Eastern Asia (%)
Place of birth for the foreign-born population - Armenia (%)
Place of birth for the foreign-born population - Iraq (%)
Place of birth for the foreign-born population - Israel (%)
Place of birth for the foreign-born population - Jordan (%)
Place of birth for the foreign-born population - Kuwait (%)
Place of birth for the foreign-born population - Lebanon (%)
Place of birth for the foreign-born population - Saudi Arabia (%)
Place of birth for the foreign-born population - Syria (%)
Place of birth for the foreign-born population - Turkey (%)
Place of birth for the foreign-born population - Yemen (%)
Place of birth for the foreign-born population - Other Western Asia (%)
Place of birth for the foreign-born population - Eritrea (%)
Place of birth for the foreign-born population - Ethiopia (%)
Place of birth for the foreign-born population - Kenya (%)
Place of birth for the foreign-born population - Somalia (%)
Place of birth for the foreign-born population - Uganda (%)
Place of birth for the foreign-born population - Zimbabwe (%)
Place of birth for the foreign-born population - Other Eastern Africa (%)
Place of birth for the foreign-born population - Cameroon (%)
Place of birth for the foreign-born population - Congo (%)
Place of birth for the foreign-born population - Democratic Republic of Congo (Zaire) (%)
Place of birth for the foreign-born population - Other Middle Africa (%)
Place of birth for the foreign-born population - Egypt (%)
Place of birth for the foreign-born population - Morocco (%)
Place of birth for the foreign-born population - Sudan (%)
Place of birth for the foreign-born population - Other Northern Africa (%)
Place of birth for the foreign-born population - South Africa (%)
Place of birth for the foreign-born population - Other Southern Africa (%)
Place of birth for the foreign-born population - Cabo Verde (%)
Place of birth for the foreign-born population - Ghana (%)
Place of birth for the foreign-born population - Liberia (%)
Place of birth for the foreign-born population - Nigeria (%)
Place of birth for the foreign-born population - Senegal (%)
Place of birth for the foreign-born population - Sierra Leone (%)
Place of birth for the foreign-born population - Other Western Africa (%)
Place of birth for the foreign-born population - Australia (%)
Place of birth for the foreign-born population - New Zealand (%)
Place of birth for the foreign-born population - Fiji (%)
Place of birth for the foreign-born population - Micronesia (%)
Place of birth for the foreign-born population - Bahamas (%)
Place of birth for the foreign-born population - Barbados (%)
Place of birth for the foreign-born population - Cuba (%)
Place of birth for the foreign-born population - Dominica (%)
Place of birth for the foreign-born population - Dominican Republic (%)
Place of birth for the foreign-born population - Grenada (%)
Place of birth for the foreign-born population - Haiti (%)
Place of birth for the foreign-born population - Jamaica (%)
Place of birth for the foreign-born population - St. Vincent and the Grenadines (%)
Place of birth for the foreign-born population - Trinidad and Tobago (%)
Place of birth for the foreign-born population - West Indies (%)
Place of birth for the foreign-born population - Other Caribbean (%)
Place of birth for the foreign-born population - Belize (%)
Place of birth for the foreign-born population - Costa Rica (%)
Place of birth for the foreign-born population - El Salvador (%)
Place of birth for the foreign-born population - Guatemala (%)
Place of birth for the foreign-born population - Honduras (%)
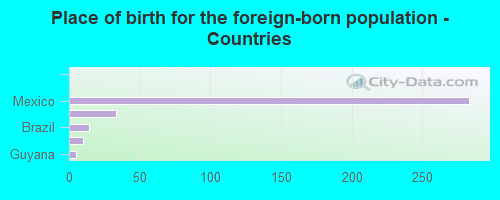
Place of birth for the foreign-born population - Mexico (%)
Place of birth for the foreign-born population - Nicaragua (%)
Place of birth for the foreign-born population - Panama (%)
Place of birth for the foreign-born population - Other Central America (%)
Place of birth for the foreign-born population - Argentina (%)
Place of birth for the foreign-born population - Bolivia (%)
Place of birth for the foreign-born population - Brazil (%)
Place of birth for the foreign-born population - Chile (%)
Place of birth for the foreign-born population - Colombia (%)
Place of birth for the foreign-born population - Ecuador (%)
Place of birth for the foreign-born population - Guyana (%)
Place of birth for the foreign-born population - Peru (%)
Place of birth for the foreign-born population - Uruguay (%)
Place of birth for the foreign-born population - Venezuela (%)
Place of birth for the foreign-born population - Other South America (%)
Place of birth for the foreign-born population - Canada (%)
Place of birth for the foreign-born population - Other Northern America (%)
Place of birth for the foreign-born population - Other (%)
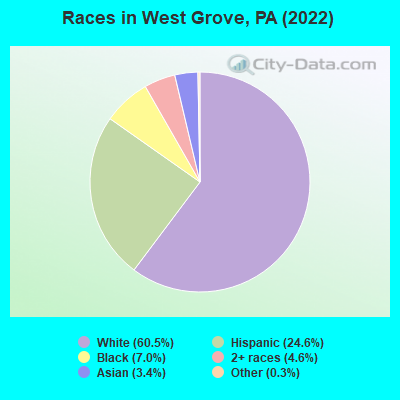
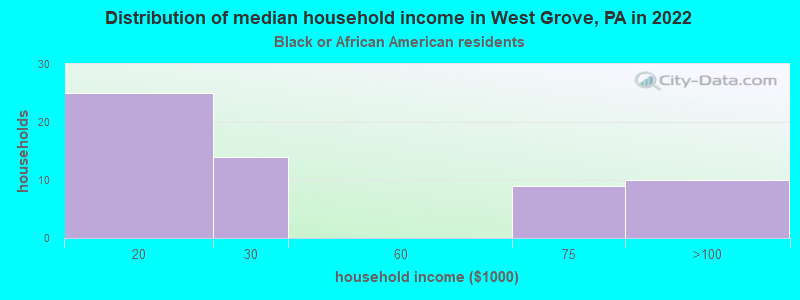
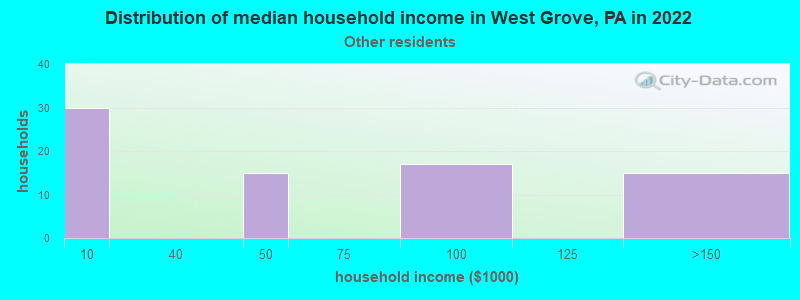
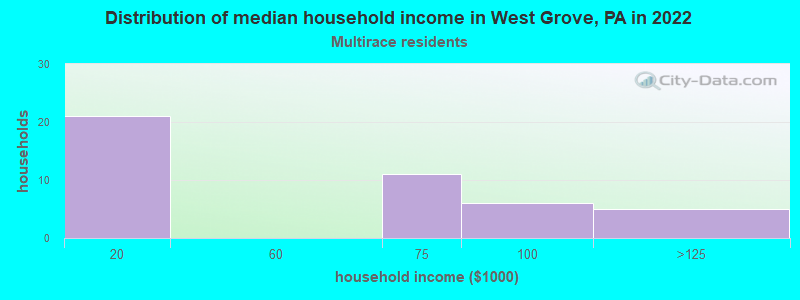
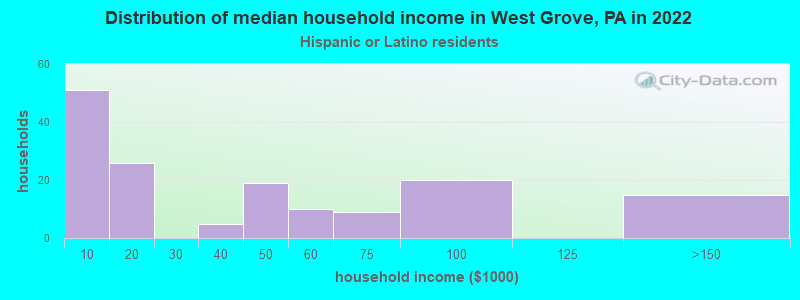
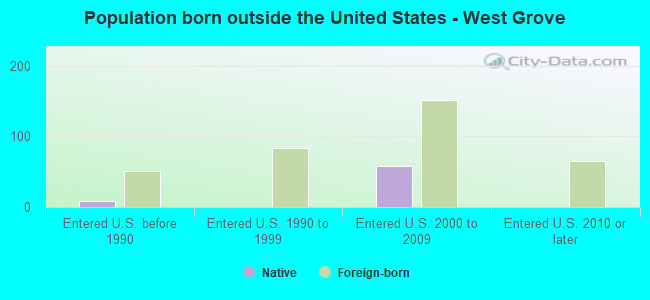
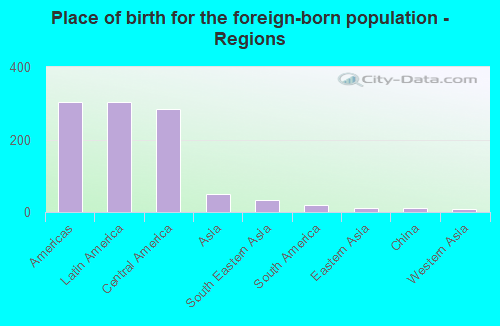
According to 2022 data, the most numerous races in West Grove, PA are White alone (1,712 residents), Black alone (197 residents), and Hispanic (697 residents). 77.2% of West Grove residents speak English at home. 12.5% of West Grove, PA residents are foreign-born (10.5% born in Latin America, 1.7% born in Asia), which is 44.0% greater than the foreign-born rate of 7.0% across the entire state of Pennsylvania.
Race distribution in West Grove
2000 2022
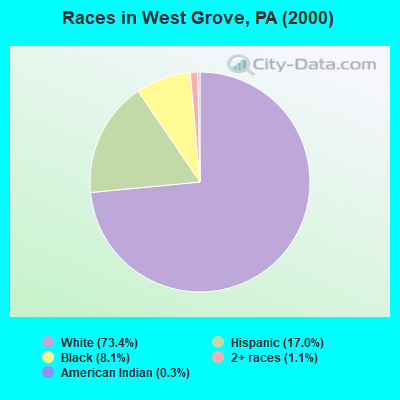
10,322,455 84.1% White alone 1,202,437 9.8% Black alone 394,088 3.2% Hispanic 218,296 1.8% Asian alone 113,097 0.9% Two or more races 13,086 0.1% Other race alone 14,904 0.1% American Indian alone 2,691 0.02% Native Hawaiian and Other
9,487,228 73.1% White alone 1,311,581 10.1% Black alone 1,115,997 8.6% Hispanic 493,942 3.8% Two or more races 487,124 3.8% Asian alone 63,582 0.5% Other race alone 10,130 0.08% American Indian alone 2,424 0.02% Native Hawaiian and Other
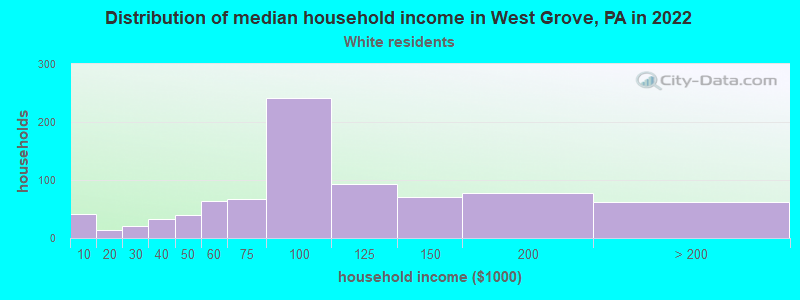
Income and house value in West Grove Median household income in 2022 $90,794 White non-Hispanic householders$46,063 Hispanic or Latino race householdersMedian 2022 house value $293,938 White Non-Hispanic householders$223,384 Black or African American householders $439,502 Asian householders$225,728 Some other race householders$293,001 Hispanic or Latino householders
Median age by race in West Grove
39.4 Median age for White residents32.7 42.5 43.7 Median age for Black or African American residents44.1 40.8 -591,549,295.2 Median age for American Indian / Alaska Native residents-596,491,227.5 -593,055,555.0 18.5 Median age for Asian residents-708,333,332.6 18.6 -596,045,197.1 Median age for Native Hawaiian / Pacific Islander residents-665,394,401.4 -747,474,746.7 31.3 Median age for Other race residents30.9 26.9 22.8 Median age for Two or more races residents17.4 24.0 40.6 Median age for White alone residents37.8 42.9 24.9 Median age for Hispanic or Latino residents24.3 25.5
Owner/renter occupied households by race in West Grove
House owners and renters - White residents 641 79.7% Owner occupied163 20.3% Renter occupiedHouse owners and renters - Black or African American residents 59 100.0% Owner occupiedHouse owners and renters - Asian residents 17 100.0% Owner occupiedHouse owners and renters - Other race residents 36 54.5% Owner occupied30 45.5% Renter occupiedHouse owners and renters - Two or more races residents 9 21.9% Owner occupied32 78.1% Renter occupiedHouse owners and renters - White alone residents 637 83.0% Owner occupied130 17.0% Renter occupiedHouse owners and renters - Hispanic or Latino residents 35 28.3% Owner occupied90 71.7% Renter occupied
Language usage in West Grove
English speakers - Total 77.2% of residents of West Grove speak English at home.
18.7% of residents speak Spanish at home 255 51.8% Speak English very well237 48.2% Speak English less than very well2.9% of residents speak other language at home 38 50.0% Speak English very well38 50.0% Speak English less than very well
English speakers - Born in the United States 96.5% of residents of West Grove speak English at home.
1.9% of residents speak Spanish at home 5 45.5% Speak English very well6 54.5% Speak English less than very well
English speakers - Native, born elsewhere 19.3% of residents of West Grove speak English at home.
40.4% of residents speak Spanish at home 23 100.0% Speak English very well
English speakers - Foreign-born 11.2% of residents of West Grove speak English at home.
72.1% of residents speak Spanish at home 60 23.3% Speak English very well198 76.7% Speak English less than very well9.5% of residents speak other language at home 15 44.1% Speak English very well19 55.9% Speak English less than very well
White (Caucasian) - Speak only English Native:
96.6% (1,605)Foreign-born:
26.3% (20)
White (Caucasian) - Speak another language Native:
3.3% (55)Foreign-born:
71.0% (54)
Asian - Speak another language Native:
100.0% (43)Foreign-born:
72.7% (31)
Other race - Speak another language Native:
85.2% (56)Foreign-born:
95.6% (139)
Two or more races - Speak only English Native:
56.2% (200)Foreign-born:
3.5% (6)
Two or more races - Speak another language Native:
47.4% (169)Foreign-born:
100.0% (162)
White alone - Speak only English Native:
98.6% (1,607)Foreign-born:
87.5% (19)
Hispanic or Latino - Speak another language Native:
63.5% (209)Foreign-born:
96.1% (256)
Foreign-born residents in West Grove 354 residents are foreign born (10.5% Latin America , 1.7% Asia ).
This city:
12.5%Pennsylvania:
7.3%
Marital status for residents in West Grove Marital status - White (Caucasian) population 15 years and over
Males 34.0% Never married51.3% Now married2.6% Separated0.7% Widowed11.4% DivorcedFemales 30.2% Never married43.2% Now married3.5% Separated6.7% Widowed16.4% DivorcedWomen who gave birth in the past 12 months Now married:
53.1% (43)Unmarried:
46.9% (38)
Women who did not give birth in the past 12 months Now married:
38.8% (157)Unmarried:
61.2% (247)
Marital status - Black or African American population 15 years and over
Males 93.0% Never married7.0% Now married0.0% Separated0.0% Widowed0.0% DivorcedFemales 57.9% Never married19.0% Now married0.0% Separated19.0% Widowed4.1% DivorcedWomen who did not give birth in the past 12 months Now married:
29.0% (17)Unmarried:
71.0% (41)
Marital status - Asian population 15 years and over
Males 0.0% Never married100.0% Now married0.0% Separated0.0% Widowed0.0% DivorcedFemales 62.5% Never married37.5% Now married0.0% Separated0.0% Widowed0.0% DivorcedWomen who did not give birth in the past 12 months Now married:
37.5% (17)Unmarried:
62.5% (28)
Marital status - Other race population 15 years and over
Males 31.3% Never married59.7% Now married0.0% Separated0.0% Widowed9.0% DivorcedFemales 50.0% Never married16.7% Now married33.3% Separated0.0% Widowed0.0% DivorcedWomen who gave birth in the past 12 months Now married:
0.0% (0)Unmarried:
100.0% (31)
Women who did not give birth in the past 12 months Now married:
41.0% (20)Unmarried:
59.0% (29)
Marital status - Two or more races population 15 years and over
Males 61.5% Never married30.8% Now married0.0% Separated0.0% Widowed7.7% DivorcedFemales 70.7% Never married20.2% Now married0.0% Separated9.1% Widowed0.0% DivorcedWomen who gave birth in the past 12 months Now married:
100.0% (19)Unmarried:
0.0% (0)
Women who did not give birth in the past 12 months Now married:
6.4% (14)Unmarried:
93.6% (213)
Marital status - White alone, not Hispanic / Latino population 15 years and over
Males 32.4% Never married52.4% Now married2.7% Separated0.7% Widowed11.8% DivorcedFemales 29.7% Never married44.7% Now married3.7% Separated7.1% Widowed14.8% DivorcedWomen who gave birth in the past 12 months Now married:
67.2% (43)Unmarried:
32.8% (21)
Women who did not give birth in the past 12 months Now married:
40.8% (158)Unmarried:
59.2% (229)
Marital status - Hispanic or Latino population 15 years and over
Males 53.7% Never married38.9% Now married0.0% Separated0.0% Widowed7.4% DivorcedFemales 62.2% Never married16.5% Now married9.6% Separated5.7% Widowed6.0% DivorcedWomen who gave birth in the past 12 months Now married:
23.6% (13)Unmarried:
76.4% (42)
Women who did not give birth in the past 12 months Now married:
12.3% (26)Unmarried:
87.7% (186)
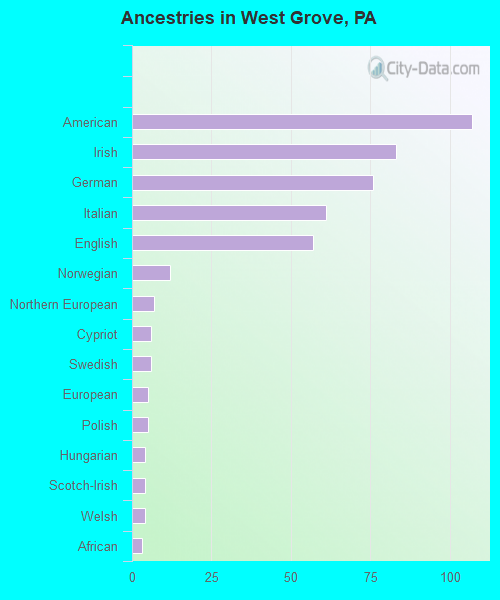
Ancestries in West Grove
107 8.6% American83 6.7% Irish76 6.1% German61 4.9% Italian57 4.6% English12 1.0% Norwegian7 0.6% Northern European6 0.5% Cypriot6 0.5% Swedish5 0.4% European5 0.4% Polish4 0.3% Hungarian4 0.3% Scotch-Irish4 0.3% Welsh3 0.2% African
Children Nativity (place of birth) in West Grove
Children under 6 years - Living with two parents Both parents native 107 100.0% NativeBoth parents foreign-born 52 100.0% NativeChildren under 6 years - Living with one parent Native parent 20 100.0% NativeForeign-born parent 45 100.0% NativeChildren 6 to 17 years - Living with two parents Both parents native 179 99.8% Native0 0.2% Foreign-bornBoth parents foreign-born 62 92.7% Native5 7.3% Foreign-bornChildren 6 to 17 years - Living with one parent Native parent 146 100.0% NativeForeign-born parent 131 47.6% Native144 52.4% Foreign-born
Grandparents responsible for own grandchildren in West Grove
Grandparents (30 to 59 years) Two or more races 19 100.0% Not responsible for grandchildrenHispanic or Latino 23 100.0% Not responsible for grandchildren
Grandparents (60 years and over)