St. Joseph, TN (Tennessee) Houses and Residents
| St. Joseph: | $150,805 |
| Tennessee: | $284,800 |
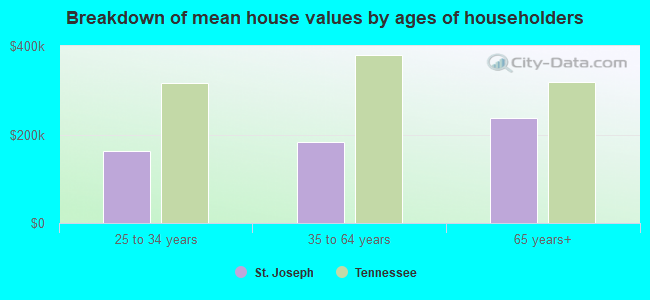
Mean price in 2022:
Detached houses: $183,949
Here: $183,949 State: $374,382 Mobile homes: $39,678
Here: $39,678 State: $101,421
Total population: 785 (Urban population: 0, Rural population: 866 (13 farm, 853 nonfarm))
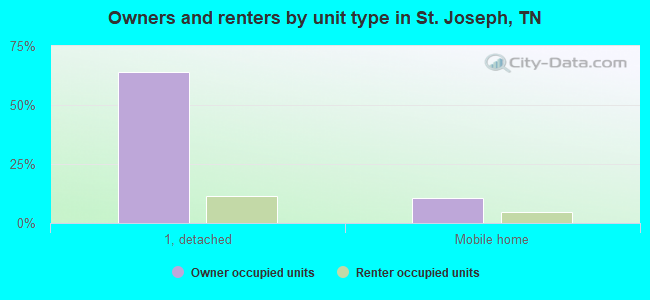
Houses: 389 (332 occupied: 253 owner occupied, 84 renter occupied)
| % of renters here: | 25% |
| State: | 33% |
Housing density: 108 houses/condos per square mile
Median price asked for vacant for-sale houses and condos in 2022 in this county: $158,181.
Median contract rent in 2022: $470 (lower quartile is $397, upper quartile is $600)
Median rent asked for vacant for-rent units in 2022: $401
Median gross rent in St. Joseph, TN in 2022: $606
Housing units in St. Joseph with a mortgage: 118 (0 second mortgage, 0 home equity loan, 0 both second mortgage and home equity loan)
Houses without a mortgage: 7
Median household income for houses/condos with a mortgage: $69,309
Median household income for apartments without a mortgage: $29,714
Median monthly housing costs: $610
Compare current foreclosures near St. Joseph, TN:
| Photo | Address | Area | Beds / Baths | Price | Details |
|---|---|---|---|---|---|

|
#1
Joe Richardson Rd
Florence, AL 35634
|
1,036 sq. feet
|
1 baths 3 beds |
show details | |

|
#2
County Road 601
Rogersville, AL 35652
|
1,100 sq. feet
|
1 baths 3 beds |
show details | |

|
#3
County Road 290
Florence, AL 35633
|
1,344 sq. feet
|
2 baths 4 beds |
show details | |

|
#4
N Military St
Loretto, TN 38469
|
1,524 sq. feet
|
2 baths 4 beds |
show details | |

|
#5
Holiday Dr
Florence, AL 35630
|
1,539 sq. feet
|
2 baths 3 beds |
show details | |

|
#6
County Road 584
Rogersville, AL 35652
|
1,568 sq. feet
|
1 baths - beds |
show details | |

|
#7
Frances Dr
Killen, AL 35645
|
1,726 sq. feet
|
2 baths - beds |
show details | |

|
#8
Plantation Dr
Killen, AL 35645
|
2,016 sq. feet
|
2 baths - beds |
show details | |

|
#9
Highway 101
Rogersville, AL 35652
|
1,593 sq. feet
|
1 baths - beds |
show details | |

|
#10
Brandenburg Dr
Florence, AL 35634
|
1,653 sq. feet
|
2 baths - beds |
show details |
| Photo | Address | Area | Beds / Baths | Price | Details |
|---|---|---|---|---|---|

|
#11
Dunolly Ln
Florence, AL 35633
|
1,810 sq. feet
|
2 baths - beds |
show details | |

|
#12
Walnut Creek Rd
Killen, AL 35645
|
1,965 sq. feet
|
2 baths - beds |
show details | |

|
#13
Mary Lee Dr
Florence, AL 35634
|
1,595 sq. feet
|
2 baths - beds |
show details | |

|
#14
Commanche Cir
Collinwood, TN 38450
|
1,425 sq. feet
|
2 baths - beds |
show details | |

|
#15
Shelton Dr
Saint Joseph, TN 38481
|
1,272 sq. feet
|
1 baths - beds |
show details | |

|
#16
Glenn Springs Rd
Lawrenceburg, TN 38464
|
960 sq. feet
|
2 baths - beds |
show details | |

|
#17
School St
Saint Joseph, TN 38481
|
3,566 sq. feet
|
1 baths - beds |
show details | |

|
#18
Shady Ln
Lawrenceburg, TN 38464
|
3,138 sq. feet
|
2 baths - beds |
show details | |

|
#19
Middle Butler Rd
Collinwood, TN 38450
|
1,600 sq. feet
|
1 baths - beds |
show details | |

|
#20
Dunolly Ln
Florence, AL 35633
|
1,772 sq. feet
|
2 baths - beds |
show details |
| Photo | Address | Area | Beds / Baths | Price | Details |
|---|---|---|---|---|---|

|
#21
Grandaddy Rd
Lawrenceburg, TN 38464
|
1,123 sq. feet
|
1 baths - beds |
show details | |

|
#22
Hayes Rd
Lawrenceburg, TN 38464
|
1,698 sq. feet
|
1 baths - beds |
show details | |

|
#23
Roxie Dr
Florence, AL 35633
|
2,550 sq. feet
|
2 baths - beds |
show details | |

|
#24
White Oak Dr
Leoma, TN 38468
|
1,360 sq. feet
|
2 baths - beds |
show details | |

|
#25
Dogwood Dr
Florence, AL 35630
|
1,080 sq. feet
|
1 baths - beds |
show details | |

|
#26
Eastwood Dr
Florence, AL 35630
|
1,056 sq. feet
|
1 baths - beds |
show details | |

|
#27
Camelot Way
Florence, AL 35633
|
1,771 sq. feet
|
2 baths - beds |
show details | |

|
#28
N Eclipse St
Florence, AL 35630
|
1,064 sq. feet
|
1 baths - beds |
show details | |

|
#29
County Road 531
Anderson, AL 35610
|
2,146 sq. feet
|
4 baths - beds |
show details | |

|
#30
Marable Rd
Lawrenceburg, TN 38464
|
1,172 sq. feet
|
1 baths - beds |
show details |
| Photo | Address | Area | Beds / Baths | Price | Details |
|---|---|---|---|---|---|

|
#31
Chestnut Ln
Lawrenceburg, TN 38464
|
1,488 sq. feet
|
2 baths - beds |
show details | |

|
#32
Factors Fork Rd
Westpoint, TN 38486
|
1,264 sq. feet
|
1 baths - beds |
show details | |

|
#33
Dunn Rd
Leoma, TN 38468
|
1,056 sq. feet
|
1 baths - beds |
show details | |

|
#34
Summers Dr
Florence, AL 35634
|
1,512 sq. feet
|
2 baths - beds |
show details | |

|
#35
Williams Hollow Rd
Iron City, TN 38463
|
1,025 sq. feet
|
1 baths - beds |
show details | |

|
#36
Carolina Dr
Killen, AL 35645
|
2,060 sq. feet
|
2 baths - beds |
show details | |

|
#37
County Road 388
Killen, AL 35645
|
1,837 sq. feet
|
2 baths - beds |
show details | |

|
#38
Railroad Bed Rd
Iron City, TN 38463
|
1,570 sq. feet
|
1 baths - beds |
show details | |

|
#39
Ezell Ln
Loretto, TN 38469
|
852 sq. feet
|
1 baths - beds |
show details | |

|
#40
Old Jackson Hwy
Loretto, TN 38469
|
1,616 sq. feet
|
1 baths - beds |
show details |
| Photo | Address | Area | Beds / Baths | Price | Details |
|---|---|---|---|---|---|

|
#41
S Military St
Loretto, TN 38469
|
1,440 sq. feet
|
1 baths - beds |
show details | |

|
#42
County Road 47
Florence, AL 35634
|
1,344 sq. feet
|
2 baths - beds |
show details | |

|
#43
County Road 159
Lexington, AL 35648
|
384 sq. feet
|
1 baths - beds |
show details | |

|
#44
Belview Rd Apt E21
Florence, AL 35630
|
- sq. feet
|
- baths - beds |
show details | |

|
#45
Chisholm Rd # 1204
Florence, AL 35630
|
- sq. feet
|
- baths - beds |
show details | |

|
#46
Pine Brook Dr
Florence, AL 35633
|
- sq. feet
|
- baths - beds |
show details | |

|
#47
Highway 64
Killen, AL 35645
|
1,568 sq. feet
|
- baths - beds |
show details | |

|
#48
Colonial Dr
Florence, AL 35633
|
1,350 sq. feet
|
- baths - beds |
show details | |

|
#49
County Road 475
Killen, AL 35645
|
- sq. feet
|
- baths - beds |
show details | |

|
Check over 1 million property listings on Foreclosure.com!
|
browse all offers | |||


 | News, 5 Cities Where Poverty is Soaring, Cookeville on the list. (16 replies) |
| Looking for a small safe town in Tennessee to raise our kids (13 replies) |
| Nashville of the past, 90's and before (104 replies) |
| Nashville history and cool places to visit. (2 replies) |
| Memphis has the nation's greatest living and active CEO! (4 replies) |
| Can anyone tell me about Iron City TN? (59 replies) |

Median year apartment built: 1977
Household type by relationship:
Households: 799- Male householders: 128 (44 living alone), Female householders: 200 (86 living alone)
127 spouses (125 opposite-sex spouses), 12 unmarried partners, (12 opposite-sex unmarried partners), 267 children (237 natural, 26 adopted, 4 stepchildren), 24 grandchildren, 0 brothers or sisters, 10 parents, 7 foster children, 16 other relatives, 5 non-relatives
Size of family households: 60 2-persons, 76 3-persons, 30 4-persons, 19 5-persons, 4 6-persons, 2 7-or-more-persons.
Size of nonfamily households: 133 1-person, 9 2-persons, 2 3-persons.
102 married couples with children.
24 single-parent households (0 men, 24 women).
97.2% of residents of St. Joseph speak English at home.
0.6% of residents speak Spanish at home (20% speak English not well, 80% don't speak English at all).
1.9% of residents speak other Indo-European language at home (100% speak English not well).
Foreign born population: 20 (2.5%)
(0.0% of them are naturalized citizens)
| Here: | 6.7 |
| State: | 6.5 |
| Here: | 4.0 |
| State: | 4.4 |
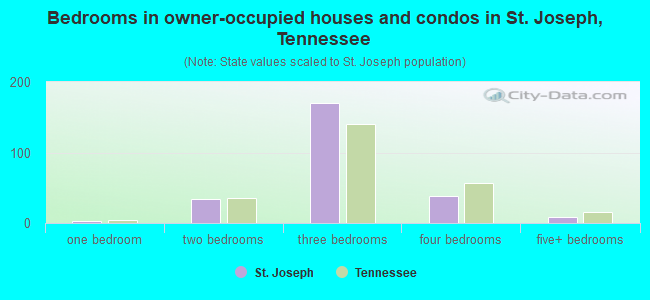
- Bedrooms in owner-occupied houses and condos in St. Joseph, Tennessee
- 0no bedroom
- 31 bedroom
- 342 bedrooms
- 1703 bedrooms
- 384 bedrooms
- 95+ bedrooms
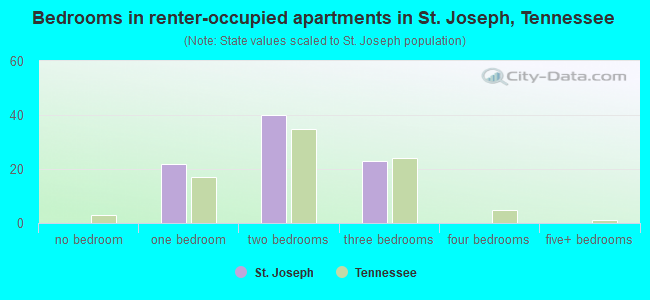
- Bedrooms in renter-occupied apartments in St. Joseph, Tennessee
- 0no bedroom
- 221 bedroom
- 402 bedrooms
- 233 bedrooms
- 04 bedrooms
- 05+ bedrooms
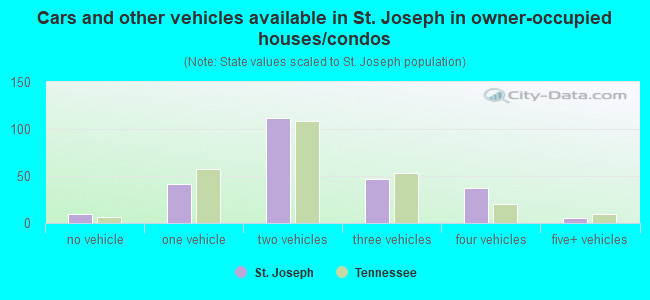
- Cars and other vehicles available in St. Joseph in owner-occupied houses/condos
- 10no vehicle
- 421 vehicle
- 1122 vehicles
- 473 vehicles
- 374 vehicles
- 55+ vehicles
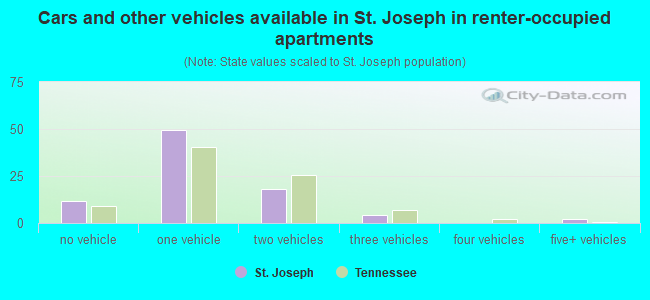
- Cars and other vehicles available in St. Joseph in renter-occupied apartments
- 12no vehicle
- 491 vehicle
- 182 vehicles
- 43 vehicles
- 04 vehicles
- 25+ vehicles
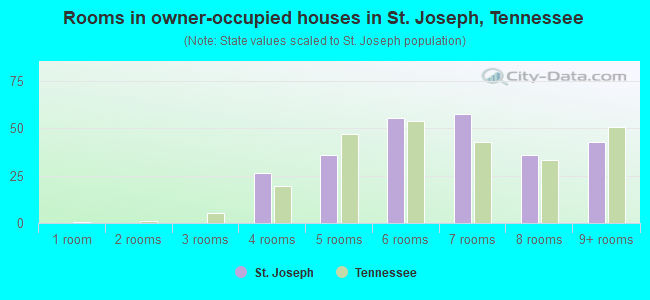
- Rooms in owner-occupied houses in St. Joseph, Tennessee
- 01 room
- 02 rooms
- 03 rooms
- 264 rooms
- 365 rooms
- 566 rooms
- 587 rooms
- 368 rooms
- 439+ rooms
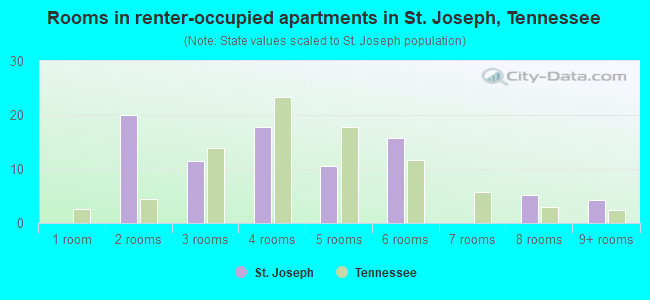
- Rooms in renter-occupied apartments in St. Joseph, Tennessee
- 01 room
- 202 rooms
- 123 rooms
- 184 rooms
- 105 rooms
- 166 rooms
- 07 rooms
- 58 rooms
- 49+ rooms
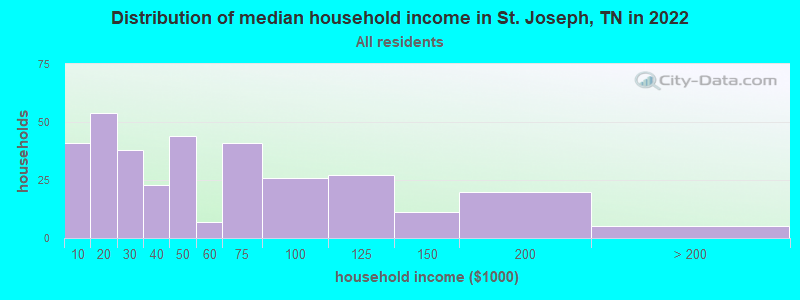
St. Joseph, TN household income distribution

- 41Less than $10,000
- 54$10,000 to $19,999
- 38$20,000 to $29,999
- 23$30,000 to $39,999
- 44$40,000 to $49,999
- 7$50,000 to $59,999
- 41$60,000 to $74,999
- 26$75,000 to $99,999
- 27$100,000 to $124,999
- 11$125,000 to $149,999
- 20$150,000 to $199,999
- 5$200,000 or more
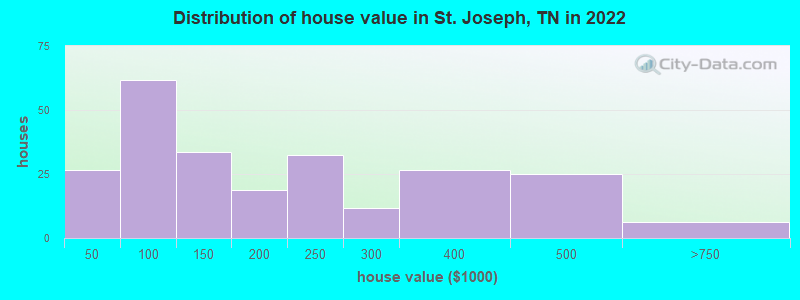
Home value of owner - occupied houses in 2022 in St. Joseph, TN
-
- 7$10,000 to $14,999
- 1$20,000 to $24,999
- 7$30,000 to $34,999
- 9$40,000 to $49,999
- 8$50,000 to $59,999
- 12$60,000 to $69,999
- 23$70,000 to $79,999
- 5$80,000 to $89,999
- 2$90,000 to $99,999
- 29$100,000 to $124,999
- 4$125,000 to $149,999
- 15$150,000 to $174,999
- 3$175,000 to $199,999
- 32$200,000 to $249,999
- 11$250,000 to $299,999
- 26$300,000 to $399,999
- 24$400,000 to $499,999
- 6$500,000 to $749,999
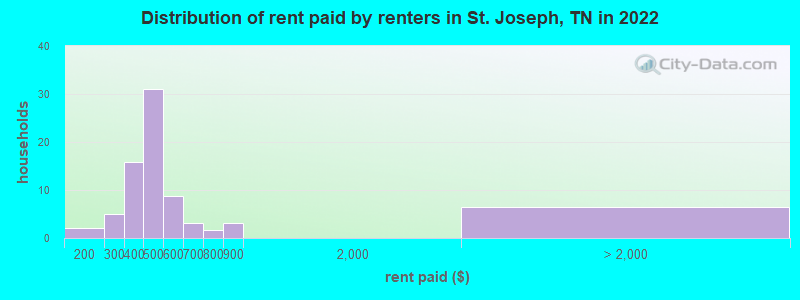
Rent paid by renters in 2022 in St. Joseph, TN
-
- 2$150 to $199
- 2$200 to $249
- 2$250 to $299
- 7$300 to $349
- 8$350 to $399
- 21$400 to $449
- 9$450 to $499
- 8$550 to $599
- 3$600 to $649
- 1$700 to $749
- 3$800 to $899
- 6No cash rent
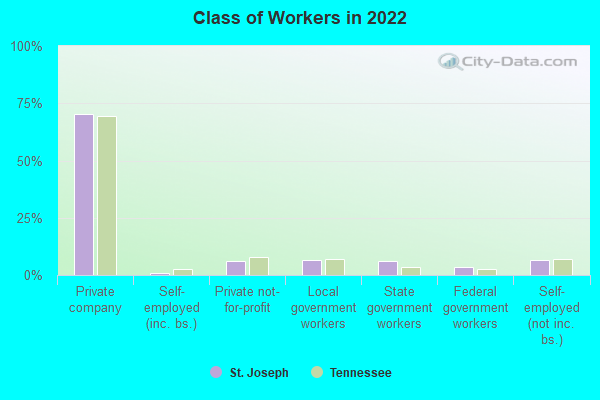
Percentage of workers working in this county: 69.0%
Number of people working at home: 53 (14.5% of all workers)
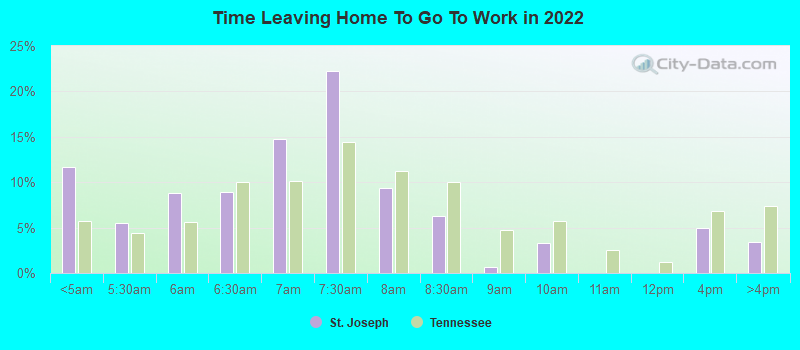
Travel time to work (commute)
- Less than 5 minutes: 24
- 5 to 9 minutes: 34
- 10 to 14 minutes: 28
- 15 to 19 minutes: 20
- 20 to 24 minutes: 38
- 25 to 29 minutes: 31
- 30 to 34 minutes: 60
- 35 to 39 minutes: 0
- 40 to 44 minutes: 3
- 45 to 59 minutes: 39
- 60 to 89 minutes: 7
- 90 or more minutes: 30
Means of transportation to work:
- Drove a car alone: 276 (79.1%)
- Carpooled: 51 (14.6%)
- Bus or trolley bus: 1 (0.3%)
- Walked: 5 (1.4%)
- Other means: 2 (0.6%)
- Worked at home: 14 (4.0%)
- Unemployment by race in 2022
- Unemployment rate for White non-Hispanic residents
- 4.2%Males
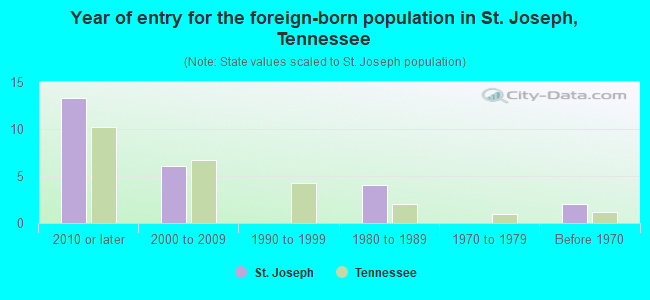
- Year of entry for the foreign-born population in St. Joseph, Tennessee
- 132010 or later
- 62000 to 2009
- 01990 to 1999
- 41980 to 1989
- 01970 to 1979
- 2Before 1970
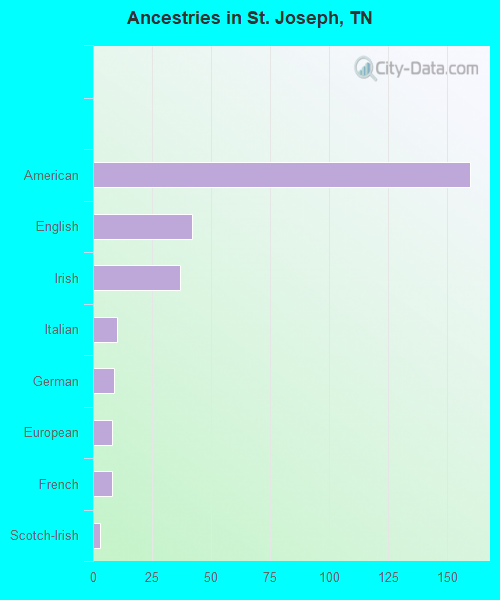
First ancestries reported:
- American: 160 (41.2%)
- English: 42 (10.8%)
- Irish: 37 (9.5%)
- Italian: 10 (2.6%)
- German: 9 (2.3%)
- European: 8 (2.1%)
- French: 8 (2.1%)
- Scotch-Irish: 3 (0.8%)
Most common places of birth for foreign-born residents (%):
| St. Joseph: | 65.0% (13) |
| Tennessee: | 6.1% (23,079) |
| St. Joseph: | 25.0% (5) |
| Tennessee: | 23.0% (86,435) |
Place of birth for U.S.-born residents:
- This state: 554
- Other state: 219
- Northeast: 11
- Midwest: 15
- South: 179
- West: 11
92.9% of St. Joseph residents lived in the same house 1 years ago.
Out of people who lived in different houses, 44.7% lived in this county.
Out of people who lived in different counties, 50.0% lived in Tennessee.
| St. Joseph: | 92.9% |
| State average: | 87.0% |
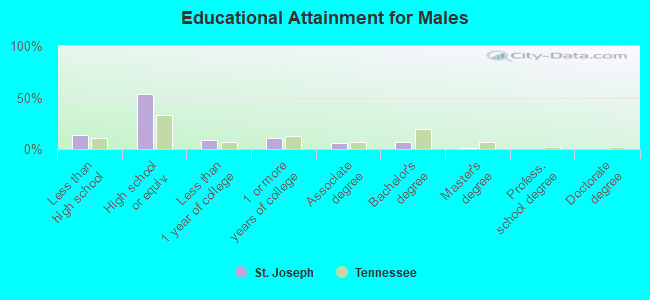
Education attainment for males 25 years and older:
- No schooling: 13
- Nursery to 4th grade: 2
- 5th and 6th grade: 1
- 7th and 8th grade: 3
- 9th grade: 10
- 10th grade: 4
- 11th grade: 1
- 12th grade, no diploma: 4
- High school graduate (or equivalency): 147
- Less than 1 year of college: 24
- Some college more than 1 year, no degree: 30
- Associate degree: 16
- Bachelor's degree: 19
- Master's degree: 3
- Professional school degree: 0
- Doctorate degree: 0
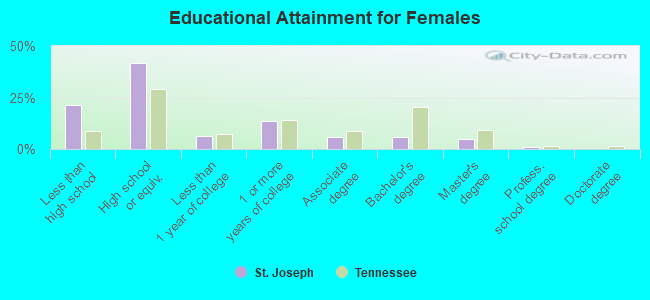
Education attainment for females 25 years and older:
- No schooling: 20
- Nursery to 4th grade: 2
- 5th and 6th grade: 2
- 7th and 8th grade: 0
- 9th grade: 8
- 10th grade: 6
- 11th grade: 13
- 12th grade, no diploma: 9
- High school graduate (or equivalency): 116
- Less than 1 year of college: 17
- Some college more than 1 year, no degree: 38
- Associate degree: 16
- Bachelor's degree: 16
- Master's degree: 13
- Professional school degree: 3
- Doctorate degree: 0


Housing units in structures:
- One, detached: 323
- One, attached: 4
- Two: 23
- Mobile homes: 36
- Boats, RVs, vans, etc.: 2
Housing units lacking complete kitchen facilities in 2022: 9.3%
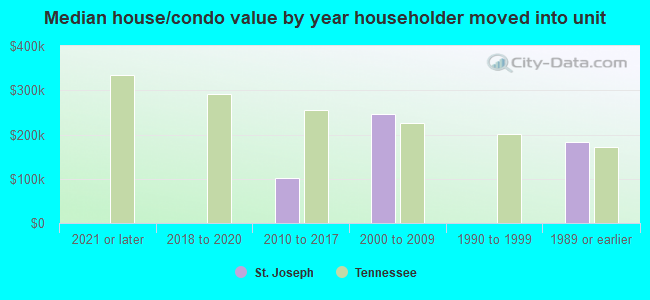
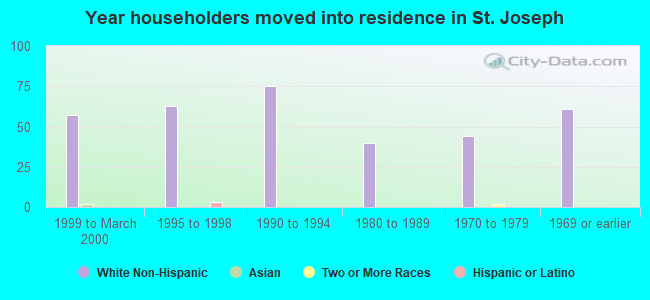
House/condo owner moved in on average 16 years ago
Renter moved in on average 6 years ago
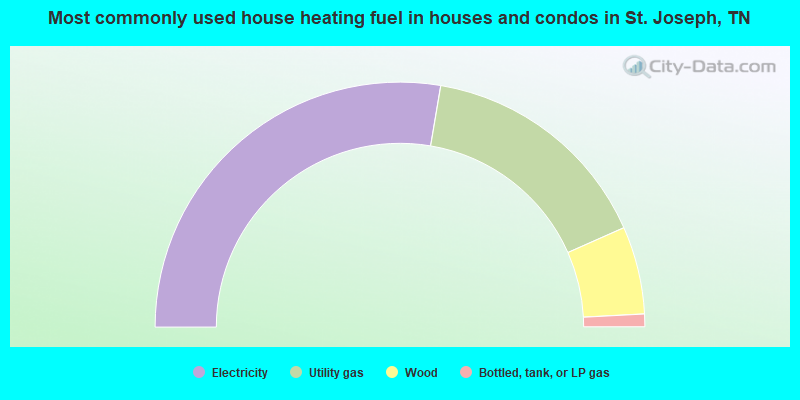
- 55.4%Electricity
- 31.4%Utility gas
- 11.6%Wood
- 1.7%Bottled, tank, or LP gas
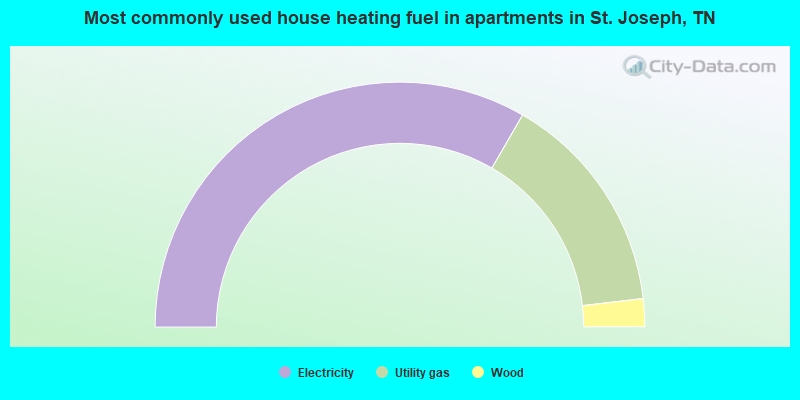
- 66.7%Electricity
- 29.6%Utility gas
- 3.7%Wood
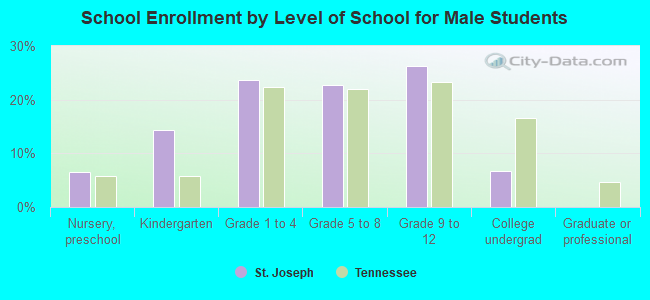
Private vs. public school enrollment:
| Here: | 6.3% |
| Tennessee: | 15.0% |
| Here: | 2.6% |
| Tennessee: | 16.2% |
| Here: | 0.0% |
| Tennessee: | 23.5% |