Work and Jobs in St. Joseph, Tennessee (TN) Detailed Stats
Occupations, Industries, Unemployment, Workers, Commute
Settings
X


Recent posts about work in St. Joseph, Tennessee on our local forum with over 2,400,000 registered users:
 | News, 5 Cities Where Poverty is Soaring, Cookeville on the list. (16 replies) |
| Nashville of the past, 90's and before (104 replies) |
| Nashville history and cool places to visit. (2 replies) |
| Dillard's is closing (48 replies) |
| What about Powell? (24 replies) |
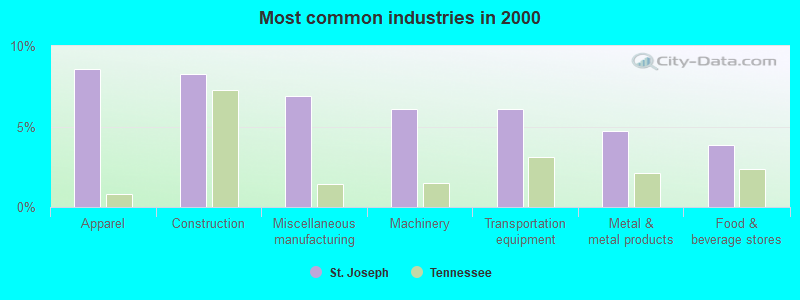
The most common industries in St. Joseph are: Apparel (8.6% of civilian employees), Construction (8.3% of civilian employees), Miscellaneous manufacturing (6.9% of civilian employees). 68.2% of workers work in Lawrence County and 10.6% of all workers work at home. 70.1% of workers are employees of private companies, which is about the same as the rate of 69.4% across the entire state of Tennessee.
Whole page based on the data from 2000 / 2022 when the population of St. Joseph, Tennessee was 829 / 799
Whole page based on the data from 2000 / 2022 when the population of St. Joseph, Tennessee was 829 / 799
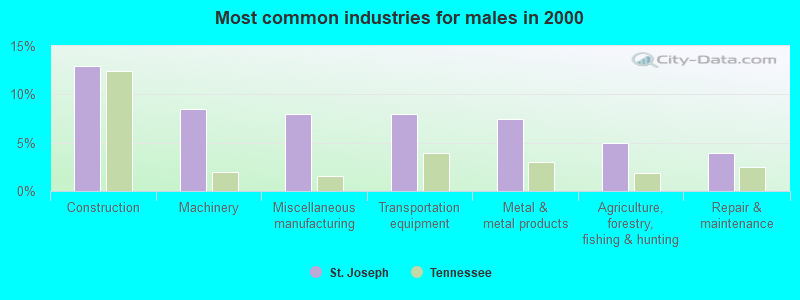
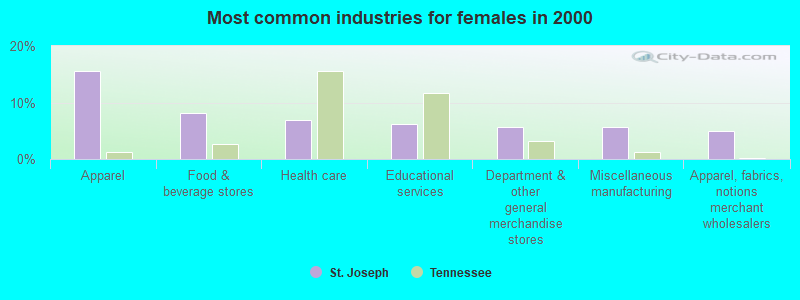
Most common industries
Most common industries | |||
|---|---|---|---|
Industry | All | Males | Females |
| Apparel | 8.6% (31) | 3.0% (6) | 15.5% (25) |
| Construction | 8.3% (30) | 12.9% (26) | 2.5% (4) |
| Miscellaneous manufacturing | 6.9% (25) | 8.0% (16) | 5.6% (9) |
| Machinery | 6.1% (22) | 8.5% (17) | 3.1% (5) |
| Transportation equipment | 6.1% (22) | 8.0% (16) | 3.7% (6) |
| Metal and metal products | 4.7% (17) | 7.5% (15) | 1.2% (2) |
| Food and beverage stores | 3.9% (14) | 0.5% (1) | 8.1% (13) |
| Department and other general merchandise stores | 3.9% (14) | 2.5% (5) | 5.6% (9) |
| Health care | 3.6% (13) | 1.0% (2) | 6.8% (11) |
| Educational services | 3.3% (12) | 1.0% (2) | 6.2% (10) |
| Repair and maintenance | 3.0% (11) | 4.0% (8) | 1.9% (3) |
| Agriculture, forestry, fishing and hunting | 2.8% (10) | 5.0% (10) | 0.0% (0) |
| Apparel, fabrics, and notions merchant wholesalers | 2.8% (10) | 1.0% (2) | 5.0% (8) |
| Administrative and support and waste management services | 2.8% (10) | 3.5% (7) | 1.9% (3) |
| Broadcasting and telecommunications | 2.8% (10) | 2.5% (5) | 3.1% (5) |
| Accommodation and food services | 2.5% (9) | 1.5% (3) | 3.7% (6) |
| Building material and garden equipment and supplies dealers | 1.9% (7) | 3.5% (7) | 0.0% (0) |
| Textile mills and textile products | 1.7% (6) | 1.0% (2) | 2.5% (4) |
| Personal and laundry services | 1.7% (6) | 0.5% (1) | 3.1% (5) |
| Clothing and accessories, including shoe, stores | 1.7% (6) | 1.0% (2) | 2.5% (4) |
| Public administration | 1.4% (5) | 0.5% (1) | 2.5% (4) |
| Nonmetallic mineral products | 1.4% (5) | 2.5% (5) | 0.0% (0) |
| Pharmacies and drug stores | 1.4% (5) | 0.0% (0) | 3.1% (5) |
| Truck transportation | 1.4% (5) | 2.5% (5) | 0.0% (0) |
| Rail transportation | 1.1% (4) | 2.0% (4) | 0.0% (0) |
| Furniture and related product manufacturing | 1.1% (4) | 2.0% (4) | 0.0% (0) |
| Other transportation, and support activities, and couriers | 1.1% (4) | 2.0% (4) | 0.0% (0) |
| Finance and insurance | 1.1% (4) | 0.0% (0) | 2.5% (4) |
| Mining, quarrying, and oil and gas extraction | 0.8% (3) | 1.5% (3) | 0.0% (0) |
| Wood products | 0.8% (3) | 0.5% (1) | 1.2% (2) |
| Furniture and home furnishings, and household appliance stores | 0.8% (3) | 0.5% (1) | 1.2% (2) |
| Utilities | 0.8% (3) | 1.5% (3) | 0.0% (0) |
| Professional and commercial equipment and supplies merchant wholesalers | 0.6% (2) | 1.0% (2) | 0.0% (0) |
| Music stores | 0.6% (2) | 0.0% (0) | 1.2% (2) |
| Electrical and electronic goods merchant wholesalers | 0.6% (2) | 1.0% (2) | 0.0% (0) |
| Paper | 0.6% (2) | 1.0% (2) | 0.0% (0) |
| Printing and related support activities | 0.6% (2) | 1.0% (2) | 0.0% (0) |
| Computer and electronic products | 0.6% (2) | 0.0% (0) | 1.2% (2) |
| Drugs, sundries, and chemical and allied products merchant wholesalers | 0.6% (2) | 1.0% (2) | 0.0% (0) |
| Lumber and other construction materials merchant wholesalers | 0.6% (2) | 1.0% (2) | 0.0% (0) |
| Other direct selling establishments | 0.6% (2) | 0.0% (0) | 1.2% (2) |
| Motor vehicle and parts dealers | 0.6% (2) | 1.0% (2) | 0.0% (0) |
| Professional, scientific, and technical services | 0.6% (2) | 0.0% (0) | 1.2% (2) |
| Motor vehicles, parts and supplies merchant wholesalers | 0.6% (2) | 1.0% (2) | 0.0% (0) |
| Groceries and related products merchant wholesalers | 0.6% (2) | 0.0% (0) | 1.2% (2) |
| Health and personal care, except drug, stores | 0.3% (1) | 0.0% (0) | 0.6% (1) |
| Gasoline stations | 0.3% (1) | 0.5% (1) | 0.0% (0) |
| Private households | 0.3% (1) | 0.0% (0) | 0.6% (1) |
Unemployment in St. Joseph
- Unemployment by race in 2022
- Unemployment rate for White non-Hispanic residents
- 4.2%Males
- Unemployment by race in 2000
- Unemployment rate for White non-Hispanic residents
- 5.4%Males
- 9.8%Females
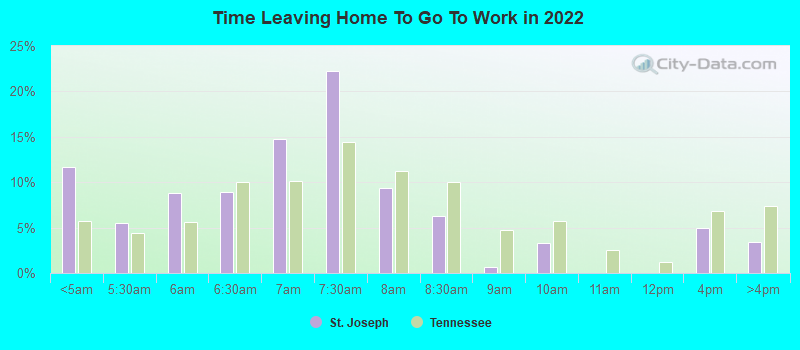
Time leaving home to go to work
12:00 a.m. to 4:59 a.m.:
| St. Joseph: | 11.7% (37) |
| Tennessee: | 5.8% (168,022) |
5:00 a.m. to 5:29 a.m.:
| St. Joseph: | 5.5% (17) |
| Tennessee: | 4.5% (129,739) |
5:30 a.m. to 5:59 a.m.:
| St. Joseph: | 8.8% (27) |
| Tennessee: | 5.6% (162,304) |
6:00 a.m. to 6:29 a.m.:
| St. Joseph: | 9.0% (28) |
| Tennessee: | 10.0% (290,467) |
6:30 a.m. to 6:59 a.m.:
| St. Joseph: | 14.7% (46) |
| Tennessee: | 10.1% (295,472) |
7:00 a.m. to 7:29 a.m.:
| St. Joseph: | 22.2% (70) |
| Tennessee: | 14.4% (419,614) |
7:30 a.m. to 7:59 a.m.:
| St. Joseph: | 9.3% (29) |
| Tennessee: | 11.3% (327,876) |
8:00 a.m. to 8:29 a.m.:
| St. Joseph: | 6.3% (20) |
| Tennessee: | 10.1% (293,227) |
8:30 a.m. to 8:59 a.m.:
| St. Joseph: | 0.7% (2) |
| Tennessee: | 4.8% (138,580) |
9:00 a.m. to 9:59 a.m.:
| St. Joseph: | 3.3% (10) |
| Tennessee: | 5.7% (165,600) |
12:00 p.m. to 3:59 p.m.:
| St. Joseph: | 5.0% (16) |
| Tennessee: | 6.8% (197,821) |
4:00 p.m. to 11:59 p.m.:
| St. Joseph: | 3.4% (11) |
| Tennessee: | 7.4% (215,456) |

<5am:
| St. Joseph: | 4.0% (14) |
| Tennessee: | 3.6% (95,201) |
5:30am:
| St. Joseph: | 4.9% (17) |
| Tennessee: | 3.2% (85,054) |
6am:
| St. Joseph: | 6.9% (24) |
| Tennessee: | 5.0% (130,170) |
6:30am:
| St. Joseph: | 13.2% (46) |
| Tennessee: | 9.9% (258,202) |
7am:
| St. Joseph: | 17.8% (62) |
| Tennessee: | 12.1% (315,993) |
7:30am:
| St. Joseph: | 16.6% (58) |
| Tennessee: | 15.3% (400,482) |
8am:
| St. Joseph: | 7.7% (27) |
| Tennessee: | 14.7% (385,430) |
8:30am:
| St. Joseph: | 5.2% (18) |
| Tennessee: | 8.3% (217,000) |
9am:
| St. Joseph: | 0.6% (2) |
| Tennessee: | 3.6% (95,491) |
10am:
| St. Joseph: | 2.3% (8) |
| Tennessee: | 4.2% (109,641) |
11am:
| St. Joseph: | 0.6% (2) |
| Tennessee: | 1.7% (45,353) |
4pm:
| St. Joseph: | 13.2% (46) |
| Tennessee: | 7.3% (192,279) |
>4pm:
| St. Joseph: | 3.2% (11) |
| Tennessee: | 7.6% (198,970) |

12:00 a.m. to 4:59 a.m. - Males:
| St. Joseph: | 13.1% (22) |
| Tennessee: | 6.9% (108,520) |
5:00 a.m. to 5:29 a.m. - Males:
| St. Joseph: | 7.5% (12) |
| Tennessee: | 5.6% (87,671) |
5:30 a.m. to 5:59 a.m. - Males:
| St. Joseph: | 10.4% (17) |
| Tennessee: | 6.4% (100,890) |
6:00 a.m. to 6:29 a.m. - Males:
| St. Joseph: | 9.2% (15) |
| Tennessee: | 11.4% (179,873) |
6:30 a.m. to 6:59 a.m. - Males:
| St. Joseph: | 22.4% (37) |
| Tennessee: | 10.3% (161,655) |
7:00 a.m. to 7:29 a.m. - Males:
| St. Joseph: | 12.7% (21) |
| Tennessee: | 13.0% (204,436) |
7:30 a.m. to 7:59 a.m. - Males:
| St. Joseph: | 8.0% (13) |
| Tennessee: | 9.8% (153,357) |
8:00 a.m. to 8:29 a.m. - Males:
| St. Joseph: | 9.7% (16) |
| Tennessee: | 8.9% (140,283) |
12:00 p.m. to 3:59 p.m. - Males:
| St. Joseph: | 6.4% (11) |
| Tennessee: | 7.0% (109,280) |

12:00 a.m. to 4:59 a.m. - Females:
| St. Joseph: | 10.1% (15) |
| Tennessee: | 4.4% (59,502) |
5:00 a.m. to 5:29 a.m. - Females:
| St. Joseph: | 3.4% (5) |
| Tennessee: | 3.1% (42,068) |
5:30 a.m. to 5:59 a.m. - Females:
| St. Joseph: | 7.0% (10) |
| Tennessee: | 4.6% (61,414) |
6:00 a.m. to 6:29 a.m. - Females:
| St. Joseph: | 8.7% (13) |
| Tennessee: | 8.2% (110,594) |
6:30 a.m. to 6:59 a.m. - Females:
| St. Joseph: | 6.6% (10) |
| Tennessee: | 10.0% (133,817) |
7:00 a.m. to 7:29 a.m. - Females:
| St. Joseph: | 32.5% (48) |
| Tennessee: | 16.0% (215,178) |
7:30 a.m. to 7:59 a.m. - Females:
| St. Joseph: | 10.7% (16) |
| Tennessee: | 13.0% (174,519) |
8:00 a.m. to 8:29 a.m. - Females:
| St. Joseph: | 2.2% (3) |
| Tennessee: | 11.4% (152,944) |
8:30 a.m. to 8:59 a.m. - Females:
| St. Joseph: | 1.4% (2) |
| Tennessee: | 5.5% (73,547) |
9:00 a.m. to 9:59 a.m. - Females:
| St. Joseph: | 6.6% (10) |
| Tennessee: | 6.2% (82,730) |
12:00 p.m. to 3:59 p.m. - Females:
| St. Joseph: | 3.3% (5) |
| Tennessee: | 6.6% (88,541) |
4:00 p.m. to 11:59 p.m. - Females:
| St. Joseph: | 7.0% (10) |
| Tennessee: | 6.7% (90,392) |
Travel time to work
Percentage of workers working in this county: 68.2%
Number of people working at home: 38 (10.6% of all workers)
Number of people working at home: 38 (10.6% of all workers)


Less than 5 minutes:
| St. Joseph: | 2.3% (8) |
| Tennessee: | 2.8% (73,643) |
5 to 9 minutes:
| St. Joseph: | 8.9% (31) |
| Tennessee: | 9.9% (258,796) |
10 to 14 minutes:
| St. Joseph: | 18.6% (65) |
| Tennessee: | 14.6% (382,474) |
15 to 19 minutes:
| St. Joseph: | 7.2% (25) |
| Tennessee: | 16.9% (441,464) |
20 to 24 minutes:
| St. Joseph: | 6.0% (21) |
| Tennessee: | 15.6% (409,099) |
25 to 29 minutes:
| St. Joseph: | 6.9% (24) |
| Tennessee: | 6.0% (158,281) |
30 to 34 minutes:
| St. Joseph: | 29.8% (104) |
| Tennessee: | 14.1% (370,428) |
35 to 39 minutes:
| St. Joseph: | 4.9% (17) |
| Tennessee: | 2.4% (63,838) |
40 to 44 minutes:
| St. Joseph: | 0.6% (2) |
| Tennessee: | 2.7% (70,195) |
45 to 59 minutes:
| St. Joseph: | 5.2% (18) |
| Tennessee: | 6.7% (174,982) |
60 to 89 minutes:
| St. Joseph: | 2.9% (10) |
| Tennessee: | 3.5% (92,042) |
90 or more minutes:
| St. Joseph: | 2.9% (10) |
| Tennessee: | 2.1% (55,664) |
Means of transportation to work

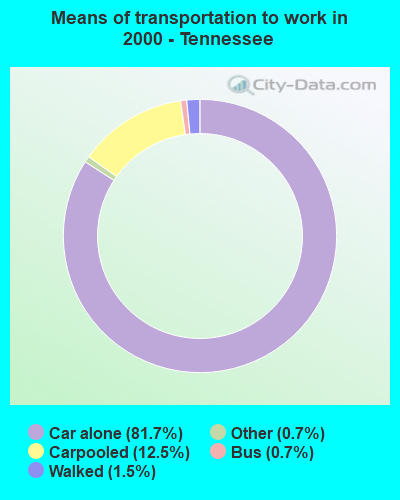
Drove car alone:
| St. Joseph: | 79.1% (276) |
| Tennessee: | 81.7% (2,140,377) |
Carpooled:
| St. Joseph: | 14.6% (51) |
| Tennessee: | 12.5% (328,321) |
Bus or trolley bus:
| St. Joseph: | 0.3% (1) |
| Tennessee: | 0.7% (18,847) |
Walked:
| St. Joseph: | 1.4% (5) |
| Tennessee: | 1.5% (39,689) |
Other means:
| St. Joseph: | 0.6% (2) |
| Tennessee: | 0.7% (17,308) |
Private vehicle occupancy

Drove alone:
| St. Joseph: | 90.0% (268) |
| Tennessee: | 89.7% (2,520,406) |
In 2 person carpool:
| St. Joseph: | 9.8% (29) |
| Tennessee: | 7.8% (220,446) |

Drove alone:
| St. Joseph: | 84.4% (276) |
| Tennessee: | 86.7% (2,140,377) |
In 2 person carpool:
| St. Joseph: | 12.8% (42) |
| Tennessee: | 10.4% (257,957) |
In 3 person carpool:
| St. Joseph: | 1.5% (5) |
| Tennessee: | 1.8% (44,143) |
In 4 person carpool:
| St. Joseph: | 1.2% (4) |
| Tennessee: | 0.6% (14,756) |
Class of workers
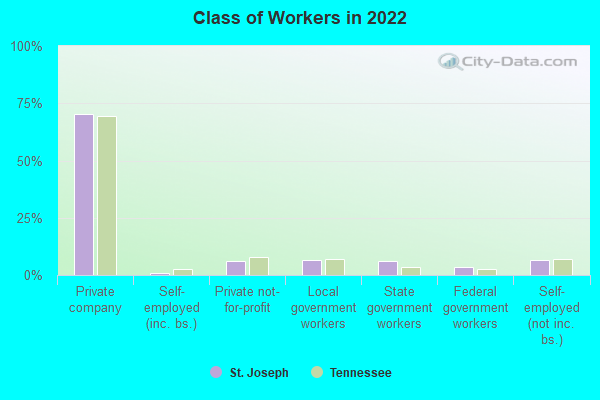
Employee of private company:
| St. Joseph: | 70.1% (258) |
| Tennessee: | 69.4% (2,369,609) |
Self-employed in own incorporated business:
| St. Joseph: | 0.9% (3) |
| Tennessee: | 2.7% (91,783) |
Private not-for-profit wage and salary workers:
| St. Joseph: | 6.3% (23) |
| Tennessee: | 7.7% (261,180) |
Local government workers:
| St. Joseph: | 6.6% (24) |
| Tennessee: | 6.9% (234,837) |
State government workers:
| St. Joseph: | 6.3% (23) |
| Tennessee: | 3.5% (118,092) |
Federal government workers:
| St. Joseph: | 3.4% (13) |
| Tennessee: | 2.7% (93,298) |
Self-employed workers in own not incorporated business:
| St. Joseph: | 6.6% (24) |
| Tennessee: | 7.0% (239,148) |

Employee of private company:
| St. Joseph: | 82.3% (298) |
| Tennessee: | 70.0% (1,855,123) |
Self-employed in own incorporated business:
| St. Joseph: | 2.5% (9) |
| Tennessee: | 2.3% (60,116) |
Private not-for-profit wage and salary workers:
| St. Joseph: | 0.6% (2) |
| Tennessee: | 6.2% (164,441) |
Local government workers:
| St. Joseph: | 3.6% (13) |
| Tennessee: | 7.1% (189,357) |
State government workers:
| St. Joseph: | 1.4% (5) |
| Tennessee: | 4.0% (107,075) |
Federal government workers:
| St. Joseph: | 1.7% (6) |
| Tennessee: | 2.7% (72,605) |
Self-employed workers in own not incorporated business:
| St. Joseph: | 8.0% (29) |
| Tennessee: | 7.3% (194,497) |

Employee of private company - Males:
| St. Joseph: | 79.5% (158) |
| Tennessee: | 72.1% (1,295,850) |
Self-employed in own incorporated business - Males:
| St. Joseph: | 1.6% (3) |
| Tennessee: | 3.6% (64,468) |
Local government workers - Males:
| St. Joseph: | 3.2% (6) |
| Tennessee: | 5.0% (90,602) |
State government workers - Males:
| St. Joseph: | 7.4% (15) |
| Tennessee: | 2.8% (50,575) |
Federal government workers - Males:
| St. Joseph: | 1.1% (2) |
| Tennessee: | 3.0% (54,450) |
Self-employed workers in own not incorporated business - Males:
| St. Joseph: | 7.4% (15) |
| Tennessee: | 8.3% (149,461) |

Employee of private company - Females:
| St. Joseph: | 59.0% (100) |
| Tennessee: | 66.4% (1,073,759) |
Private not-for-profit wage and salary workers - Females:
| St. Joseph: | 13.7% (23) |
| Tennessee: | 10.7% (172,814) |
Local government workers - Females:
| St. Joseph: | 10.6% (18) |
| Tennessee: | 8.9% (144,235) |
State government workers - Females:
| St. Joseph: | 5.0% (8) |
| Tennessee: | 4.2% (67,517) |
Federal government workers - Females:
| St. Joseph: | 6.2% (10) |
| Tennessee: | 2.4% (38,848) |
Self-employed workers in own not incorporated business - Females:
| St. Joseph: | 5.6% (9) |
| Tennessee: | 5.5% (89,687) |