Porterville, CA (California) Houses and Residents
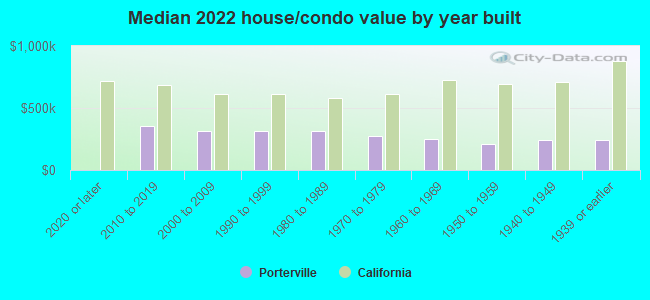
| Porterville: | $281,707 |
| California: | $715,900 |
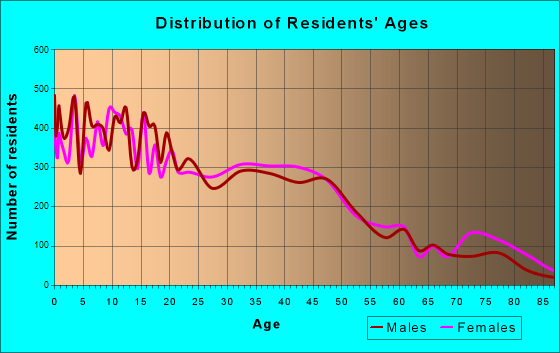
Total population: 55,466 (Urban population: 39,873, Rural population: 152 (all nonfarm))
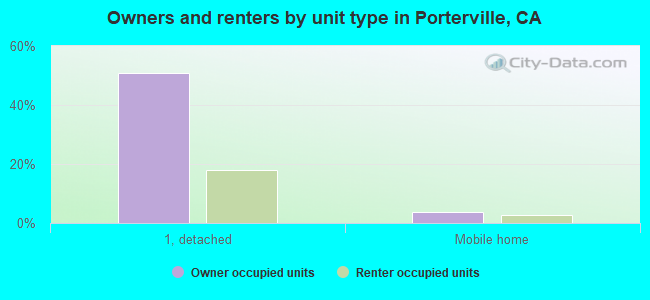
Houses: 20,331 (19,299 occupied: 10,600 owner occupied, 8,655 renter occupied)
| % of renters here: | 45% |
| State: | 44% |
Housing density: 1,452 houses/condos per square mile
Median price asked for vacant for-sale houses and condos in 2022: $233,934.
Median contract rent in 2022: $875 (lower quartile is $670, upper quartile is $1,104)
Median rent asked for vacant for-rent units in 2022: $1,594
Median gross rent in Porterville, CA in 2022: $1,142
Housing units in Porterville with a mortgage: 6,774 (384 second mortgage, 0 home equity loan, 251 both second mortgage and home equity loan)
Houses without a mortgage: 60
Median household income for houses/condos with a mortgage: $92,860
Median household income for apartments without a mortgage: $50,804
Median monthly housing costs: $1,142
Compare current foreclosures in Porterville, CA:
| Photo | Address | Area | Beds / Baths | Price | Details |
|---|---|---|---|---|---|

|
#1
N Capitola Ct Apt 2
Porterville, CA 93257
|
1,200 sq. feet
|
1 baths 2 beds |
show details | |

|
#2
W Julieann Ave
Porterville, CA 93257
|
2,820 sq. feet
|
3 baths 4 beds |
show details | |

|
#3
W Thurman Ave
Porterville, CA 93257
|
3,157 sq. feet
|
3 baths 3 beds |
show details | |

|
#4
Santa Maria Ave
Porterville, CA 93257
|
1,932 sq. feet
|
2 baths 4 beds |
show details | |

|
#5
W Thurman Ave
Porterville, CA 93257
|
2,195 sq. feet
|
2 baths 3 beds |
show details | |

|
#6
S Kessing St
Porterville, CA 93257
|
1,436 sq. feet
|
1 baths 4 beds |
show details | |

|
#7
Kings Cross Way
Porterville, CA 93257
|
1,135 sq. feet
|
2 baths 3 beds |
show details | |

|
#8
W White Chapel Ave
Porterville, CA 93257
|
2,204 sq. feet
|
2 baths 4 beds |
show details | |

|
#9
W Thurman Ave
Porterville, CA 93257
|
2,195 sq. feet
|
2 baths 3 beds |
show details | |

|
#10
Wellington St
Porterville, CA 93257
|
1,135 sq. feet
|
2 baths 3 beds |
show details |
| Photo | Address | Area | Beds / Baths | Price | Details |
|---|---|---|---|---|---|

|
#11
W Westfield Ave
Porterville, CA 93257
|
1,185 sq. feet
|
2 baths 3 beds |
show details | |

|
#12
N Jennifer Way
Porterville, CA 93257
|
1,338 sq. feet
|
2 baths 3 beds |
show details | |

|
#13
State St
Porterville, CA 93257
|
1,506 sq. feet
|
2 baths 3 beds |
show details | |

|
#14
W Castle Ave
Porterville, CA 93257
|
1,377 sq. feet
|
2 baths 3 beds |
show details | |

|
#15
N Cottage St
Porterville, CA 93257
|
1,573 sq. feet
|
2 baths 3 beds |
show details | |

|
#16
N Ruth St
Porterville, CA 93257
|
1,731 sq. feet
|
2 baths 3 beds |
show details | |

|
#17
N Prospect St
Porterville, CA 93257
|
905 sq. feet
|
1 baths 4 beds |
show details | |

|
#18
W Northgrand Ave
Porterville, CA 93257
|
1,879 sq. feet
|
1 baths 3 beds |
show details | |

|
#19
Tomah Ave
Porterville, CA 93257
|
1,455 sq. feet
|
2 baths 4 beds |
show details | |

|
#20
S Parkwest St
Porterville, CA 93257
|
1,760 sq. feet
|
2 baths 4 beds |
show details |
| Photo | Address | Area | Beds / Baths | Price | Details |
|---|---|---|---|---|---|

|
#21
N Mathew St
Porterville, CA 93257
|
1,606 sq. feet
|
2 baths 4 beds |
show details | |

|
#22
Carmelita St
Porterville, CA 93257
|
1,815 sq. feet
|
2 baths 4 beds |
show details | |

|
#23
Pioneer Ave
Porterville, CA 93257
|
1,750 sq. feet
|
2 baths 3 beds |
show details | |

|
#24
Richard Ave
Porterville, CA 93257
|
1,352 sq. feet
|
2 baths 3 beds |
show details | |

|
#25
N Beverly St
Porterville, CA 93257
|
1,382 sq. feet
|
2 baths - beds |
show details | |

|
#26
E Poplar Ave # B
Porterville, CA 93257
|
1,368 sq. feet
|
1 baths - beds |
show details | |

|
#27
N Capitola Ct
Porterville, CA 93257
|
- sq. feet
|
2 baths 2 beds |
show details | |

|
#28
E Date Ave
Porterville, CA 93257
|
1,686 sq. feet
|
1 baths - beds |
show details | |

|
#29
W Thurman Ave
Porterville, CA 93257
|
1,864 sq. feet
|
1 baths - beds |
show details | |

|
#30
W Kanai Ave
Porterville, CA 93257
|
1,241 sq. feet
|
2 baths - beds |
show details |
| Photo | Address | Area | Beds / Baths | Price | Details |
|---|---|---|---|---|---|

|
#31
W Median Ct
Porterville, CA 93257
|
- sq. feet
|
- baths - beds |
show details | |

|
#32
Mccomb Ave
Porterville, CA 93257
|
1,274 sq. feet
|
- baths - beds |
show details | |

|
#33
N York St
Porterville, CA 93257
|
- sq. feet
|
- baths - beds |
show details | |

|
#34
Cow Mountain Rd
Porterville, CA 93257
|
- sq. feet
|
- baths - beds |
show details | |

|
#35
W Roby Ave
Porterville, CA 93257
|
- sq. feet
|
- baths - beds |
show details | |

|
#36
Tomah Ave Apt 2
Porterville, CA 93257
|
- sq. feet
|
- baths - beds |
show details | |

|
#37
S B St Apt E
Porterville, CA 93257
|
- sq. feet
|
- baths - beds |
show details | |

|
#38
Avenue 150
Porterville, CA 93257
|
1,130 sq. feet
|
- baths - beds |
show details | |

|
#39
Iris Ave
Porterville, CA 93257
|
1,013 sq. feet
|
- baths - beds |
show details | |

|
#40
E Mountain View Ave
Porterville, CA 93257
|
- sq. feet
|
- baths - beds |
show details |
| Photo | Address | Area | Beds / Baths | Price | Details |
|---|---|---|---|---|---|

|
#41
E Success Dr
Porterville, CA 93257
|
1,056 sq. feet
|
- baths - beds |
show details | |

|
#42
Bel Aire Cir # 361-7739
Porterville, CA 93257
|
- sq. feet
|
2 baths - beds |
show details | |

|
#43
Gerry Ln
Porterville, CA 93257
|
- sq. feet
|
- baths - beds |
show details | |

|
#44
W Mulberry Ave
Porterville, CA 93257
|
2,110 sq. feet
|
- baths - beds |
show details | |

|
#45
S Fir St
Porterville, CA 93257
|
- sq. feet
|
- baths - beds |
show details | |

|
#46
Avenue 146
Porterville, CA 93257
|
- sq. feet
|
- baths - beds |
show details | |

|
#47
Avenue 184
Porterville, CA 93257
|
- sq. feet
|
- baths - beds |
show details | |

|
Check over 1 million property listings on Foreclosure.com!
|
browse all offers | |||

Latest news about housing in Porterville, CA collected exclusively by city-data.com from local newspapers, TV, and radio stations


Median year apartment built: 1982
Household type by relationship:
Households: 63,031- Male householders: 9,408 (1,578 living alone), Female householders: 9,680 (2,067 living alone)
9,219 spouses (9,200 opposite-sex spouses), 2,128 unmarried partners, (2,103 opposite-sex unmarried partners), 23,744 children (22,321 natural, 236 adopted, 1,187 stepchildren), 2,319 grandchildren, 1,411 brothers or sisters, 1,313 parents, 9 foster children, 1,650 other relatives, 682 non-relatives
- In group quarters: 1,464
Size of family households: 4,094 2-persons, 3,465 3-persons, 2,466 4-persons, 2,882 5-persons, 732 6-persons, 796 7-or-more-persons.
Size of nonfamily households: 3,854 1-person, 858 2-persons, 30 3-persons, 42 5-persons.
9,695 married couples with children.
6,289 single-parent households (1,753 men, 4,536 women).
47.6% of residents of Porterville speak English at home.
48.0% of residents speak Spanish at home (52% speak English very well, 18% speak English well, 16% speak English not well, 14% don't speak English at all).
0.6% of residents speak other Indo-European language at home (67% speak English very well, 25% speak English well, 4% speak English not well, 4% don't speak English at all).
2.3% of residents speak Asian or Pacific Island language at home (58% speak English very well, 30% speak English well, 11% speak English not well, 1% don't speak English at all).
0.8% of residents speak other language at home (29% speak English very well, 5% speak English well, 2% speak English not well, 64% don't speak English at all).
Foreign born population: 17,457 (27.7%)
(45.6% of them are naturalized citizens)
| Here: | 5.5 |
| State: | 6.0 |
| Here: | 4.5 |
| State: | 3.9 |
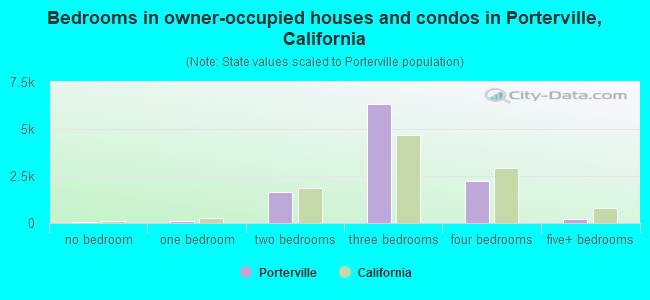
- Bedrooms in owner-occupied houses and condos in Porterville, California
- 70no bedroom
- 1191 bedroom
- 1,6412 bedrooms
- 6,3373 bedrooms
- 2,2294 bedrooms
- 2035+ bedrooms
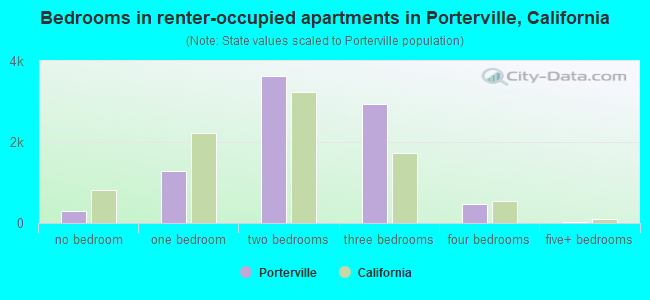
- Bedrooms in renter-occupied apartments in Porterville, California
- 288no bedroom
- 1,2791 bedroom
- 3,6392 bedrooms
- 2,9493 bedrooms
- 4654 bedrooms
- 375+ bedrooms
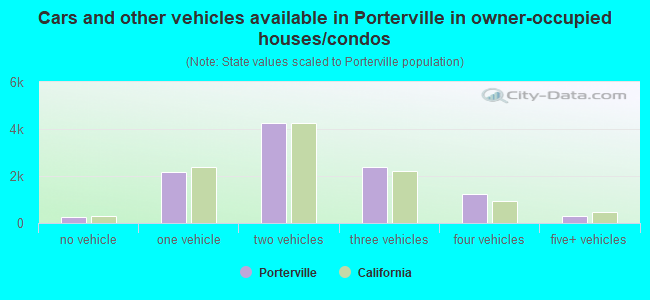
- Cars and other vehicles available in Porterville in owner-occupied houses/condos
- 260no vehicle
- 2,1561 vehicle
- 4,2732 vehicles
- 2,3663 vehicles
- 1,2314 vehicles
- 3135+ vehicles
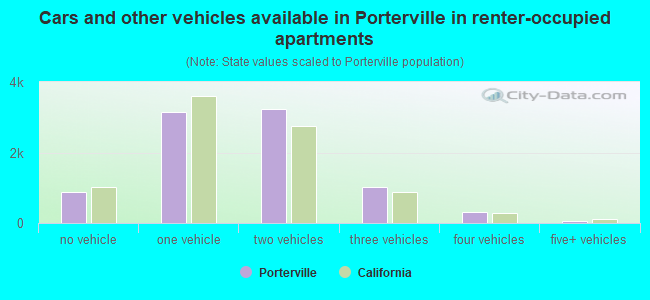
- Cars and other vehicles available in Porterville in renter-occupied apartments
- 880no vehicle
- 3,1401 vehicle
- 3,2402 vehicles
- 1,0283 vehicles
- 2994 vehicles
- 695+ vehicles
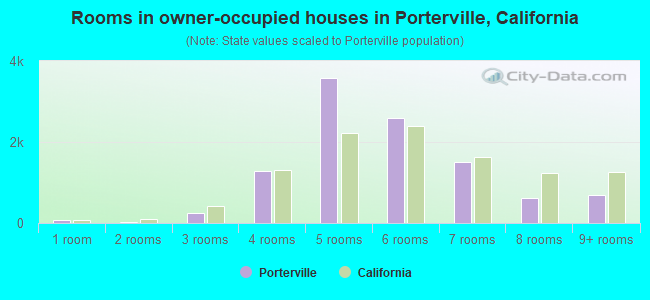
- Rooms in owner-occupied houses in Porterville, California
- 701 room
- 222 rooms
- 2503 rooms
- 1,2724 rooms
- 3,5775 rooms
- 2,6016 rooms
- 1,5127 rooms
- 6078 rooms
- 6889+ rooms
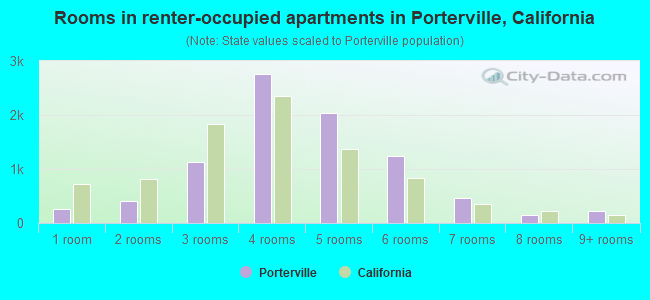
- Rooms in renter-occupied apartments in Porterville, California
- 2581 room
- 4092 rooms
- 1,1213 rooms
- 2,7564 rooms
- 2,0465 rooms
- 1,2366 rooms
- 4547 rooms
- 1508 rooms
- 2259+ rooms
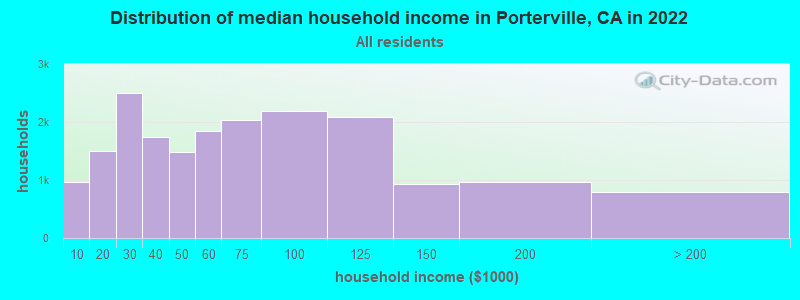
Porterville, CA household income distribution

- 974Less than $10,000
- 1,498$10,000 to $19,999
- 2,506$20,000 to $29,999
- 1,733$30,000 to $39,999
- 1,489$40,000 to $49,999
- 1,839$50,000 to $59,999
- 2,035$60,000 to $74,999
- 2,197$75,000 to $99,999
- 2,090$100,000 to $124,999
- 933$125,000 to $149,999
- 971$150,000 to $199,999
- 796$200,000 or more
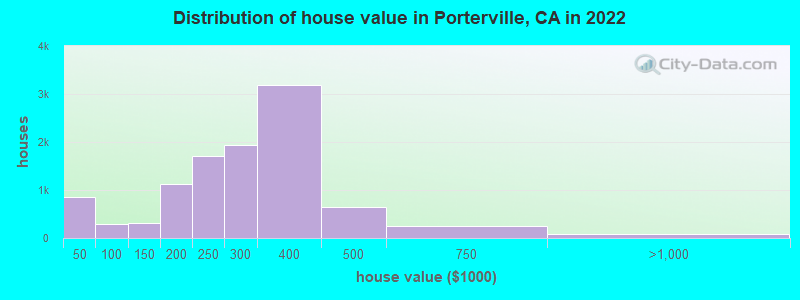
Home value of owner - occupied houses in 2022 in Porterville, CA
-
- 176Less than $10,000
- 183$10,000 to $14,999
- 162$15,000 to $19,999
- 136$20,000 to $24,999
- 22$25,000 to $29,999
- 60$30,000 to $34,999
- 116$35,000 to $39,999
- 61$50,000 to $59,999
- 13$60,000 to $69,999
- 25$70,000 to $79,999
- 69$80,000 to $89,999
- 112$90,000 to $99,999
- 155$100,000 to $124,999
- 162$125,000 to $149,999
- 683$150,000 to $174,999
- 431$175,000 to $199,999
- 1,704$200,000 to $249,999
- 1,928$250,000 to $299,999
- 3,190$300,000 to $399,999
- 647$400,000 to $499,999
- 249$500,000 to $749,999
- 57$750,000 to $999,999
- 30$2,000,000 or more
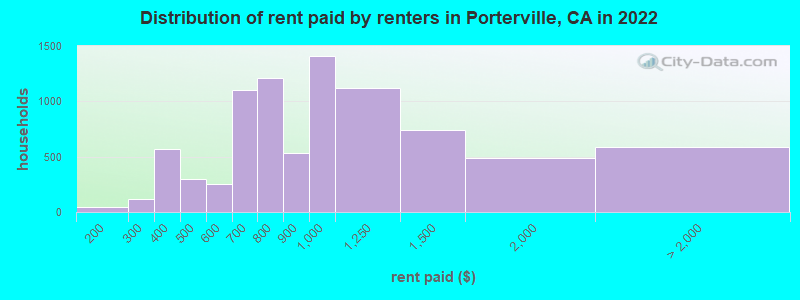
Rent paid by renters in 2022 in Porterville, CA
-
- 23$100 to $149
- 19$150 to $199
- 107$200 to $249
- 12$250 to $299
- 161$300 to $349
- 408$350 to $399
- 67$400 to $449
- 230$450 to $499
- 49$500 to $549
- 199$550 to $599
- 591$600 to $649
- 511$650 to $699
- 535$700 to $749
- 674$750 to $799
- 535$800 to $899
- 1,411$900 to $999
- 1,118$1,000 to $1,249
- 743$1,250 to $1,499
- 484$1,500 to $1,999
- 44$2,000 to $2,499
- 63$2,500 to $2,999
- 33$3,000 to $3,499
- 102$3,500 or more
- 340No cash rent
Percentage of workers working in this county: 89.6%
Number of people working at home: 637 (2.5% of all workers)
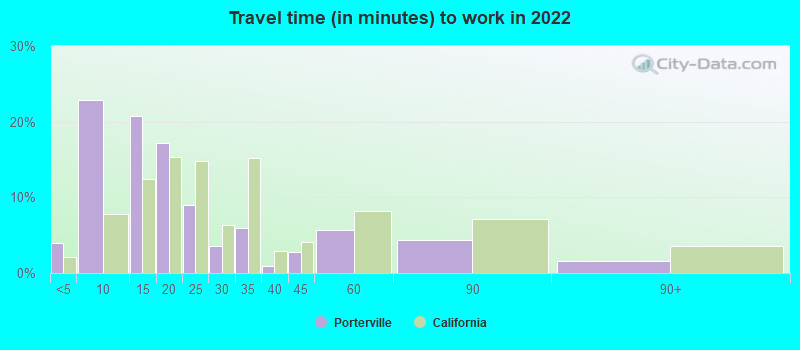
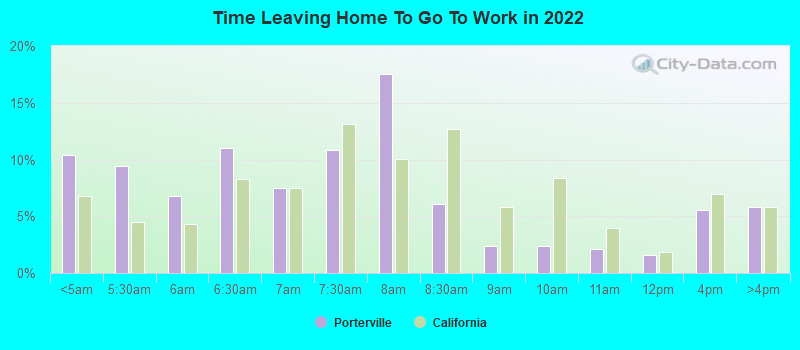
Travel time to work (commute)
- Less than 5 minutes: 686
- 5 to 9 minutes: 5,194
- 10 to 14 minutes: 3,746
- 15 to 19 minutes: 4,694
- 20 to 24 minutes: 1,627
- 25 to 29 minutes: 599
- 30 to 34 minutes: 1,737
- 35 to 39 minutes: 649
- 40 to 44 minutes: 566
- 45 to 59 minutes: 2,671
- 60 to 89 minutes: 1,718
- 90 or more minutes: 883
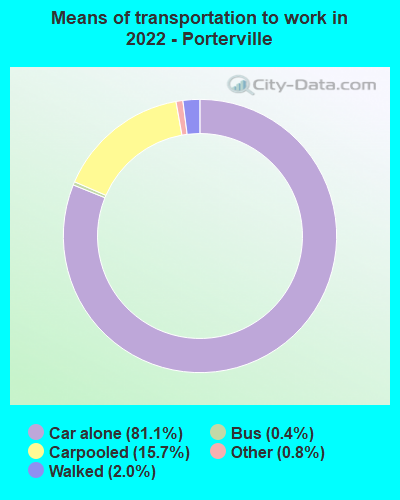
Means of transportation to work:
- Drove a car alone: 17,049 (76.3%)
- Carpooled: 4,114 (18.4%)
- Bus: 35 (0.2%)
- Taxi: 126 (0.6%)
- Bicycle: 14 (0.1%)
- Walked: 391 (1.8%)
- Worked at home: 637 (2.9%)
- Unemployment by race in 2022
- Unemployment rate for White non-Hispanic residents
- 8.9%Males
- 2.9%Females
- Unemployment rate for Black residents
- 42.8%Males
- 73.7%Females
- Unemployment rate for American Indian and Alaska Native residents
- 5.5%Males
- 11.6%Females
- Unemployment rate for Asian residents
- 6.4%Males
- 26.7%Females
- Unemployment rate for other race residents
- 8.1%Males
- 6.7%Females
- Unemployment rate for two or more race residents
- 2.5%Males
- 7.1%Females
- Unemployment rate for Hispanic or Latino residents
- 6.3%Males
- 8.8%Females
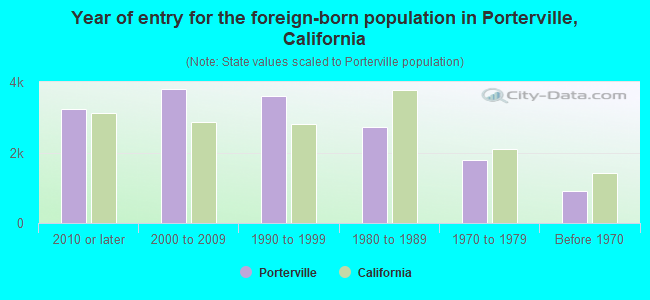
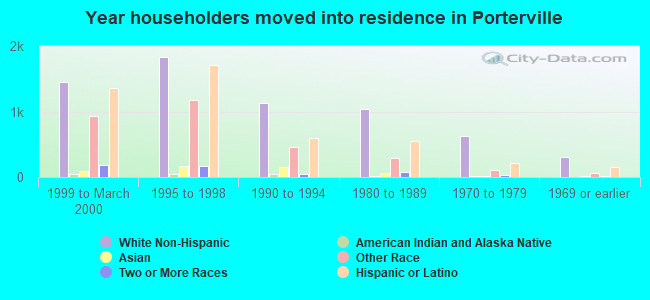
- Year of entry for the foreign-born population in Porterville, California
- 3,2222010 or later
- 3,8082000 to 2009
- 3,6141990 to 1999
- 2,7161980 to 1989
- 1,7911970 to 1979
- 907Before 1970
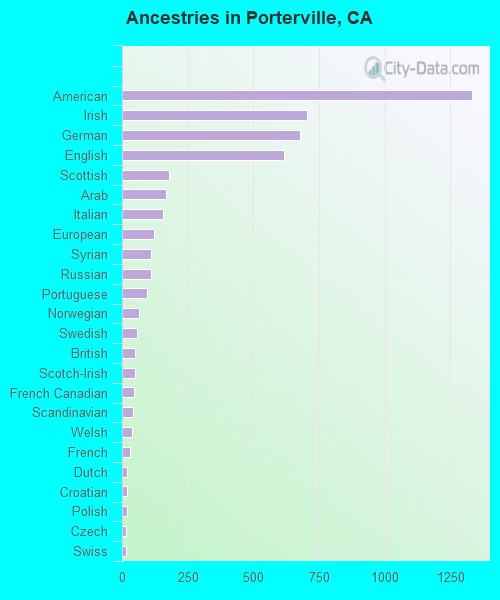
First ancestries reported:
- American: 1,330 (3.1%)
- Irish: 703 (1.6%)
- German: 679 (1.6%)
- English: 617 (1.4%)
- Scottish: 178 (0.4%)
- Arab: 168 (0.4%)
- Italian: 157 (0.4%)
- European: 120 (0.3%)
- Syrian: 112 (0.3%)
- Russian: 109 (0.3%)
- Portuguese: 95 (0.2%)
- Norwegian: 63 (0.1%)
- Swedish: 57 (0.1%)
- British: 50 (0.1%)
- Scotch-Irish: 50 (0.1%)
- French Canadian: 45 (0.1%)
- Scandinavian: 41 (0.09%)
- Welsh: 37 (0.08%)
- French: 32 (0.07%)
- Dutch: 19 (0.04%)
- Croatian: 18 (0.04%)
- Polish: 18 (0.04%)
- Czech: 16 (0.04%)
- Swiss: 16 (0.04%)
- Armenian: 10 (0.02%)
- Northern European: 10 (0.02%)
- Danish: 9 (0.02%)
- Czechoslovakian: 7 (0.02%)
- Nigerian: 7 (0.02%)
Most common places of birth for foreign-born residents (%):
| Porterville: | 83.8% (13,895) |
| California: | 37.2% (3,881,193) |
| Porterville: | 5.3% (871) |
| California: | 7.8% (818,297) |
Place of birth for U.S.-born residents:
- This state: 41,482
- Other state: 3,650
- Northeast: 340
- Midwest: 951
- South: 1,352
- West: 988
90.1% of Porterville residents lived in the same house 1 years ago.
Out of people who lived in different houses, 46.2% lived in this county.
Out of people who lived in different counties, 86.9% lived in California.
| Porterville: | 90.1% |
| State average: | 88.9% |
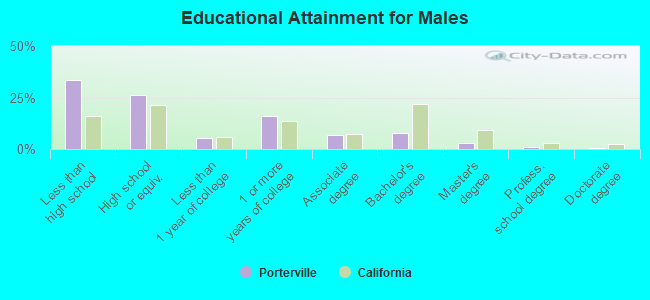
Education attainment for males 25 years and older:
- No schooling: 1,099
- Nursery to 4th grade: 618
- 5th and 6th grade: 1,298
- 7th and 8th grade: 835
- 9th grade: 474
- 10th grade: 226
- 11th grade: 664
- 12th grade, no diploma: 985
- High school graduate (or equivalency): 4,847
- Less than 1 year of college: 993
- Some college more than 1 year, no degree: 2,960
- Associate degree: 1,275
- Bachelor's degree: 1,452
- Master's degree: 511
- Professional school degree: 170
- Doctorate degree: 69
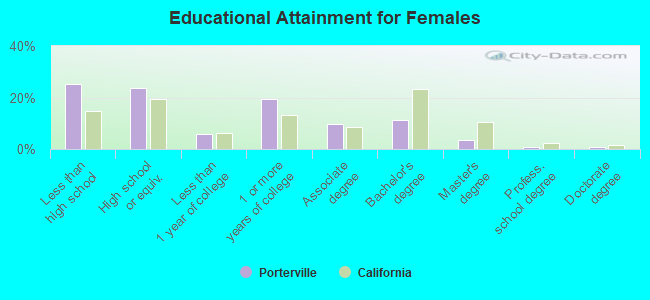
Education attainment for females 25 years and older:
- No schooling: 830
- Nursery to 4th grade: 503
- 5th and 6th grade: 857
- 7th and 8th grade: 723
- 9th grade: 507
- 10th grade: 203
- 11th grade: 325
- 12th grade, no diploma: 756
- High school graduate (or equivalency): 4,440
- Less than 1 year of college: 1,068
- Some college more than 1 year, no degree: 3,639
- Associate degree: 1,843
- Bachelor's degree: 2,131
- Master's degree: 660
- Professional school degree: 168
- Doctorate degree: 116
Housing units in structures:
- One, detached: 13,836
- One, attached: 406
- Two: 928
- 3 or 4: 1,075
- 5 to 9: 789
- 10 to 19: 273
- 20 to 49: 538
- 50 or more: 1,064
- Mobile homes: 1,401
- Boats, RVs, vans, etc.: 17
Median worth of mobile homes: $54,442
Housing units lacking complete kitchen facilities in 2022: 2.4%
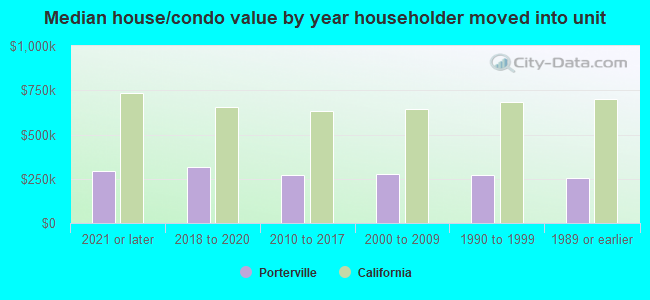
House/condo owner moved in on average 14 years ago
Renter moved in on average 3 years ago
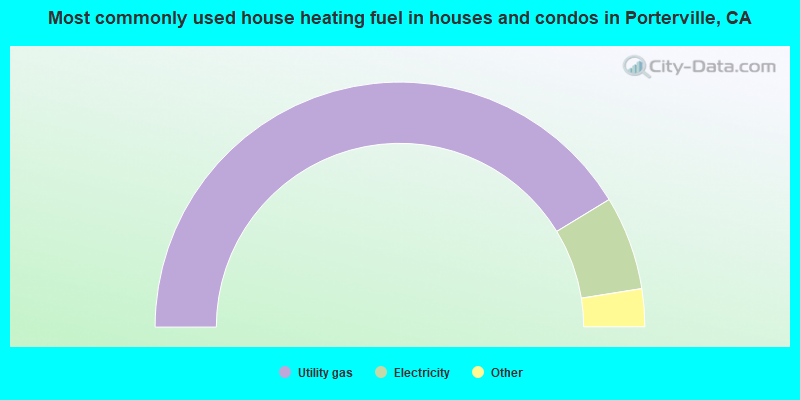
- 82.6%Utility gas
- 12.4%Electricity
- 1.7%Bottled, tank, or LP gas
- 1.0%Wood
- 1.0%Solar energy
- 0.7%No fuel used
- 0.6%Other fuel
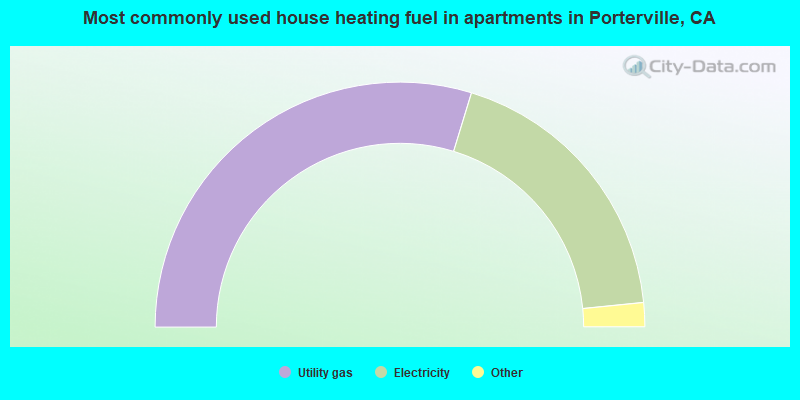
- 59.5%Utility gas
- 37.4%Electricity
- 1.2%No fuel used
- 0.9%Bottled, tank, or LP gas
- 0.4%Solar energy
- 0.3%Wood
- 0.3%Other fuel
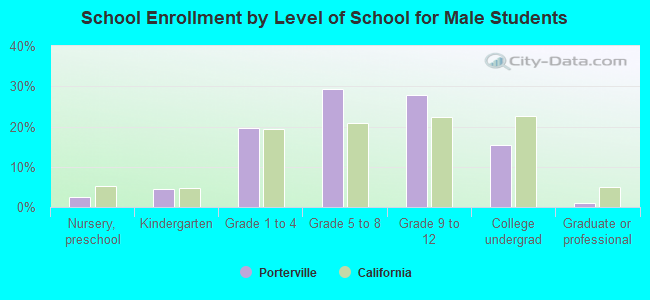
Private vs. public school enrollment:
| Here: | 2.1% |
| California: | 10.5% |
| Here: | 0.8% |
| California: | 8.5% |
| Here: | 19.9% |
| California: | 15.9% |