Work and Jobs in Porterville, California (CA) Detailed Stats
Occupations, Industries, Unemployment, Workers, Commute
Settings
X


Recent posts about work in Porterville, California on our local forum with over 2,400,000 registered users:

Latest news about work in Porterville, CA collected exclusively by city-data.com from local newspapers, TV, and radio stations
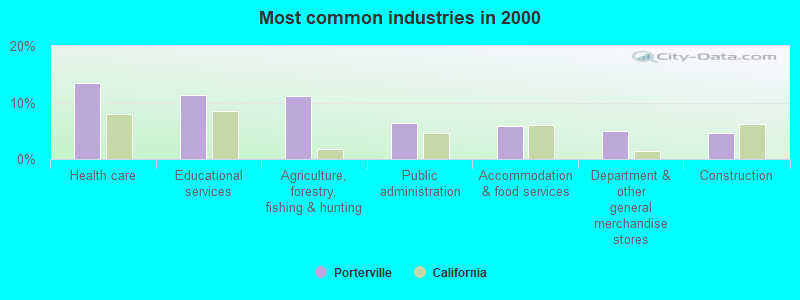
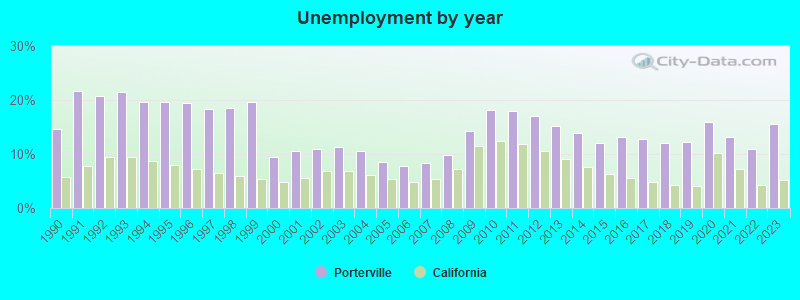
The unemployment rate in 2023 in Porterville, CA was 15.6%, which was 67.3% greater than the unemployment rate of 5.1% across the entire state of California. Compared to the unemployment rate of 15.1% in 2013, this represents an increase of 3.2%. The most common industries in Porterville are: Health care (13.4% of civilian employees), Educational services (11.3% of civilian employees), Agriculture, forestry, fishing & hunting (11.2% of civilian employees). 89.9% of workers work in Tulare County and 2.4% of all workers work at home. 59.5% of workers are employees of private companies, which is 11.7% less than the rate of 66.5% across the entire state of California.
Whole page based on the data from 2000 / 2022 when the population of Porterville, California was 39,615 / 63,032
Whole page based on the data from 2000 / 2022 when the population of Porterville, California was 39,615 / 63,032
Most common industries
Most common industries | |||
|---|---|---|---|
Industry | All | Males | Females |
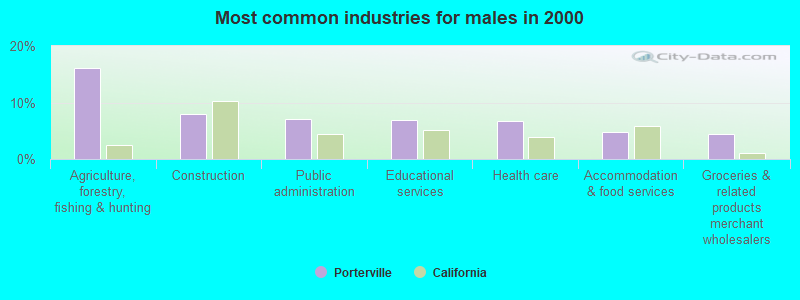
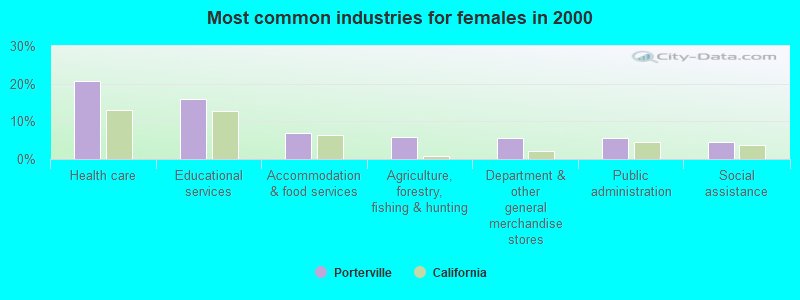
| Health care | 13.4% (1,898) | 6.7% (491) | 20.7% (1,407) |
| Educational services | 11.3% (1,596) | 7.0% (513) | 16.0% (1,083) |
| Agriculture, forestry, fishing and hunting | 11.2% (1,585) | 16.1% (1,183) | 5.9% (402) |
| Public administration | 6.4% (900) | 7.1% (521) | 5.6% (379) |
| Accommodation and food services | 5.8% (823) | 4.7% (347) | 7.0% (476) |
| Department and other general merchandise stores | 4.9% (696) | 4.3% (313) | 5.6% (383) |
| Construction | 4.6% (649) | 7.9% (583) | 1.0% (66) |
| Groceries and related products merchant wholesalers | 3.9% (555) | 4.4% (326) | 3.4% (229) |
| Social assistance | 3.5% (490) | 2.4% (175) | 4.6% (315) |
| Administrative and support and waste management services | 3.3% (465) | 2.9% (217) | 3.7% (248) |
| Food and beverage stores | 2.4% (343) | 2.6% (195) | 2.2% (148) |
| Finance and insurance | 2.4% (338) | 1.8% (136) | 3.0% (202) |
| Repair and maintenance | 2.1% (295) | 3.6% (268) | 0.4% (27) |
| Truck transportation | 1.7% (241) | 3.0% (220) | 0.3% (21) |
| Religious, grantmaking, civic, professional, and similar organizations | 1.4% (200) | 1.5% (112) | 1.3% (88) |
| Professional, scientific, and technical services | 1.4% (200) | 1.3% (95) | 1.5% (105) |
| Printing and related support activities | 1.3% (191) | 1.8% (133) | 0.9% (58) |
| Food | 1.3% (187) | 1.4% (103) | 1.2% (84) |
| Personal and laundry services | 1.0% (135) | 0.7% (51) | 1.2% (84) |
| Computer and electronic products | 0.9% (133) | 0.6% (43) | 1.3% (90) |
| Arts, entertainment, and recreation | 0.9% (131) | 1.0% (70) | 0.9% (61) |
| Real estate and rental and leasing | 0.9% (126) | 1.1% (82) | 0.6% (44) |
| Motor vehicle and parts dealers | 0.9% (123) | 1.2% (85) | 0.6% (38) |
| Building material and garden equipment and supplies dealers | 0.8% (107) | 1.0% (73) | 0.5% (34) |
| Machinery | 0.7% (105) | 0.6% (43) | 0.9% (62) |
| Miscellaneous manufacturing | 0.7% (105) | 0.5% (36) | 1.0% (69) |
| Private households | 0.7% (98) | 0.3% (20) | 1.1% (78) |
| Furniture and home furnishings, and household appliance stores | 0.7% (97) | 0.7% (52) | 0.7% (45) |
| Utilities | 0.7% (92) | 1.2% (92) | 0.0% (0) |
| Plastics and rubber products | 0.5% (72) | 0.7% (50) | 0.3% (22) |
| Publishing, and motion picture and sound recording industries | 0.5% (72) | 0.7% (54) | 0.3% (18) |
| Clothing and accessories, including shoe, stores | 0.5% (66) | 0.3% (19) | 0.7% (47) |
| Textile mills and textile products | 0.4% (59) | 0.3% (25) | 0.5% (34) |
| Radio, TV, and computer stores | 0.4% (58) | 0.6% (46) | 0.2% (12) |
| Pharmacies and drug stores | 0.4% (56) | 0.2% (13) | 0.6% (43) |
| Warehousing and storage | 0.4% (53) | 0.6% (46) | 0.1% (7) |
| Used merchandise, gift, novelty, and souvenir, and other miscellaneous stores | 0.4% (51) | 0.2% (18) | 0.5% (33) |
| Metal and metal products | 0.3% (48) | 0.7% (48) | 0.0% (0) |
| Wood products | 0.3% (46) | 0.5% (38) | 0.1% (8) |
| U. S. Postal service | 0.3% (43) | 0.2% (13) | 0.4% (30) |
| Other transportation, and support activities, and couriers | 0.3% (42) | 0.3% (19) | 0.3% (23) |
| Jewelry, luggage, and leather goods stores | 0.3% (37) | 0.3% (19) | 0.3% (18) |
| Electrical and electronic goods merchant wholesalers | 0.2% (35) | 0.1% (9) | 0.4% (26) |
| Retail florists | 0.2% (35) | 0.2% (17) | 0.3% (18) |
| Rail transportation | 0.2% (34) | 0.5% (34) | 0.0% (0) |
| Data processing, libraries, and other information services | 0.2% (34) | 0.2% (13) | 0.3% (21) |
| Office supplies and stationery stores | 0.2% (31) | 0.1% (10) | 0.3% (21) |
| Paper | 0.2% (31) | 0.3% (22) | 0.1% (9) |
| Broadcasting and telecommunications | 0.2% (27) | 0.2% (13) | 0.2% (14) |
| Chemicals | 0.2% (25) | 0.3% (19) | 0.1% (6) |
| Other direct selling establishments | 0.2% (24) | 0.2% (15) | 0.1% (9) |
| Petroleum and petroleum products merchant wholesalers | 0.2% (23) | 0.3% (23) | 0.0% (0) |
| Miscellaneous nondurable goods merchant wholesalers | 0.1% (21) | 0.2% (13) | 0.1% (8) |
| Nonmetallic mineral products | 0.1% (20) | 0.3% (20) | 0.0% (0) |
| Motor vehicles, parts and supplies merchant wholesalers | 0.1% (20) | 0.3% (20) | 0.0% (0) |
| Apparel, fabrics, and notions merchant wholesalers | 0.1% (19) | 0.1% (9) | 0.1% (10) |
| Farm supplies merchant wholesalers | 0.1% (18) | 0.2% (18) | 0.0% (0) |
| Apparel | 0.1% (18) | 0.2% (18) | 0.0% (0) |
| Furniture and related product manufacturing | 0.1% (17) | 0.2% (17) | 0.0% (0) |
| Machinery, equipment, and supplies merchant wholesalers | 0.1% (16) | 0.2% (16) | 0.0% (0) |
| Alcoholic beverages merchant wholesalers | 0.1% (11) | 0.1% (11) | 0.0% (0) |
| Transportation equipment | 0.1% (9) | 0.1% (9) | 0.0% (0) |
| Hardware, plumbing and heating equipment, and supplies merchant wholesalers | 0.1% (9) | 0.1% (9) | 0.0% (0) |
Unemployment in Porterville
- Unemployment by race in 2022
- Unemployment rate for White non-Hispanic residents
- 8.9%Males
- 2.9%Females
- Unemployment rate for Black residents
- 42.8%Males
- 73.7%Females
- Unemployment rate for American Indian and Alaska Native residents
- 5.5%Males
- 11.6%Females
- Unemployment rate for Asian residents
- 6.4%Males
- 26.7%Females
- Unemployment rate for other race residents
- 8.1%Males
- 6.7%Females
- Unemployment rate for two or more race residents
- 2.5%Males
- 7.1%Females
- Unemployment rate for Hispanic or Latino residents
- 6.3%Males
- 8.8%Females
- Unemployment by race in 2000
- Unemployment rate for White non-Hispanic residents
- 7.7%Males
- 7.5%Females
- Unemployment rate for Black residents
- 56.7%Males
- Unemployment rate for American Indian and Alaska Native residents
- 18.9%Males
- Unemployment rate for Asian residents
- 10.6%Males
- 11.2%Females
- Unemployment rate for other race residents
- 18.2%Males
- 15.3%Females
- Unemployment rate for two or more race residents
- 13.4%Males
- 13.0%Females
- Unemployment rate for Hispanic or Latino residents
- 18.6%Males
- 15.1%Females
Unemployment in 2023:
| Porterville: | 15.6% |
| California: | 5.1% |
Unemployment in 2022:
| Porterville: | 10.9% |
| California: | 4.2% |
Unemployment in 2021:
| Porterville: | 13.1% |
| California: | 7.3% |
Unemployment in 2020:
| Porterville: | 16.0% |
| California: | 10.1% |
Unemployment in 2019:
| Porterville: | 12.3% |
| California: | 4.1% |
Unemployment in 2018:
| Porterville: | 12.0% |
| California: | 4.2% |
Unemployment in 2017:
| Porterville: | 12.7% |
| California: | 4.8% |
Unemployment in 2016:
| Porterville: | 13.1% |
| California: | 5.5% |
Unemployment in 2015:
| Porterville: | 12.1% |
| California: | 6.3% |
Unemployment in 2014:
| Porterville: | 13.8% |
| California: | 7.6% |
Unemployment in 2013:
| Porterville: | 15.1% |
| California: | 9.0% |
Unemployment in 2012:
| Porterville: | 17.0% |
| California: | 10.5% |
Unemployment in 2011:
| Porterville: | 18.0% |
| California: | 11.9% |
Unemployment in 2010:
| Porterville: | 18.2% |
| California: | 12.5% |
Unemployment in 2009:
| Porterville: | 14.2% |
| California: | 11.5% |
Unemployment in 2008:
| Porterville: | 9.9% |
| California: | 7.3% |
Unemployment in 2007:
| Porterville: | 8.4% |
| California: | 5.3% |
Unemployment in 2006:
| Porterville: | 7.7% |
| California: | 4.9% |
Unemployment in 2005:
| Porterville: | 8.6% |
| California: | 5.4% |
Unemployment in 2004:
| Porterville: | 10.6% |
| California: | 6.2% |
Unemployment in 2003:
| Porterville: | 11.3% |
| California: | 6.9% |
Unemployment in 2002:
| Porterville: | 11.0% |
| California: | 6.8% |
Unemployment in 2001:
| Porterville: | 10.5% |
| California: | 5.5% |
Unemployment in 2000:
| Porterville: | 9.4% |
| California: | 4.9% |
Unemployment in 1999:
| Porterville: | 19.7% |
| California: | 5.3% |
Unemployment in 1998:
| Porterville: | 18.6% |
| California: | 5.9% |
Unemployment in 1997:
| Porterville: | 18.3% |
| California: | 6.4% |
Unemployment in 1996:
| Porterville: | 19.4% |
| California: | 7.3% |
Unemployment in 1995:
| Porterville: | 19.7% |
| California: | 7.9% |
Unemployment in 1994:
| Porterville: | 19.6% |
| California: | 8.7% |
Unemployment in 1993:
| Porterville: | 21.4% |
| California: | 9.5% |
Unemployment in 1992:
| Porterville: | 20.7% |
| California: | 9.4% |
Unemployment in 1991:
| Porterville: | 21.6% |
| California: | 7.8% |
Unemployment in 1990:
| Porterville: | 14.7% |
| California: | 5.8% |
Time leaving home to go to work
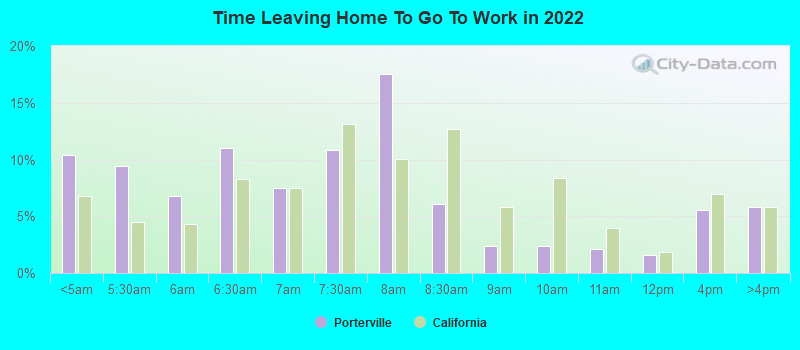
12:00 a.m. to 4:59 a.m.:
| Porterville: | 10.4% (2,588) |
| California: | 6.8% (1,050,902) |
5:00 a.m. to 5:29 a.m.:
| Porterville: | 9.4% (2,341) |
| California: | 4.5% (692,772) |
5:30 a.m. to 5:59 a.m.:
| Porterville: | 6.8% (1,692) |
| California: | 4.3% (665,475) |
6:00 a.m. to 6:29 a.m.:
| Porterville: | 11.0% (2,742) |
| California: | 8.3% (1,273,588) |
6:30 a.m. to 6:59 a.m.:
| Porterville: | 7.5% (1,858) |
| California: | 7.5% (1,156,338) |
7:00 a.m. to 7:29 a.m.:
| Porterville: | 10.9% (2,707) |
| California: | 13.2% (2,027,702) |
7:30 a.m. to 7:59 a.m.:
| Porterville: | 17.6% (4,368) |
| California: | 10.1% (1,550,402) |
8:00 a.m. to 8:29 a.m.:
| Porterville: | 6.1% (1,521) |
| California: | 12.7% (1,953,986) |
8:30 a.m. to 8:59 a.m.:
| Porterville: | 2.4% (594) |
| California: | 5.8% (890,950) |
9:00 a.m. to 9:59 a.m.:
| Porterville: | 2.4% (593) |
| California: | 8.4% (1,288,499) |
10:00 a.m. to 10:59 a.m.:
| Porterville: | 2.1% (533) |
| California: | 4.0% (613,193) |
11:00 a.m. to 11:59 a.m.:
| Porterville: | 1.6% (405) |
| California: | 1.8% (280,975) |
12:00 p.m. to 3:59 p.m.:
| Porterville: | 5.6% (1,384) |
| California: | 7.0% (1,075,505) |
4:00 p.m. to 11:59 p.m.:
| Porterville: | 5.8% (1,446) |
| California: | 5.8% (891,240) |
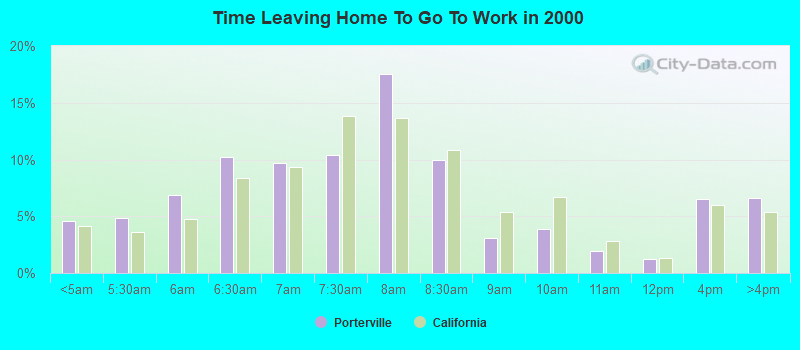
<5am:
| Porterville: | 4.6% (630) |
| California: | 4.2% (606,086) |
5:30am:
| Porterville: | 4.9% (668) |
| California: | 3.6% (523,209) |
6am:
| Porterville: | 6.9% (946) |
| California: | 4.8% (692,256) |
6:30am:
| Porterville: | 10.2% (1,404) |
| California: | 8.4% (1,216,867) |
7am:
| Porterville: | 9.7% (1,331) |
| California: | 9.4% (1,362,830) |
7:30am:
| Porterville: | 10.4% (1,426) |
| California: | 13.8% (2,006,950) |
8am:
| Porterville: | 17.5% (2,405) |
| California: | 13.7% (1,986,831) |
8:30am:
| Porterville: | 9.9% (1,364) |
| California: | 10.9% (1,577,815) |
9am:
| Porterville: | 3.1% (425) |
| California: | 5.4% (778,152) |
10am:
| Porterville: | 3.9% (532) |
| California: | 6.7% (972,355) |
11am:
| Porterville: | 1.9% (262) |
| California: | 2.9% (414,479) |
12pm:
| Porterville: | 1.3% (173) |
| California: | 1.3% (189,005) |
4pm:
| Porterville: | 6.5% (893) |
| California: | 6.0% (865,284) |
>4pm:
| Porterville: | 6.6% (903) |
| California: | 5.3% (776,167) |
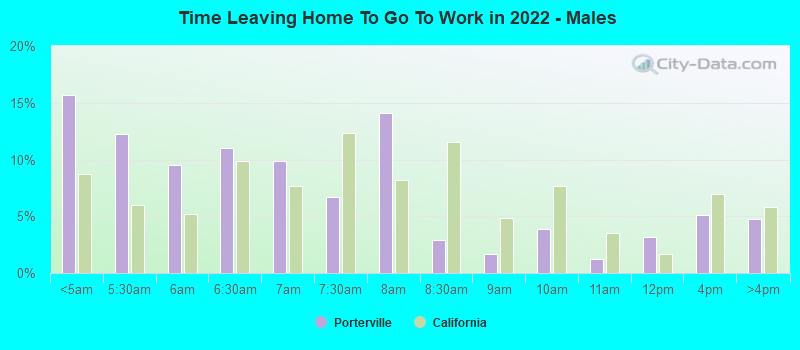
12:00 a.m. to 4:59 a.m. - Males:
| Porterville: | 15.6% (2,181) |
| California: | 8.7% (747,612) |
5:00 a.m. to 5:29 a.m. - Males:
| Porterville: | 12.2% (1,706) |
| California: | 6.0% (509,420) |
5:30 a.m. to 5:59 a.m. - Males:
| Porterville: | 9.6% (1,332) |
| California: | 5.2% (448,269) |
6:00 a.m. to 6:29 a.m. - Males:
| Porterville: | 11.0% (1,536) |
| California: | 9.8% (842,941) |
6:30 a.m. to 6:59 a.m. - Males:
| Porterville: | 9.9% (1,380) |
| California: | 7.7% (657,557) |
7:00 a.m. to 7:29 a.m. - Males:
| Porterville: | 6.7% (928) |
| California: | 12.4% (1,058,532) |
7:30 a.m. to 7:59 a.m. - Males:
| Porterville: | 14.1% (1,967) |
| California: | 8.2% (702,727) |
8:00 a.m. to 8:29 a.m. - Males:
| Porterville: | 2.9% (406) |
| California: | 11.5% (984,538) |
8:30 a.m. to 8:59 a.m. - Males:
| Porterville: | 1.7% (239) |
| California: | 4.8% (414,815) |
9:00 a.m. to 9:59 a.m. - Males:
| Porterville: | 3.9% (541) |
| California: | 7.7% (655,038) |
10:00 a.m. to 10:59 a.m. - Males:
| Porterville: | 1.2% (171) |
| California: | 3.5% (301,425) |
11:00 a.m. to 11:59 a.m. - Males:
| Porterville: | 3.1% (437) |
| California: | 1.7% (141,620) |
12:00 p.m. to 3:59 p.m. - Males:
| Porterville: | 5.1% (716) |
| California: | 7.0% (594,847) |
4:00 p.m. to 11:59 p.m. - Males:
| Porterville: | 4.7% (661) |
| California: | 5.8% (499,471) |
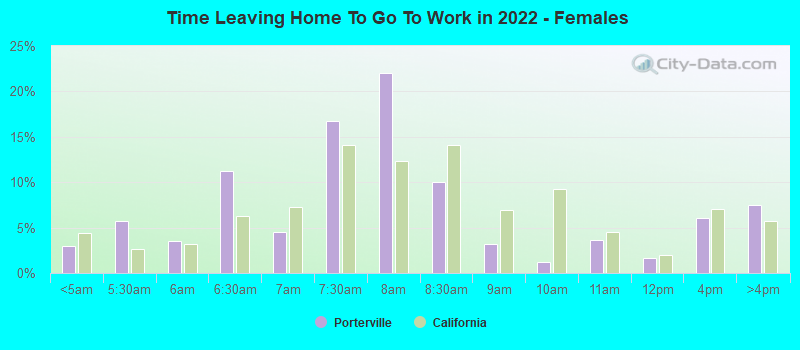
12:00 a.m. to 4:59 a.m. - Females:
| Porterville: | 3.0% (331) |
| California: | 4.4% (303,290) |
5:00 a.m. to 5:29 a.m. - Females:
| Porterville: | 5.8% (633) |
| California: | 2.7% (183,352) |
5:30 a.m. to 5:59 a.m. - Females:
| Porterville: | 3.5% (380) |
| California: | 3.2% (217,206) |
6:00 a.m. to 6:29 a.m. - Females:
| Porterville: | 11.3% (1,235) |
| California: | 6.3% (430,647) |
6:30 a.m. to 6:59 a.m. - Females:
| Porterville: | 4.5% (496) |
| California: | 7.3% (498,781) |
7:00 a.m. to 7:29 a.m. - Females:
| Porterville: | 16.8% (1,834) |
| California: | 14.1% (969,170) |
7:30 a.m. to 7:59 a.m. - Females:
| Porterville: | 22.0% (2,407) |
| California: | 12.4% (847,675) |
8:00 a.m. to 8:29 a.m. - Females:
| Porterville: | 10.0% (1,092) |
| California: | 14.1% (969,448) |
8:30 a.m. to 8:59 a.m. - Females:
| Porterville: | 3.2% (351) |
| California: | 6.9% (476,135) |
9:00 a.m. to 9:59 a.m. - Females:
| Porterville: | 1.2% (133) |
| California: | 9.2% (633,461) |
10:00 a.m. to 10:59 a.m. - Females:
| Porterville: | 3.6% (398) |
| California: | 4.5% (311,768) |
11:00 a.m. to 11:59 a.m. - Females:
| Porterville: | 1.6% (180) |
| California: | 2.0% (139,355) |
12:00 p.m. to 3:59 p.m. - Females:
| Porterville: | 6.1% (667) |
| California: | 7.0% (480,658) |
4:00 p.m. to 11:59 p.m. - Females:
| Porterville: | 7.5% (818) |
| California: | 5.7% (391,769) |
Travel time to work
Percentage of workers working in this county: 89.9%
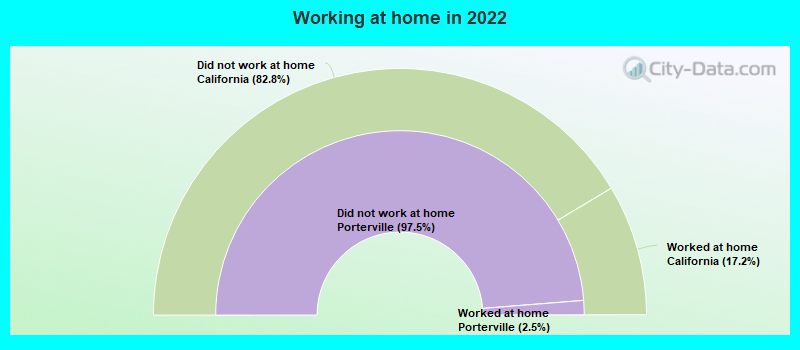
Number of people working at home: 608 (2.4% of all workers)
Daytime population change due to commuting: +3,777 (+9.5%)
Workers who live and work in this city: 7,875 (57.4%)
Number of people working at home: 608 (2.4% of all workers)
Daytime population change due to commuting: +3,777 (+9.5%)
Workers who live and work in this city: 7,875 (57.4%)
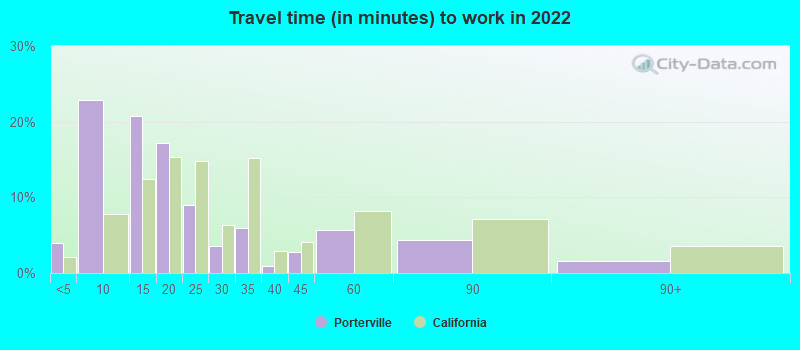
Less than 5 minutes:
| Porterville: | 3.9% (855) |
| California: | 2.1% (323,064) |
5 to 9 minutes:
| Porterville: | 22.9% (4,963) |
| California: | 7.8% (1,208,682) |
10 to 14 minutes:
| Porterville: | 20.8% (4,508) |
| California: | 12.4% (1,917,610) |
15 to 19 minutes:
| Porterville: | 17.1% (3,717) |
| California: | 15.3% (2,367,483) |
20 to 24 minutes:
| Porterville: | 9.0% (1,955) |
| California: | 14.8% (2,279,693) |
25 to 29 minutes:
| Porterville: | 3.5% (768) |
| California: | 6.4% (981,997) |
30 to 34 minutes:
| Porterville: | 5.9% (1,279) |
| California: | 15.2% (2,339,223) |
35 to 39 minutes:
| Porterville: | 0.9% (202) |
| California: | 2.9% (453,226) |
40 to 44 minutes:
| Porterville: | 2.8% (603) |
| California: | 4.1% (637,781) |
45 to 59 minutes:
| Porterville: | 5.7% (1,239) |
| California: | 8.2% (1,259,482) |
60 to 89 minutes:
| Porterville: | 4.4% (949) |
| California: | 7.2% (1,111,698) |
90 or more minutes:
| Porterville: | 1.6% (337) |
| California: | 3.6% (552,805) |
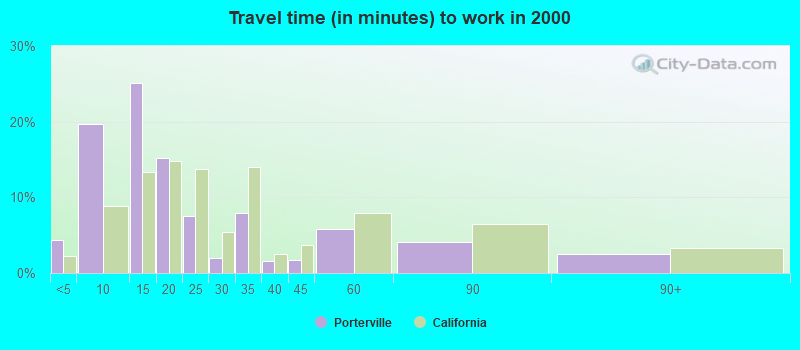
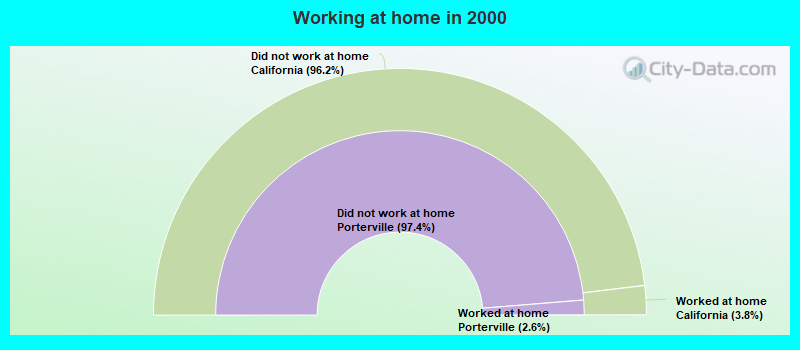
Less than 5 minutes:
| Porterville: | 4.3% (595) |
| California: | 2.2% (324,703) |
5 to 9 minutes:
| Porterville: | 19.7% (2,708) |
| California: | 8.8% (1,280,443) |
10 to 14 minutes:
| Porterville: | 25.2% (3,450) |
| California: | 13.3% (1,930,263) |
15 to 19 minutes:
| Porterville: | 15.2% (2,088) |
| California: | 14.9% (2,157,970) |
20 to 24 minutes:
| Porterville: | 7.5% (1,033) |
| California: | 13.8% (2,004,060) |
25 to 29 minutes:
| Porterville: | 2.0% (280) |
| California: | 5.4% (782,241) |
30 to 34 minutes:
| Porterville: | 7.9% (1,082) |
| California: | 13.9% (2,025,657) |
35 to 39 minutes:
| Porterville: | 1.5% (209) |
| California: | 2.5% (366,487) |
40 to 44 minutes:
| Porterville: | 1.7% (231) |
| California: | 3.6% (528,043) |
45 to 59 minutes:
| Porterville: | 5.8% (793) |
| California: | 7.9% (1,151,598) |
60 to 89 minutes:
| Porterville: | 4.1% (557) |
| California: | 6.4% (933,123) |
90 or more minutes:
| Porterville: | 2.4% (336) |
| California: | 3.3% (483,698) |
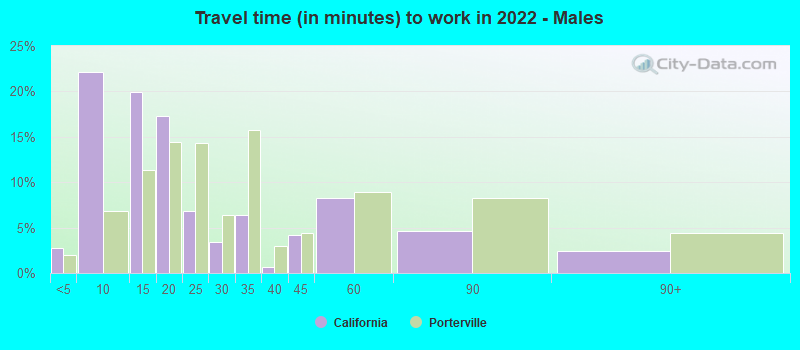
Less than 5 minutes - Males:
| Porterville: | 2.8% (284) |
| California: | 2.0% (173,603) |
5 to 9 minutes - Males:
| Porterville: | 22.1% (2,269) |
| California: | 6.8% (580,822) |
10 to 14 minutes - Males:
| Porterville: | 20.0% (2,051) |
| California: | 11.4% (974,497) |
15 to 19 minutes - Males:
| Porterville: | 17.3% (1,779) |
| California: | 14.5% (1,239,386) |
20 to 24 minutes - Males:
| Porterville: | 6.8% (701) |
| California: | 14.3% (1,223,429) |
25 to 29 minutes - Males:
| Porterville: | 3.5% (355) |
| California: | 6.4% (545,844) |
30 to 34 minutes - Males:
| Porterville: | 6.4% (659) |
| California: | 15.8% (1,352,210) |
35 to 39 minutes - Males:
| Porterville: | 0.7% (68) |
| California: | 3.0% (253,732) |
40 to 44 minutes - Males:
| Porterville: | 4.1% (425) |
| California: | 4.4% (376,144) |
45 to 59 minutes - Males:
| Porterville: | 8.3% (849) |
| California: | 8.9% (762,659) |
60 to 89 minutes - Males:
| Porterville: | 4.6% (472) |
| California: | 8.3% (711,394) |
90 or more minutes - Males:
| Porterville: | 2.4% (247) |
| California: | 4.4% (378,954) |
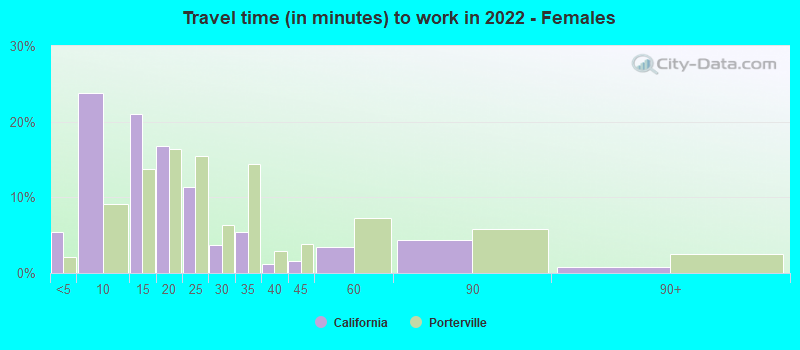
Less than 5 minutes - Females:
| Porterville: | 5.4% (619) |
| California: | 2.2% (149,461) |
5 to 9 minutes - Females:
| Porterville: | 23.8% (2,729) |
| California: | 9.2% (627,860) |
10 to 14 minutes - Females:
| Porterville: | 21.0% (2,407) |
| California: | 13.7% (943,113) |
15 to 19 minutes - Females:
| Porterville: | 16.8% (1,929) |
| California: | 16.4% (1,128,097) |
20 to 24 minutes - Females:
| Porterville: | 11.4% (1,310) |
| California: | 15.4% (1,056,264) |
25 to 29 minutes - Females:
| Porterville: | 3.7% (422) |
| California: | 6.4% (436,153) |
30 to 34 minutes - Females:
| Porterville: | 5.4% (624) |
| California: | 14.4% (987,013) |
35 to 39 minutes - Females:
| Porterville: | 1.1% (130) |
| California: | 2.9% (199,494) |
40 to 44 minutes - Females:
| Porterville: | 1.5% (177) |
| California: | 3.8% (261,637) |
45 to 59 minutes - Females:
| Porterville: | 3.4% (390) |
| California: | 7.2% (496,823) |
60 to 89 minutes - Females:
| Porterville: | 4.4% (499) |
| California: | 5.8% (400,304) |
90 or more minutes - Females:
| Porterville: | 0.8% (90) |
| California: | 2.5% (173,851) |
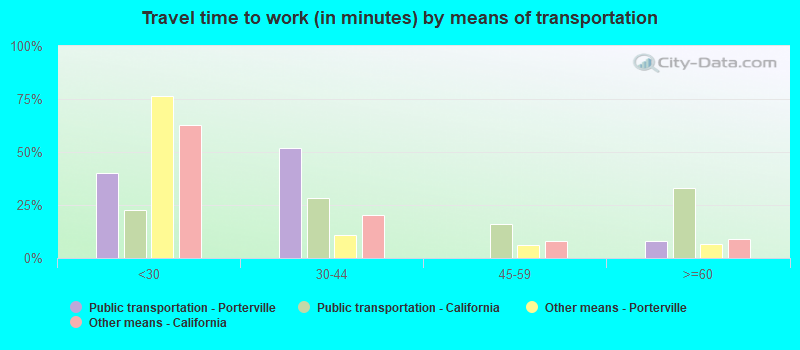
Means of transportation to work
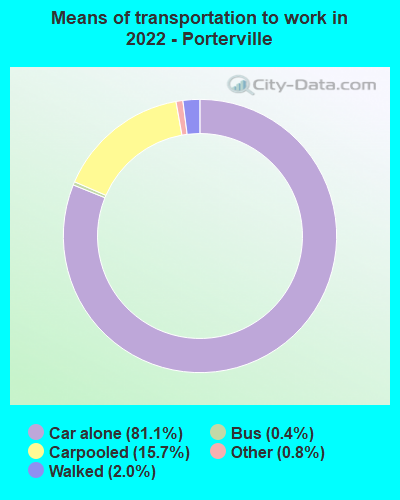

Drove car alone:
| Porterville: | 81.1% (17,622) |
| California: | 79.1% (5,345,368) |
Carpooled:
| Porterville: | 15.7% (3,401) |
| California: | 11.9% (878,699) |
Bus:
| Porterville: | 0.4% (84) |
| California: | 2.2% (170,574) |
Bicycle:
| Porterville: | 0.1% (15) |
| California: | 0.9% (39,197) |
Walked:
| Porterville: | 2.0% (434) |
| California: | 2.9% (218,374) |
Other means:
| Porterville: | 0.8% (167) |
| California: | 2.1% (137,489) |
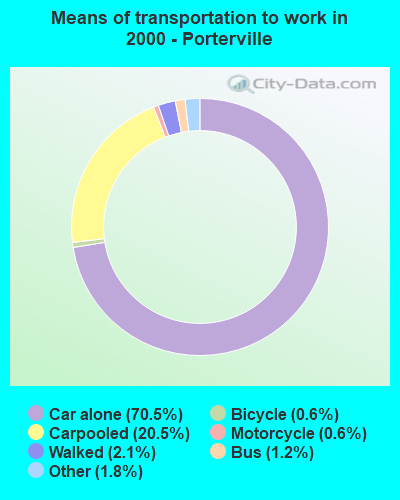

Drove car alone:
| Porterville: | 70.5% (9,668) |
| California: | 71.8% (10,432,462) |
Carpooled:
| Porterville: | 20.5% (2,815) |
| California: | 14.5% (2,113,313) |
Bus or trolley bus:
| Porterville: | 1.2% (170) |
| California: | 3.8% (549,425) |
Taxicab:
| Porterville: | 0.0% (5) |
| California: | 0.1% (9,890) |
Motorcycle:
| Porterville: | 0.6% (85) |
| California: | 0.2% (36,262) |
Bicycle:
| Porterville: | 0.6% (80) |
| California: | 0.8% (120,567) |
Walked:
| Porterville: | 2.1% (290) |
| California: | 2.9% (414,581) |
Other means:
| Porterville: | 1.8% (249) |
| California: | 0.8% (115,064) |
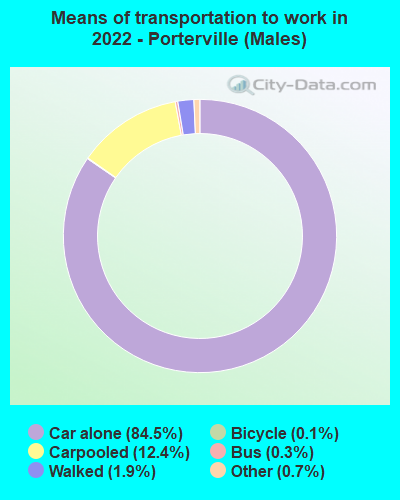

Drove car alone - Males:
| Porterville: | 84.5% (8,675) |
| California: | 80.0% (5,345,368) |
Carpooled - Males:
| Porterville: | 12.4% (1,277) |
| California: | 11.1% (878,699) |
Bus - Males:
| Porterville: | 0.3% (32) |
| California: | 2.0% (170,574) |
Bicycle - Males:
| Porterville: | 0.1% (14) |
| California: | 1.1% (39,197) |
Walked - Males:
| Porterville: | 1.9% (193) |
| California: | 2.7% (218,374) |
Other means - Males:
| Porterville: | 0.7% (76) |
| California: | 2.1% (137,489) |
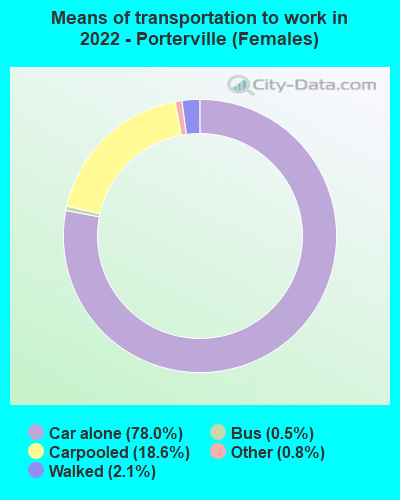

Drove car alone - Females:
| Porterville: | 78.0% (8,985) |
| California: | 77.9% (5,345,368) |
Carpooled - Females:
| Porterville: | 18.6% (2,145) |
| California: | 12.8% (878,699) |
Bus - Females:
| Porterville: | 0.5% (53) |
| California: | 2.5% (170,574) |
Walked - Females:
| Porterville: | 2.1% (242) |
| California: | 3.2% (218,374) |
Other means - Females:
| Porterville: | 0.8% (91) |
| California: | 2.0% (137,489) |
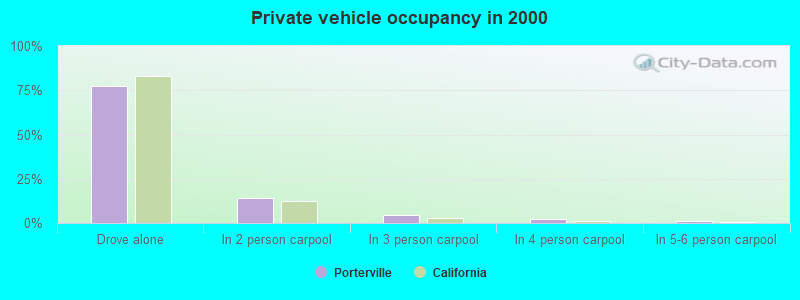
Private vehicle occupancy
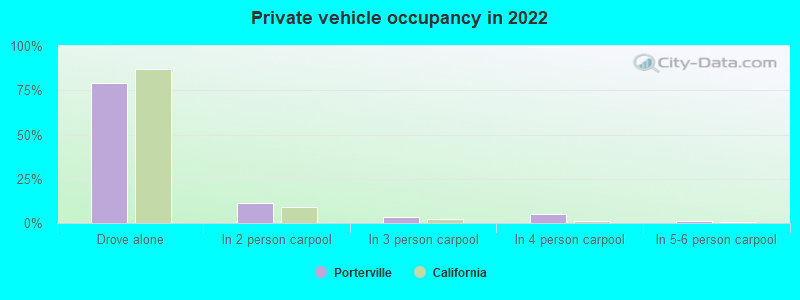
Drove alone:
| Porterville: | 79.1% (19,340) |
| California: | 86.9% (12,187,486) |
In 2 person carpool:
| Porterville: | 11.1% (2,718) |
| California: | 9.2% (1,295,561) |
In 3 person carpool:
| Porterville: | 3.5% (861) |
| California: | 2.2% (309,969) |
In 4 person carpool:
| Porterville: | 4.8% (1,181) |
| California: | 0.9% (126,987) |
In 5-6 person carpool:
| Porterville: | 0.9% (224) |
| California: | 0.5% (70,825) |
In 7+ person carpool:
| Porterville: | 0.5% (125) |
| California: | 0.2% (28,258) |
Drove alone:
| Porterville: | 77.4% (9,668) |
| California: | 83.2% (10,432,462) |
In 2 person carpool:
| Porterville: | 14.2% (1,775) |
| California: | 12.5% (1,564,905) |
In 3 person carpool:
| Porterville: | 4.3% (537) |
| California: | 2.6% (330,732) |
In 4 person carpool:
| Porterville: | 2.0% (251) |
| California: | 1.0% (119,364) |
In 5-6 person carpool:
| Porterville: | 1.3% (165) |
| California: | 0.5% (57,036) |
In 7+ person carpool:
| Porterville: | 0.7% (87) |
| California: | 0.3% (41,276) |
Class of workers
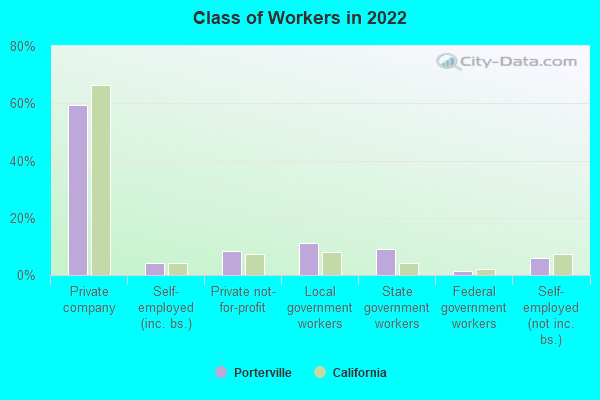
Employee of private company:
| Porterville: | 59.5% (15,906) |
| California: | 66.5% (12,596,030) |
Self-employed in own incorporated business:
| Porterville: | 4.3% (1,139) |
| California: | 4.1% (784,709) |
Private not-for-profit wage and salary workers:
| Porterville: | 8.4% (2,251) |
| California: | 7.5% (1,417,407) |
Local government workers:
| Porterville: | 11.2% (3,002) |
| California: | 8.2% (1,547,056) |
State government workers:
| Porterville: | 9.2% (2,465) |
| California: | 4.1% (780,915) |
Federal government workers:
| Porterville: | 1.3% (359) |
| California: | 2.0% (369,858) |
Self-employed workers in own not incorporated business:
| Porterville: | 6.0% (1,602) |
| California: | 7.4% (1,410,735) |
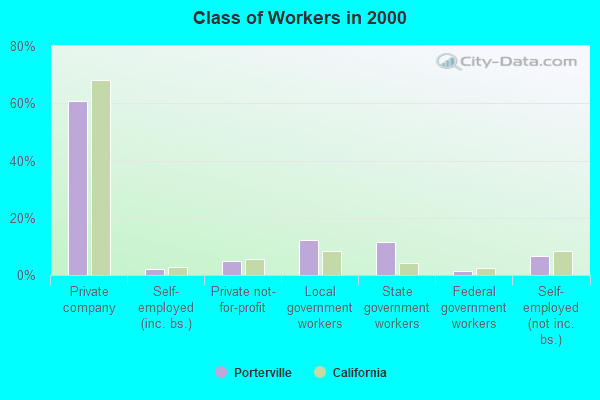
Employee of private company:
| Porterville: | 60.8% (8,601) |
| California: | 68.0% (10,009,465) |
Self-employed in own incorporated business:
| Porterville: | 2.0% (280) |
| California: | 2.7% (402,392) |
Private not-for-profit wage and salary workers:
| Porterville: | 5.0% (706) |
| California: | 5.7% (845,536) |
Local government workers:
| Porterville: | 12.4% (1,748) |
| California: | 8.3% (1,218,764) |
State government workers:
| Porterville: | 11.4% (1,607) |
| California: | 4.0% (594,953) |
Federal government workers:
| Porterville: | 1.5% (208) |
| California: | 2.3% (344,354) |
Self-employed workers in own not incorporated business:
| Porterville: | 6.7% (943) |
| California: | 8.5% (1,249,530) |
Unpaid family workers:
| Porterville: | 0.4% (59) |
| California: | 0.4% (53,934) |
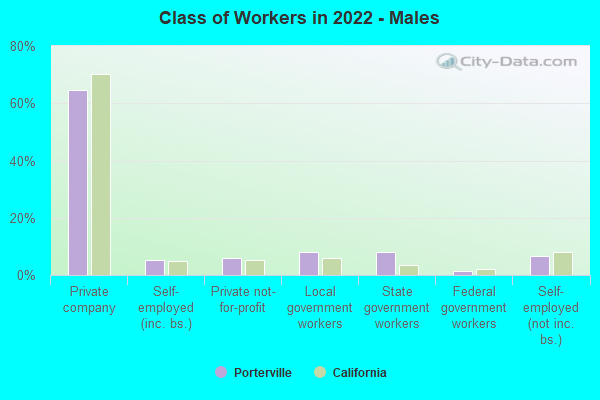
Employee of private company - Males:
| Porterville: | 64.6% (9,514) |
| California: | 70.3% (7,191,252) |
Self-employed in own incorporated business - Males:
| Porterville: | 5.3% (782) |
| California: | 4.9% (504,764) |
Private not-for-profit wage and salary workers - Males:
| Porterville: | 6.0% (885) |
| California: | 5.2% (529,122) |
Local government workers - Males:
| Porterville: | 8.0% (1,175) |
| California: | 6.0% (610,331) |
State government workers - Males:
| Porterville: | 8.2% (1,205) |
| California: | 3.4% (343,636) |
Federal government workers - Males:
| Porterville: | 1.3% (186) |
| California: | 2.1% (209,874) |
Self-employed workers in own not incorporated business - Males:
| Porterville: | 6.7% (988) |
| California: | 8.1% (824,359) |
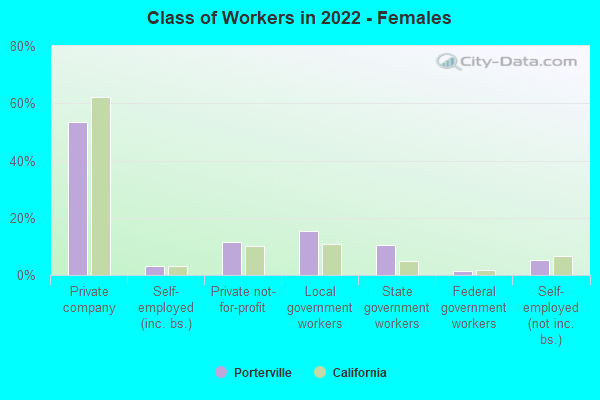
Employee of private company - Females:
| Porterville: | 53.3% (6,391) |
| California: | 62.0% (5,404,778) |
Self-employed in own incorporated business - Females:
| Porterville: | 3.0% (357) |
| California: | 3.2% (279,945) |
Private not-for-profit wage and salary workers - Females:
| Porterville: | 11.4% (1,366) |
| California: | 10.2% (888,285) |
Local government workers - Females:
| Porterville: | 15.2% (1,827) |
| California: | 10.8% (936,725) |
State government workers - Females:
| Porterville: | 10.5% (1,260) |
| California: | 5.0% (437,279) |
Federal government workers - Females:
| Porterville: | 1.4% (173) |
| California: | 1.8% (159,984) |
Self-employed workers in own not incorporated business - Females:
| Porterville: | 5.1% (614) |
| California: | 6.7% (586,376) |