Porterville, California Submit your own pictures of this city and show them to the world
OSM Map
General Map
Google Map
MSN Map
OSM Map
General Map
Google Map
MSN Map
OSM Map
General Map
Google Map
MSN Map
OSM Map
General Map
Google Map
MSN Map
Please wait while loading the map...
Population in 2022: 62,998 (99% urban, 1% rural). Population change since 2000: +59.0%Males: 31,900 Females: 31,098
March 2022 cost of living index in Porterville: 89.1 (less than average, U.S. average is 100) Percentage of residents living in poverty in 2022: 17.7%for White Non-Hispanic residents , 15.6% for Black residents , 18.4% for Hispanic or Latino residents , 21.4% for American Indian residents , 61.3% for Native Hawaiian and other Pacific Islander residents , 13.3% for other race residents , 13.9% for two or more races residents )
Profiles of local businesses
Business Search - 14 Million verified businesses
Data:
Median household income ($)
Median household income (% change since 2000)
Household income diversity
Ratio of average income to average house value (%)
Ratio of average income to average rent
Median household income ($) - White
Median household income ($) - Black or African American
Median household income ($) - Asian
Median household income ($) - Hispanic or Latino
Median household income ($) - American Indian and Alaska Native
Median household income ($) - Multirace
Median household income ($) - Other Race
Median household income for houses/condos with a mortgage ($)
Median household income for apartments without a mortgage ($)
Races - White alone (%)
Races - White alone (% change since 2000)
Races - Black alone (%)
Races - Black alone (% change since 2000)
Races - American Indian alone (%)
Races - American Indian alone (% change since 2000)
Races - Asian alone (%)
Races - Asian alone (% change since 2000)
Races - Hispanic (%)
Races - Hispanic (% change since 2000)
Races - Native Hawaiian and Other Pacific Islander alone (%)
Races - Native Hawaiian and Other Pacific Islander alone (% change since 2000)
Races - Two or more races (%)
Races - Two or more races (% change since 2000)
Races - Other race alone (%)
Races - Other race alone (% change since 2000)
Racial diversity
Unemployment (%)
Unemployment (% change since 2000)
Unemployment (%) - White
Unemployment (%) - Black or African American
Unemployment (%) - Asian
Unemployment (%) - Hispanic or Latino
Unemployment (%) - American Indian and Alaska Native
Unemployment (%) - Multirace
Unemployment (%) - Other Race
Population density (people per square mile)
Population - Males (%)
Population - Females (%)
Population - Males (%) - White
Population - Males (%) - Black or African American
Population - Males (%) - Asian
Population - Males (%) - Hispanic or Latino
Population - Males (%) - American Indian and Alaska Native
Population - Males (%) - Multirace
Population - Males (%) - Other Race
Population - Females (%) - White
Population - Females (%) - Black or African American
Population - Females (%) - Asian
Population - Females (%) - Hispanic or Latino
Population - Females (%) - American Indian and Alaska Native
Population - Females (%) - Multirace
Population - Females (%) - Other Race
Coronavirus confirmed cases (Apr 24, 2024)
Deaths caused by coronavirus (Apr 24, 2024)
Coronavirus confirmed cases (per 100k population) (Apr 24, 2024)
Deaths caused by coronavirus (per 100k population) (Apr 24, 2024)
Daily increase in number of cases (Apr 24, 2024)
Weekly increase in number of cases (Apr 24, 2024)
Cases doubled (in days) (Apr 24, 2024)
Hospitalized patients (Apr 18, 2022)
Negative test results (Apr 18, 2022)
Total test results (Apr 18, 2022)
COVID Vaccine doses distributed (per 100k population) (Sep 19, 2023)
COVID Vaccine doses administered (per 100k population) (Sep 19, 2023)
COVID Vaccine doses distributed (Sep 19, 2023)
COVID Vaccine doses administered (Sep 19, 2023)
Likely homosexual households (%)
Likely homosexual households (% change since 2000)
Likely homosexual households - Lesbian couples (%)
Likely homosexual households - Lesbian couples (% change since 2000)
Likely homosexual households - Gay men (%)
Likely homosexual households - Gay men (% change since 2000)
Cost of living index
Median gross rent ($)
Median contract rent ($)
Median monthly housing costs ($)
Median house or condo value ($)
Median house or condo value ($ change since 2000)
Mean house or condo value by units in structure - 1, detached ($)
Mean house or condo value by units in structure - 1, attached ($)
Mean house or condo value by units in structure - 2 ($)
Mean house or condo value by units in structure by units in structure - 3 or 4 ($)
Mean house or condo value by units in structure - 5 or more ($)
Mean house or condo value by units in structure - Boat, RV, van, etc. ($)
Mean house or condo value by units in structure - Mobile home ($)
Median house or condo value ($) - White
Median house or condo value ($) - Black or African American
Median house or condo value ($) - Asian
Median house or condo value ($) - Hispanic or Latino
Median house or condo value ($) - American Indian and Alaska Native
Median house or condo value ($) - Multirace
Median house or condo value ($) - Other Race
Median resident age
Resident age diversity
Median resident age - Males
Median resident age - Females
Median resident age - White
Median resident age - Black or African American
Median resident age - Asian
Median resident age - Hispanic or Latino
Median resident age - American Indian and Alaska Native
Median resident age - Multirace
Median resident age - Other Race
Median resident age - Males - White
Median resident age - Males - Black or African American
Median resident age - Males - Asian
Median resident age - Males - Hispanic or Latino
Median resident age - Males - American Indian and Alaska Native
Median resident age - Males - Multirace
Median resident age - Males - Other Race
Median resident age - Females - White
Median resident age - Females - Black or African American
Median resident age - Females - Asian
Median resident age - Females - Hispanic or Latino
Median resident age - Females - American Indian and Alaska Native
Median resident age - Females - Multirace
Median resident age - Females - Other Race
Commute - mean travel time to work (minutes)
Travel time to work - Less than 5 minutes (%)
Travel time to work - Less than 5 minutes (% change since 2000)
Travel time to work - 5 to 9 minutes (%)
Travel time to work - 5 to 9 minutes (% change since 2000)
Travel time to work - 10 to 19 minutes (%)
Travel time to work - 10 to 19 minutes (% change since 2000)
Travel time to work - 20 to 29 minutes (%)
Travel time to work - 20 to 29 minutes (% change since 2000)
Travel time to work - 30 to 39 minutes (%)
Travel time to work - 30 to 39 minutes (% change since 2000)
Travel time to work - 40 to 59 minutes (%)
Travel time to work - 40 to 59 minutes (% change since 2000)
Travel time to work - 60 to 89 minutes (%)
Travel time to work - 60 to 89 minutes (% change since 2000)
Travel time to work - 90 or more minutes (%)
Travel time to work - 90 or more minutes (% change since 2000)
Marital status - Never married (%)
Marital status - Now married (%)
Marital status - Separated (%)
Marital status - Widowed (%)
Marital status - Divorced (%)
Median family income ($)
Median family income (% change since 2000)
Median non-family income ($)
Median non-family income (% change since 2000)
Median per capita income ($)
Median per capita income (% change since 2000)
Median family income ($) - White
Median family income ($) - Black or African American
Median family income ($) - Asian
Median family income ($) - Hispanic or Latino
Median family income ($) - American Indian and Alaska Native
Median family income ($) - Multirace
Median family income ($) - Other Race
Median year house/condo built
Median year apartment built
Year house built - Built 2005 or later (%)
Year house built - Built 2000 to 2004 (%)
Year house built - Built 1990 to 1999 (%)
Year house built - Built 1980 to 1989 (%)
Year house built - Built 1970 to 1979 (%)
Year house built - Built 1960 to 1969 (%)
Year house built - Built 1950 to 1959 (%)
Year house built - Built 1940 to 1949 (%)
Year house built - Built 1939 or earlier (%)
Average household size
Household density (households per square mile)
Average household size - White
Average household size - Black or African American
Average household size - Asian
Average household size - Hispanic or Latino
Average household size - American Indian and Alaska Native
Average household size - Multirace
Average household size - Other Race
Occupied housing units (%)
Vacant housing units (%)
Owner occupied housing units (%)
Renter occupied housing units (%)
Vacancy status - For rent (%)
Vacancy status - For sale only (%)
Vacancy status - Rented or sold, not occupied (%)
Vacancy status - For seasonal, recreational, or occasional use (%)
Vacancy status - For migrant workers (%)
Vacancy status - Other vacant (%)
Residents with income below the poverty level (%)
Residents with income below 50% of the poverty level (%)
Children below poverty level (%)
Poor families by family type - Married-couple family (%)
Poor families by family type - Male, no wife present (%)
Poor families by family type - Female, no husband present (%)
Poverty status for native-born residents (%)
Poverty status for foreign-born residents (%)
Poverty among high school graduates not in families (%)
Poverty among people who did not graduate high school not in families (%)
Residents with income below the poverty level (%) - White
Residents with income below the poverty level (%) - Black or African American
Residents with income below the poverty level (%) - Asian
Residents with income below the poverty level (%) - Hispanic or Latino
Residents with income below the poverty level (%) - American Indian and Alaska Native
Residents with income below the poverty level (%) - Multirace
Residents with income below the poverty level (%) - Other Race
Air pollution - Air Quality Index (AQI)
Air pollution - CO
Air pollution - NO2
Air pollution - SO2
Air pollution - Ozone
Air pollution - PM10
Air pollution - PM25
Air pollution - Pb
Crime - Murders per 100,000 population
Crime - Rapes per 100,000 population
Crime - Robberies per 100,000 population
Crime - Assaults per 100,000 population
Crime - Burglaries per 100,000 population
Crime - Thefts per 100,000 population
Crime - Auto thefts per 100,000 population
Crime - Arson per 100,000 population
Crime - City-data.com crime index
Crime - Violent crime index
Crime - Property crime index
Crime - Murders per 100,000 population (5 year average)
Crime - Rapes per 100,000 population (5 year average)
Crime - Robberies per 100,000 population (5 year average)
Crime - Assaults per 100,000 population (5 year average)
Crime - Burglaries per 100,000 population (5 year average)
Crime - Thefts per 100,000 population (5 year average)
Crime - Auto thefts per 100,000 population (5 year average)
Crime - Arson per 100,000 population (5 year average)
Crime - City-data.com crime index (5 year average)
Crime - Violent crime index (5 year average)
Crime - Property crime index (5 year average)
1996 Presidential Elections Results (%) - Democratic Party (Clinton)
1996 Presidential Elections Results (%) - Republican Party (Dole)
1996 Presidential Elections Results (%) - Other
2000 Presidential Elections Results (%) - Democratic Party (Gore)
2000 Presidential Elections Results (%) - Republican Party (Bush)
2000 Presidential Elections Results (%) - Other
2004 Presidential Elections Results (%) - Democratic Party (Kerry)
2004 Presidential Elections Results (%) - Republican Party (Bush)
2004 Presidential Elections Results (%) - Other
2008 Presidential Elections Results (%) - Democratic Party (Obama)
2008 Presidential Elections Results (%) - Republican Party (McCain)
2008 Presidential Elections Results (%) - Other
2012 Presidential Elections Results (%) - Democratic Party (Obama)
2012 Presidential Elections Results (%) - Republican Party (Romney)
2012 Presidential Elections Results (%) - Other
2016 Presidential Elections Results (%) - Democratic Party (Clinton)
2016 Presidential Elections Results (%) - Republican Party (Trump)
2016 Presidential Elections Results (%) - Other
2020 Presidential Elections Results (%) - Democratic Party (Biden)
2020 Presidential Elections Results (%) - Republican Party (Trump)
2020 Presidential Elections Results (%) - Other
Ancestries Reported - Arab (%)
Ancestries Reported - Czech (%)
Ancestries Reported - Danish (%)
Ancestries Reported - Dutch (%)
Ancestries Reported - English (%)
Ancestries Reported - French (%)
Ancestries Reported - French Canadian (%)
Ancestries Reported - German (%)
Ancestries Reported - Greek (%)
Ancestries Reported - Hungarian (%)
Ancestries Reported - Irish (%)
Ancestries Reported - Italian (%)
Ancestries Reported - Lithuanian (%)
Ancestries Reported - Norwegian (%)
Ancestries Reported - Polish (%)
Ancestries Reported - Portuguese (%)
Ancestries Reported - Russian (%)
Ancestries Reported - Scotch-Irish (%)
Ancestries Reported - Scottish (%)
Ancestries Reported - Slovak (%)
Ancestries Reported - Subsaharan African (%)
Ancestries Reported - Swedish (%)
Ancestries Reported - Swiss (%)
Ancestries Reported - Ukrainian (%)
Ancestries Reported - United States (%)
Ancestries Reported - Welsh (%)
Ancestries Reported - West Indian (%)
Ancestries Reported - Other (%)
Educational Attainment - No schooling completed (%)
Educational Attainment - Less than high school (%)
Educational Attainment - High school or equivalent (%)
Educational Attainment - Less than 1 year of college (%)
Educational Attainment - 1 or more years of college (%)
Educational Attainment - Associate degree (%)
Educational Attainment - Bachelor's degree (%)
Educational Attainment - Master's degree (%)
Educational Attainment - Professional school degree (%)
Educational Attainment - Doctorate degree (%)
School Enrollment - Nursery, preschool (%)
School Enrollment - Kindergarten (%)
School Enrollment - Grade 1 to 4 (%)
School Enrollment - Grade 5 to 8 (%)
School Enrollment - Grade 9 to 12 (%)
School Enrollment - College undergrad (%)
School Enrollment - Graduate or professional (%)
School Enrollment - Not enrolled in school (%)
School enrollment - Public schools (%)
School enrollment - Private schools (%)
School enrollment - Not enrolled (%)
Median number of rooms in houses and condos
Median number of rooms in apartments
Housing units lacking complete plumbing facilities (%)
Housing units lacking complete kitchen facilities (%)
Density of houses
Urban houses (%)
Rural houses (%)
Households with people 60 years and over (%)
Households with people 65 years and over (%)
Households with people 75 years and over (%)
Households with one or more nonrelatives (%)
Households with no nonrelatives (%)
Population in households (%)
Family households (%)
Nonfamily households (%)
Population in families (%)
Family households with own children (%)
Median number of bedrooms in owner occupied houses
Mean number of bedrooms in owner occupied houses
Median number of bedrooms in renter occupied houses
Mean number of bedrooms in renter occupied houses
Median number of vehichles in owner occupied houses
Mean number of vehichles in owner occupied houses
Median number of vehichles in renter occupied houses
Mean number of vehichles in renter occupied houses
Mortgage status - with mortgage (%)
Mortgage status - with second mortgage (%)
Mortgage status - with home equity loan (%)
Mortgage status - with both second mortgage and home equity loan (%)
Mortgage status - without a mortgage (%)
Average family size
Average family size - White
Average family size - Black or African American
Average family size - Asian
Average family size - Hispanic or Latino
Average family size - American Indian and Alaska Native
Average family size - Multirace
Average family size - Other Race
Geographical mobility - Same house 1 year ago (%)
Geographical mobility - Moved within same county (%)
Geographical mobility - Moved from different county within same state (%)
Geographical mobility - Moved from different state (%)
Geographical mobility - Moved from abroad (%)
Place of birth - Born in state of residence (%)
Place of birth - Born in other state (%)
Place of birth - Native, outside of US (%)
Place of birth - Foreign born (%)
Housing units in structures - 1, detached (%)
Housing units in structures - 1, attached (%)
Housing units in structures - 2 (%)
Housing units in structures - 3 or 4 (%)
Housing units in structures - 5 to 9 (%)
Housing units in structures - 10 to 19 (%)
Housing units in structures - 20 to 49 (%)
Housing units in structures - 50 or more (%)
Housing units in structures - Mobile home (%)
Housing units in structures - Boat, RV, van, etc. (%)
House/condo owner moved in on average (years ago)
Renter moved in on average (years ago)
Year householder moved into unit - Moved in 1999 to March 2000 (%)
Year householder moved into unit - Moved in 1995 to 1998 (%)
Year householder moved into unit - Moved in 1990 to 1994 (%)
Year householder moved into unit - Moved in 1980 to 1989 (%)
Year householder moved into unit - Moved in 1970 to 1979 (%)
Year householder moved into unit - Moved in 1969 or earlier (%)
Means of transportation to work - Drove car alone (%)
Means of transportation to work - Carpooled (%)
Means of transportation to work - Public transportation (%)
Means of transportation to work - Bus or trolley bus (%)
Means of transportation to work - Streetcar or trolley car (%)
Means of transportation to work - Subway or elevated (%)
Means of transportation to work - Railroad (%)
Means of transportation to work - Ferryboat (%)
Means of transportation to work - Taxicab (%)
Means of transportation to work - Motorcycle (%)
Means of transportation to work - Bicycle (%)
Means of transportation to work - Walked (%)
Means of transportation to work - Other means (%)
Working at home (%)
Industry diversity
Most Common Industries - Agriculture, forestry, fishing and hunting, and mining (%)
Most Common Industries - Agriculture, forestry, fishing and hunting (%)
Most Common Industries - Mining, quarrying, and oil and gas extraction (%)
Most Common Industries - Construction (%)
Most Common Industries - Manufacturing (%)
Most Common Industries - Wholesale trade (%)
Most Common Industries - Retail trade (%)
Most Common Industries - Transportation and warehousing, and utilities (%)
Most Common Industries - Transportation and warehousing (%)
Most Common Industries - Utilities (%)
Most Common Industries - Information (%)
Most Common Industries - Finance and insurance, and real estate and rental and leasing (%)
Most Common Industries - Finance and insurance (%)
Most Common Industries - Real estate and rental and leasing (%)
Most Common Industries - Professional, scientific, and management, and administrative and waste management services (%)
Most Common Industries - Professional, scientific, and technical services (%)
Most Common Industries - Management of companies and enterprises (%)
Most Common Industries - Administrative and support and waste management services (%)
Most Common Industries - Educational services, and health care and social assistance (%)
Most Common Industries - Educational services (%)
Most Common Industries - Health care and social assistance (%)
Most Common Industries - Arts, entertainment, and recreation, and accommodation and food services (%)
Most Common Industries - Arts, entertainment, and recreation (%)
Most Common Industries - Accommodation and food services (%)
Most Common Industries - Other services, except public administration (%)
Most Common Industries - Public administration (%)
Occupation diversity
Most Common Occupations - Management, business, science, and arts occupations (%)
Most Common Occupations - Management, business, and financial occupations (%)
Most Common Occupations - Management occupations (%)
Most Common Occupations - Business and financial operations occupations (%)
Most Common Occupations - Computer, engineering, and science occupations (%)
Most Common Occupations - Computer and mathematical occupations (%)
Most Common Occupations - Architecture and engineering occupations (%)
Most Common Occupations - Life, physical, and social science occupations (%)
Most Common Occupations - Education, legal, community service, arts, and media occupations (%)
Most Common Occupations - Community and social service occupations (%)
Most Common Occupations - Legal occupations (%)
Most Common Occupations - Education, training, and library occupations (%)
Most Common Occupations - Arts, design, entertainment, sports, and media occupations (%)
Most Common Occupations - Healthcare practitioners and technical occupations (%)
Most Common Occupations - Health diagnosing and treating practitioners and other technical occupations (%)
Most Common Occupations - Health technologists and technicians (%)
Most Common Occupations - Service occupations (%)
Most Common Occupations - Healthcare support occupations (%)
Most Common Occupations - Protective service occupations (%)
Most Common Occupations - Fire fighting and prevention, and other protective service workers including supervisors (%)
Most Common Occupations - Law enforcement workers including supervisors (%)
Most Common Occupations - Food preparation and serving related occupations (%)
Most Common Occupations - Building and grounds cleaning and maintenance occupations (%)
Most Common Occupations - Personal care and service occupations (%)
Most Common Occupations - Sales and office occupations (%)
Most Common Occupations - Sales and related occupations (%)
Most Common Occupations - Office and administrative support occupations (%)
Most Common Occupations - Natural resources, construction, and maintenance occupations (%)
Most Common Occupations - Farming, fishing, and forestry occupations (%)
Most Common Occupations - Construction and extraction occupations (%)
Most Common Occupations - Installation, maintenance, and repair occupations (%)
Most Common Occupations - Production, transportation, and material moving occupations (%)
Most Common Occupations - Production occupations (%)
Most Common Occupations - Transportation occupations (%)
Most Common Occupations - Material moving occupations (%)
People in Group quarters - Institutionalized population (%)
People in Group quarters - Correctional institutions (%)
People in Group quarters - Federal prisons and detention centers (%)
People in Group quarters - Halfway houses (%)
People in Group quarters - Local jails and other confinement facilities (including police lockups) (%)
People in Group quarters - Military disciplinary barracks (%)
People in Group quarters - State prisons (%)
People in Group quarters - Other types of correctional institutions (%)
People in Group quarters - Nursing homes (%)
People in Group quarters - Hospitals/wards, hospices, and schools for the handicapped (%)
People in Group quarters - Hospitals/wards and hospices for chronically ill (%)
People in Group quarters - Hospices or homes for chronically ill (%)
People in Group quarters - Military hospitals or wards for chronically ill (%)
People in Group quarters - Other hospitals or wards for chronically ill (%)
People in Group quarters - Hospitals or wards for drug/alcohol abuse (%)
People in Group quarters - Mental (Psychiatric) hospitals or wards (%)
People in Group quarters - Schools, hospitals, or wards for the mentally retarded (%)
People in Group quarters - Schools, hospitals, or wards for the physically handicapped (%)
People in Group quarters - Institutions for the deaf (%)
People in Group quarters - Institutions for the blind (%)
People in Group quarters - Orthopedic wards and institutions for the physically handicapped (%)
People in Group quarters - Wards in general hospitals for patients who have no usual home elsewhere (%)
People in Group quarters - Wards in military hospitals for patients who have no usual home elsewhere (%)
People in Group quarters - Juvenile institutions (%)
People in Group quarters - Long-term care (%)
People in Group quarters - Homes for abused, dependent, and neglected children (%)
People in Group quarters - Residential treatment centers for emotionally disturbed children (%)
People in Group quarters - Training schools for juvenile delinquents (%)
People in Group quarters - Short-term care, detention or diagnostic centers for delinquent children (%)
People in Group quarters - Type of juvenile institution unknown (%)
People in Group quarters - Noninstitutionalized population (%)
People in Group quarters - College dormitories (includes college quarters off campus) (%)
People in Group quarters - Military quarters (%)
People in Group quarters - On base (%)
People in Group quarters - Barracks, unaccompanied personnel housing (UPH), (Enlisted/Officer), ;and similar group living quarters for military personnel (%)
People in Group quarters - Transient quarters for temporary residents (%)
People in Group quarters - Military ships (%)
People in Group quarters - Group homes (%)
People in Group quarters - Homes or halfway houses for drug/alcohol abuse (%)
People in Group quarters - Homes for the mentally ill (%)
People in Group quarters - Homes for the mentally retarded (%)
People in Group quarters - Homes for the physically handicapped (%)
People in Group quarters - Other group homes (%)
People in Group quarters - Religious group quarters (%)
People in Group quarters - Dormitories (%)
People in Group quarters - Agriculture workers' dormitories on farms (%)
People in Group quarters - Job Corps and vocational training facilities (%)
People in Group quarters - Other workers' dormitories (%)
People in Group quarters - Crews of maritime vessels (%)
People in Group quarters - Other nonhousehold living situations (%)
People in Group quarters - Other noninstitutional group quarters (%)
Residents speaking English at home (%)
Residents speaking English at home - Born in the United States (%)
Residents speaking English at home - Native, born elsewhere (%)
Residents speaking English at home - Foreign born (%)
Residents speaking Spanish at home (%)
Residents speaking Spanish at home - Born in the United States (%)
Residents speaking Spanish at home - Native, born elsewhere (%)
Residents speaking Spanish at home - Foreign born (%)
Residents speaking other language at home (%)
Residents speaking other language at home - Born in the United States (%)
Residents speaking other language at home - Native, born elsewhere (%)
Residents speaking other language at home - Foreign born (%)
Class of Workers - Employee of private company (%)
Class of Workers - Self-employed in own incorporated business (%)
Class of Workers - Private not-for-profit wage and salary workers (%)
Class of Workers - Local government workers (%)
Class of Workers - State government workers (%)
Class of Workers - Federal government workers (%)
Class of Workers - Self-employed workers in own not incorporated business and Unpaid family workers (%)
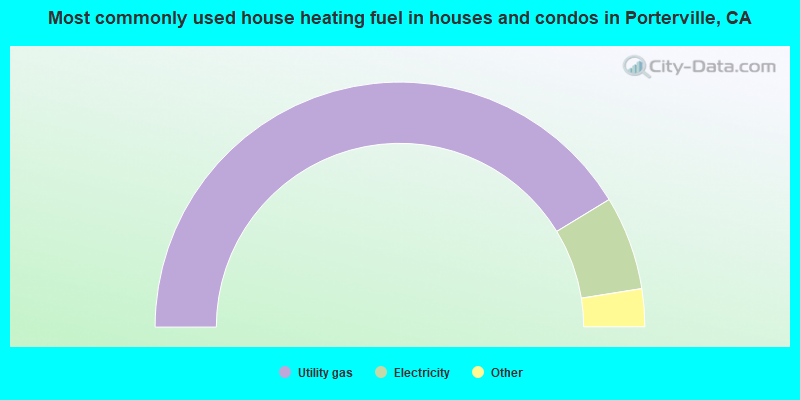
House heating fuel used in houses and condos - Utility gas (%)
House heating fuel used in houses and condos - Bottled, tank, or LP gas (%)
House heating fuel used in houses and condos - Electricity (%)
House heating fuel used in houses and condos - Fuel oil, kerosene, etc. (%)
House heating fuel used in houses and condos - Coal or coke (%)
House heating fuel used in houses and condos - Wood (%)
House heating fuel used in houses and condos - Solar energy (%)
House heating fuel used in houses and condos - Other fuel (%)
House heating fuel used in houses and condos - No fuel used (%)
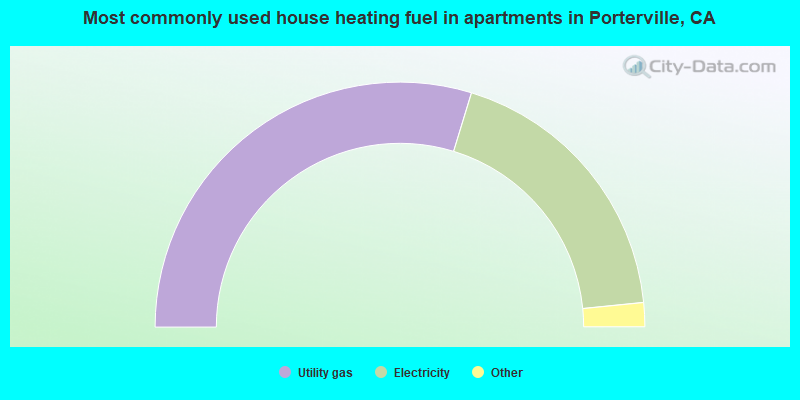
House heating fuel used in apartments - Utility gas (%)
House heating fuel used in apartments - Bottled, tank, or LP gas (%)
House heating fuel used in apartments - Electricity (%)
House heating fuel used in apartments - Fuel oil, kerosene, etc. (%)
House heating fuel used in apartments - Coal or coke (%)
House heating fuel used in apartments - Wood (%)
House heating fuel used in apartments - Solar energy (%)
House heating fuel used in apartments - Other fuel (%)
House heating fuel used in apartments - No fuel used (%)
Armed forces status - In Armed Forces (%)
Armed forces status - Civilian (%)
Armed forces status - Civilian - Veteran (%)
Armed forces status - Civilian - Nonveteran (%)
Fatal accidents locations in years 2005-2021
Fatal accidents locations in 2005
Fatal accidents locations in 2006
Fatal accidents locations in 2007
Fatal accidents locations in 2008
Fatal accidents locations in 2009
Fatal accidents locations in 2010
Fatal accidents locations in 2011
Fatal accidents locations in 2012
Fatal accidents locations in 2013
Fatal accidents locations in 2014
Fatal accidents locations in 2015
Fatal accidents locations in 2016
Fatal accidents locations in 2017
Fatal accidents locations in 2018
Fatal accidents locations in 2019
Fatal accidents locations in 2020
Fatal accidents locations in 2021
Alcohol use - People drinking some alcohol every month (%)
Alcohol use - People not drinking at all (%)
Alcohol use - Average days/month drinking alcohol
Alcohol use - Average drinks/week
Alcohol use - Average days/year people drink much
Audiometry - Average condition of hearing (%)
Audiometry - People that can hear a whisper from across a quiet room (%)
Audiometry - People that can hear normal voice from across a quiet room (%)
Audiometry - Ears ringing, roaring, buzzing (%)
Audiometry - Had a job exposure to loud noise (%)
Audiometry - Had off-work exposure to loud noise (%)
Blood Pressure & Cholesterol - Has high blood pressure (%)
Blood Pressure & Cholesterol - Checking blood pressure at home (%)
Blood Pressure & Cholesterol - Frequently checking blood cholesterol (%)
Blood Pressure & Cholesterol - Has high cholesterol level (%)
Consumer Behavior - Money monthly spent on food at supermarket/grocery store
Consumer Behavior - Money monthly spent on food at other stores
Consumer Behavior - Money monthly spent on eating out
Consumer Behavior - Money monthly spent on carryout/delivered foods
Consumer Behavior - Income spent on food at supermarket/grocery store (%)
Consumer Behavior - Income spent on food at other stores (%)
Consumer Behavior - Income spent on eating out (%)
Consumer Behavior - Income spent on carryout/delivered foods (%)
Current Health Status - General health condition (%)
Current Health Status - Blood donors (%)
Current Health Status - Has blood ever tested for HIV virus (%)
Current Health Status - Left-handed people (%)
Dermatology - People using sunscreen (%)
Diabetes - Diabetics (%)
Diabetes - Had a blood test for high blood sugar (%)
Diabetes - People taking insulin (%)
Diet Behavior & Nutrition - Diet health (%)
Diet Behavior & Nutrition - Milk product consumption (# of products/month)
Diet Behavior & Nutrition - Meals not home prepared (#/week)
Diet Behavior & Nutrition - Meals from fast food or pizza place (#/week)
Diet Behavior & Nutrition - Ready-to-eat foods (#/month)
Diet Behavior & Nutrition - Frozen meals/pizza (#/month)
Drug Use - People that ever used marijuana or hashish (%)
Drug Use - Ever used hard drugs (%)
Drug Use - Ever used any form of cocaine (%)
Drug Use - Ever used heroin (%)
Drug Use - Ever used methamphetamine (%)
Health Insurance - People covered by health insurance (%)
Kidney Conditions-Urology - Avg. # of times urinating at night
Medical Conditions - People with asthma (%)
Medical Conditions - People with anemia (%)
Medical Conditions - People with psoriasis (%)
Medical Conditions - People with overweight (%)
Medical Conditions - Elderly people having difficulties in thinking or remembering (%)
Medical Conditions - People who ever received blood transfusion (%)
Medical Conditions - People having trouble seeing even with glass/contacts (%)
Medical Conditions - People with arthritis (%)
Medical Conditions - People with gout (%)
Medical Conditions - People with congestive heart failure (%)
Medical Conditions - People with coronary heart disease (%)
Medical Conditions - People with angina pectoris (%)
Medical Conditions - People who ever had heart attack (%)
Medical Conditions - People who ever had stroke (%)
Medical Conditions - People with emphysema (%)
Medical Conditions - People with thyroid problem (%)
Medical Conditions - People with chronic bronchitis (%)
Medical Conditions - People with any liver condition (%)
Medical Conditions - People who ever had cancer or malignancy (%)
Mental Health - People who have little interest in doing things (%)
Mental Health - People feeling down, depressed, or hopeless (%)
Mental Health - People who have trouble sleeping or sleeping too much (%)
Mental Health - People feeling tired or having little energy (%)
Mental Health - People with poor appetite or overeating (%)
Mental Health - People feeling bad about themself (%)
Mental Health - People who have trouble concentrating on things (%)
Mental Health - People moving or speaking slowly or too fast (%)
Mental Health - People having thoughts they would be better off dead (%)
Oral Health - Average years since last visit a dentist
Oral Health - People embarrassed because of mouth (%)
Oral Health - People with gum disease (%)
Oral Health - General health of teeth and gums (%)
Oral Health - Average days a week using dental floss/device
Oral Health - Average days a week using mouthwash for dental problem
Oral Health - Average number of teeth
Pesticide Use - Households using pesticides to control insects (%)
Pesticide Use - Households using pesticides to kill weeds (%)
Physical Activity - People doing vigorous-intensity work activities (%)
Physical Activity - People doing moderate-intensity work activities (%)
Physical Activity - People walking or bicycling (%)
Physical Activity - People doing vigorous-intensity recreational activities (%)
Physical Activity - People doing moderate-intensity recreational activities (%)
Physical Activity - Average hours a day doing sedentary activities
Physical Activity - Average hours a day watching TV or videos
Physical Activity - Average hours a day using computer
Physical Functioning - People having limitations keeping them from working (%)
Physical Functioning - People limited in amount of work they can do (%)
Physical Functioning - People that need special equipment to walk (%)
Physical Functioning - People experiencing confusion/memory problems (%)
Physical Functioning - People requiring special healthcare equipment (%)
Prescription Medications - Average number of prescription medicines taking
Preventive Aspirin Use - Adults 40+ taking low-dose aspirin (%)
Reproductive Health - Vaginal deliveries (%)
Reproductive Health - Cesarean deliveries (%)
Reproductive Health - Deliveries resulted in a live birth (%)
Reproductive Health - Pregnancies resulted in a delivery (%)
Reproductive Health - Women breastfeeding newborns (%)
Reproductive Health - Women that had a hysterectomy (%)
Reproductive Health - Women that had both ovaries removed (%)
Reproductive Health - Women that have ever taken birth control pills (%)
Reproductive Health - Women taking birth control pills (%)
Reproductive Health - Women that have ever used Depo-Provera or injectables (%)
Reproductive Health - Women that have ever used female hormones (%)
Sexual Behavior - People 18+ that ever had sex (vaginal, anal, or oral) (%)
Sexual Behavior - Males 18+ that ever had vaginal sex with a woman (%)
Sexual Behavior - Males 18+ that ever performed oral sex on a woman (%)
Sexual Behavior - Males 18+ that ever had anal sex with a woman (%)
Sexual Behavior - Males 18+ that ever had any sex with a man (%)
Sexual Behavior - Females 18+ that ever had vaginal sex with a man (%)
Sexual Behavior - Females 18+ that ever performed oral sex on a man (%)
Sexual Behavior - Females 18+ that ever had anal sex with a man (%)
Sexual Behavior - Females 18+ that ever had any kind of sex with a woman (%)
Sexual Behavior - Average age people first had sex
Sexual Behavior - Average number of female sex partners in lifetime (males 18+)
Sexual Behavior - Average number of female vaginal sex partners in lifetime (males 18+)
Sexual Behavior - Average age people first performed oral sex on a woman (18+)
Sexual Behavior - Average number of woman performed oral sex on in lifetime (18+)
Sexual Behavior - Average number of male sex partners in lifetime (males 18+)
Sexual Behavior - Average number of male anal sex partners in lifetime (males 18+)
Sexual Behavior - Average age people first performed oral sex on a man (18+)
Sexual Behavior - Average number of male oral sex partners in lifetime (18+)
Sexual Behavior - People using protection when performing oral sex (%)
Sexual Behavior - Average number of times people have vaginal or anal sex a year
Sexual Behavior - People having sex without condom (%)
Sexual Behavior - Average number of male sex partners in lifetime (females 18+)
Sexual Behavior - Average number of male vaginal sex partners in lifetime (females 18+)
Sexual Behavior - Average number of female sex partners in lifetime (females 18+)
Sexual Behavior - Circumcised males 18+ (%)
Sleep Disorders - Average hours sleeping at night
Sleep Disorders - People that has trouble sleeping (%)
Smoking-Cigarette Use - People smoking cigarettes (%)
Taste & Smell - People 40+ having problems with smell (%)
Taste & Smell - People 40+ having problems with taste (%)
Taste & Smell - People 40+ that ever had wisdom teeth removed (%)
Taste & Smell - People 40+ that ever had tonsils teeth removed (%)
Taste & Smell - People 40+ that ever had a loss of consciousness because of a head injury (%)
Taste & Smell - People 40+ that ever had a broken nose or other serious injury to face or skull (%)
Taste & Smell - People 40+ that ever had two or more sinus infections (%)
Weight - Average height (inches)
Weight - Average weight (pounds)
Weight - Average BMI
Weight - People that are obese (%)
Weight - People that ever were obese (%)
Weight - People trying to lose weight (%)
46,045 73.1% Hispanic 12,515 19.9% White alone 2,037 3.2% Asian alone 1,873 3.0% Two or more races 290 0.5% American Indian alone 255 0.4% Black alone 181 0.3% Native Hawaiian and Other 144 0.2% Other race alone
The City-Data.com crime index weighs serious crimes and violent crimes more heavily. Higher means more crime, U.S. average is 246.1. It adjusts for the number of visitors and daily workers commuting into cities.
- means the value is smaller than the state average.
- means the value is about the same as the state average.
- means the value is bigger than the state average.
- means the value is much bigger than the state average.
Crime rate in Porterville detailed stats: murders, rapes, robberies, assaults, burglaries, thefts, arson Officers per 1,000 residents here:
1.08California average:
2.30
Latest news from Porterville, CA collected exclusively by city-data.com from local newspapers, TV, and radio stations
Ancestries: American (3.1%), Irish (1.5%), German (1.5%), English (1.2%).
Current Local Time:
Land area: 14.0 square miles.
Population density: 4,498 people per square mile (average).
16,572 residents are foreign born (23.7% Latin America ).
This city:
26.3%California:
26.5%
Median real estate property taxes paid for housing units with mortgages in 2022: $1,798 (0.6%)Median real estate property taxes paid for housing units with no mortgage in 2022: $1,518 (0.6%)
Nearest city with pop. 50,000+: Visalia, CA
Nearest city with pop. 200,000+: Bakersfield, CA
Nearest city with pop. 1,000,000+: Los Angeles, CA
Nearest cities:
El Rancho, CA (3.3 miles)
Latitude: 36.07 N, Longitude: 119.03 W
Daytime population change due to commuting: -3,224 (-5.1%)Workers who live and work in this city: 12,729 (49.8%)
Single-family new house construction building permits:
2022: 69 buildings , average cost: $328,1002021: 147 buildings , average cost: $305,6002020: 112 buildings , average cost: $294,0002019: 104 buildings , average cost: $283,4002018: 74 buildings , average cost: $270,7002017: 47 buildings , average cost: $273,9002016: 43 buildings , average cost: $267,5002015: 58 buildings , average cost: $224,6002014: 32 buildings , average cost: $199,0002013: 36 buildings , average cost: $226,2002012: 32 buildings , average cost: $238,6002011: 50 buildings , average cost: $197,3002010: 57 buildings , average cost: $197,5002009: 119 buildings , average cost: $199,2002008: 98 buildings , average cost: $181,3002007: 176 buildings , average cost: $189,3002006: 161 buildings , average cost: $172,9002005: 257 buildings , average cost: $116,9002004: 252 buildings , average cost: $92,4002003: 225 buildings , average cost: $103,1002002: 278 buildings , average cost: $98,3002001: 215 buildings , average cost: $92,7002000: 196 buildings , average cost: $85,8001999: 172 buildings , average cost: $83,9001998: 220 buildings , average cost: $73,7001997: 207 buildings , average cost: $74,900Unemployment in December 2023: Here:
15.6%California:
5.1%
Most common occupations in Porterville, CA (%)
Both Males Females
Agricultural workers, including supervisors (10.6%)
Preschool, kindergarten, elementary, and middle school teachers (4.4%)
Other office and administrative support workers, including supervisors (4.2%)
Health technologists and technicians (3.3%)
Building and grounds cleaning and maintenance occupations (3.3%)
Other production occupations, including supervisors (3.2%)
Driver/sales workers and truck drivers (3.0%)
Agricultural workers, including supervisors (14.0%)
Driver/sales workers and truck drivers (5.3%)
Electrical equipment mechanics and other installation, maintenance, and repair workers, including supervisors (4.6%)
Building and grounds cleaning and maintenance occupations (4.4%)
Law enforcement workers, including supervisors (3.6%)
Vehicle and mobile equipment mechanics, installers, and repairers (3.4%)
Other production occupations, including supervisors (3.4%)
Other office and administrative support workers, including supervisors (7.0%)
Agricultural workers, including supervisors (6.9%)
Preschool, kindergarten, elementary, and middle school teachers (6.1%)
Secretaries and administrative assistants (5.0%)
Health technologists and technicians (4.9%)
Information and record clerks, except customer service representatives (4.8%)
Cashiers (3.7%)
Earthquake activity:
Porterville-area historical earthquake activity is significantly above California state average. It is 8482% greater than the overall U.S. average. On 7/21/1952 at 11:52:14, a magnitude 7.7 (7.7 UK, Class: Major, Intensity: VIII - XII) earthquake occurred 73.9 miles away from Porterville center, causing $50,000,000 total damage On 11/4/1927 at 13:51:53, a magnitude 7.5 (7.5 UK) earthquake occurred 138.2 miles away from the city center On 4/18/1906 at 13:12:21, a magnitude 7.9 (7.9 UK) earthquake occurred 256.8 miles away from the city center, causing $524,000,000 total damage On 6/28/1992 at 11:57:34, a magnitude 7.6 (6.2 MB, 7.6 MS, 7.3 MW, Depth: 0.7 mi) earthquake occurred 192.1 miles away from Porterville center, causing 3 deaths ( 1 shaking deaths, 2 other deaths) and 400 injuries, causing $100,000,000 total damage and $40,000,000 insured lossesOn 10/16/1999 at 09:46:44, a magnitude 7.4 (6.3 MB, 7.4 MS, 7.2 MW, 7.3 ML) earthquake occurred 181.6 miles away from the city center On 12/21/1932 at 06:10:09, a magnitude 7.2 (7.2 UK) earthquake occurred 176.7 miles away from the city center Magnitude types: body-wave magnitude (MB), local magnitude (ML), surface-wave magnitude (MS), moment magnitude (MW) Natural disasters: The number of natural disasters in Tulare County (14) is near the US average (15).Major Disasters (Presidential) Declared: 10Emergencies Declared: 2Floods: 8, Storms: 5, Winter Storms: 4, Freezes: 2, Landslides: 2, Drought: 1, Fire: 1, Hurricane: 1, Mudslide: 1, Other: 1 (Note: some incidents may be assigned to more than one category). Main business address for: SIERRA BANCORP NATIONAL COMMERCIAL BANKS ).
Hospitals in Porterville: EVELYN'S FAMILY HOME (332 NORTH INDIANA STREET) GAITHER'S FAMILY HOME 5 (1441 SAN LUCIA AVENUE) GOOD SHEPHERD LUTHERAN BELMONT (1030 NORTH BELMONT) PORTERVILLE DEVELOPMENTAL CENTER (Government - State, 26501 AVENUE 140) SIERRA VIEW DISTRICT HOSPITAL (Voluntary non-profit - Private, 465 W PUTNAM AVE) Nursing Homes in Porterville: PORTERVILLE CONVALESCENT HOSP (1100 WEST MORTON AVENUE) PORTERVILLE DC (26501 AVENUE 140) SIERRA VALLEY REHAB CENTER (301 WEST PUTNAM) SUN VILLA (350 NORTH VILLA STREET) VALLEY CARE CENTER (661 W. POPLAR) Dialysis Facilities in Porterville: PORTERVILLE HEMODIALYSIS FACILITY (385 N. PEARSON DRIVE) SIERRA VIEW DISTRICT HOSPITAL DIALYSIS CENTER (283 N. PEARSON DRIVE) Airports located in Porterville:
College/University in Porterville: Porterville College Full-time enrollment: 2,560; Location: 100 E College Ave; Public; Website: www.portervillecollege.edu)
Other colleges/universities with over 2000 students near Porterville:
College of the Sequoias (about 24 miles; Visalia, CA ; Full-time enrollment: 6,982)
San Joaquin Valley College-Visalia (about 27 miles; Visalia, CA ; FT enrollment: 2,386)
Reedley College (about 45 miles; Reedley, CA ; FT enrollment: 8,144)
Bakersfield College (about 46 miles; Bakersfield, CA ; FT enrollment: 10,325)
West Hills College-Lemoore (about 48 miles; Lemoore, CA ; FT enrollment: 2,314)
California State University-Bakersfield (about 50 miles; Bakersfield, CA ; FT enrollment: 7,564)
Fresno Pacific University (about 61 miles; Fresno, CA ; FT enrollment: 3,083)
Biggest public high schools in Porterville: MONACHE HIGH Students: 1,374, Location: 960 N. NEWCOMB ST., Grades: 9-12)PORTERVILLE HIGH Students: 1,261, Location: 465 W. OLIVE AVE., Grades: 9-12)GRANITE HILLS HIGH Students: 834, Location: 1701 E. PUTNAM AVE., Grades: 9-12)SUMMIT CHARTER ACADEMY Students: 564, Location: 175 S. MATHEW ST., Grades: KG-12, Charter school )BUTTERFIELD CHARTER HIGH Students: 69, Location: 600 W. GRAND AVE., Grades: 9-12, Charter school )PROSPECT EDUCATION CENTER Students: 66, Location: 645 N. PROSPECT ST., Grades: KG-12)CITRUS HIGH Students: 51, Location: 261 E. MULBERRY AVE., Grades: 9-12)VINE STREET COMMUNITY DAY Students: 14, Location: 140 S. C ST., Grades: 7-12)TULARE COUNTY ORGANIZATION FOR VOCATIONAL EDUCATIO Location: 600 W. GRAND AVE., Grades: 10-12)BURTON PATHWAYS CHARTER ACADEMY Location: 1414 W. OLIVE AVE., Grades: KG-12, Charter school )
Private high school in Porterville: PORTERVILLE APOSTOLIC CHRISTIAN ACADEMY Students: 11, Location: 448 N E ST, Grades: 2-11)
Biggest public elementary/middle schools in Porterville: JIM MAPLES ACADEMY Students: 590, Location: 252 N. W.WOOD, Grades: 5-6)BURTON MIDDLE Students: 583, Location: 1155 N. ELDERWOOD ST., Grades: 7-8)VANDALIA ELEMENTARY Students: 462, Location: 271 E. COLLEGE AVE., Grades: KG-5)BARTLETT MIDDLE Students: 451, Location: 335 N. G ST., Grades: 7-8)WESTFIELD ELEMENTARY Students: 444, Location: 1151 W. PIONEER AVE., Grades: KG-6)JOHN J. DOYLE ELEMENTARY Students: 436, Location: 1045 E. ORANGE AVE., Grades: KG-6)OLIVE STREET ELEMENTARY Students: 422, Location: 255 W. OLIVE AVE., Grades: KG-6)WOODVILLE ELEMENTARY Students: 408, Location: 16541 RD. 168, Grades: KG-8)BURTON ELEMENTARY Students: 347, Location: 2375 W. MORTON ST., Grades: KG-4)PLEASANT VIEW ELEMENTARY Students: 340, Location: 14004 RD. 184, Grades: KG-8)Private elementary/middle school in Porterville: ST ANNE SCHOOL Students: 175, Location: 385 N F ST, Grades: KG-8)
See full list of schools located in Porterville Library in Porterville: PORTERVILLE PUBLIC LIBRARY Operating income: $888,031; Location: 41 WEST THURMAN AVENUE; 73,541 books ; 280 e-books ; 4,283 audio materials ; 4,497 video materials ; 4 other licensed databases ; 96 print serial subscriptions ; 985 electronic serial subscriptions )
Notable locations in Porterville: (A) , Porterville Water Works (B) , Veterans Monument (C) , Spinners Airport Raceway (D) , Porterville Municipal Golf Course (E) , Farrington Memorial (F) , Camp Vandalia (G) , Imperial Ambulance (H) , Porterville Fire Department Station 2 (I) , Porterville Fire Department Station 1 Headquarters (J) , Porterville Womans Club (K) , Porterville Public Library (L) , Veterans Memorial Hall (M) , Sierra View District Hospital Medical Library (N) , Porterville Community Center (O) , Porterville College Library (P) , Memorial Auditorium (Q) , Porterville City Hall (R) . Display/hide their locations on the map
Shopping Centers: (1) , Smiths Town Square Shopping Center (2) , Porterville West Shopping Center (3) , Porter Plaza Shopping Center (4) , Monache Financial Center Shopping Center (5) , Eastridge Plaza Shopping Center (6) . Display/hide their locations on the map
Main business address in Porterville: (A) . Display/hide its location on the map
Churches in Porterville include: (A) , Church of God (B) , Emanuel Evangelical Church (C) , Faith Tabernacle of Porterville (D) , First Baptist Church (E) , First Church of Christ Scientist (F) , First Congregational Church (G) , First Lutheran Church (H) , Grace Fundamental Church (I) . Display/hide their locations on the map
Reservoir: (A) . Display/hide its location on the map
Parks in Porterville include: (1) , Hayes Field (2) , J Claude Nelson Park (3) , Jamison Stadium (4) , North Park (5) , Olivewood Mini Park (6) , Orange Street Mini Park (7) , Porterville Fairgrounds (8) , Veterans Park (9) . Display/hide their locations on the map
Hotels: (1) , Best Western Porterville Inn (350 West Montgomery Avenue) (2) . Display/hide their approximate locations on the map
Courts: (1) , Social Security Administration - Office (890 West Morton Avenue) (2) . Display/hide their approximate locations on the map
Birthplace of: Ian Fuller - Soccer player, James Sanders - 2005 NFL player (New England Patriots, born : Nov 11, 1983), Joe Soto - Martial artist, William I. Traeger - Politician, Angelo Brovelli - Early professional football player, Barbara Baxley - Actor, Buzz Stephen - Baseball player, Dick Brooks - Racing driver, Eddie Gutierrez - Soccer player, Jim Weatherwax - Football player.
Tulare County has a predicted average indoor radon screening level between 2 and 4 pCi/L (pico curies per liter) - Moderate Potential Drinking water stations with addresses in Porterville and their reported violations in the past:
USDA-FOREST SERVICE HUME LAKE CAMPGROUND (Population served: 500, Purch surface water):
Past monitoring violations:
One routine major monitoring violation
3 regular monitoring violations
Population served: 200, Groundwater):
Past health violations:
MCL, Monthly (TCR) - Between JAN-2011 and MAR-2011, Contaminant: Coliform. Follow-up actions: St Violation/Reminder Notice (APR-10-2011), St Compliance achieved (OCT-10-2011)
Past monitoring violations:
Monitoring, Repeat Major (TCR) - Between OCT-2010 and DEC-2010, Contaminant: Coliform (TCR). Follow-up actions: St Violation/Reminder Notice (JAN-10-2011), St Compliance achieved (OCT-10-2011)
5 routine major monitoring violations
2 regular monitoring violations
Population served: 200, Groundwater):
Past health violations:
MCL, Acute (TCR) - Between OCT-2009 and DEC-2009, Contaminant: Coliform. Follow-up actions: St Boil Water Order (JAN-10-2010), St Compliance achieved (OCT-10-2010)
Past monitoring violations:
5 routine major monitoring violations
One regular monitoring violation
Population served: 160, Groundwater):
Past health violations:
MCL, Monthly (TCR) - In NOV-2009, Contaminant: Coliform. Follow-up actions: St AO (w/o penalty) issued (JUN-30-2010)
MCL, Monthly (TCR) - In JUL-2009, Contaminant: Coliform. Follow-up actions: St AO (w/o penalty) issued (JUN-30-2010)
Past monitoring violations:
One routine major monitoring violation
2 minor monitoring violations
Population served: 155, Groundwater):
Past health violations:
MCL, Monthly (TCR) - In JUL-2013, Contaminant: Coliform. Follow-up actions: St AO (w/o penalty) issued (AUG-10-2013)
MCL, Acute (TCR) - Between APR-2010 and JUN-2010, Contaminant: Coliform. Follow-up actions: St Boil Water Order (JUL-10-2010), St Compliance achieved (OCT-10-2010)
Past monitoring violations:
One routine major monitoring violation
One regular monitoring violation
Population served: 150, Groundwater):
Past health violations:
MCL, Monthly (TCR) - In AUG-2013, Contaminant: Coliform. Follow-up actions: St AO (w/o penalty) issued (SEP-10-2013)
MCL, Monthly (TCR) - In AUG-2012, Contaminant: Coliform. Follow-up actions: St AO (w/penalty) issued (OCT-10-2012)
MCL, Average - Between JAN-2012 and DEC-2012, Contaminant: Nitrate. Follow-up actions: St AO (w/o penalty) issued (OCT-03-2012)
MCL, Monthly (TCR) - Between JUL-2008 and SEP-2008, Contaminant: Coliform
MCL, Monthly (TCR) - Between JUL-2008 and SEP-2008, Contaminant: Coliform. Follow-up actions: St Violation/Reminder Notice (OCT-10-2008)
Past monitoring violations:
3 regular monitoring violations
Population served: 140, Groundwater):
Past health violations:
MCL, Average - Between JAN-2014 and MAR-2014, Contaminant: Nitrate. Follow-up actions: St Violation/Reminder Notice (APR-10-2014)
MCL, Average - Between OCT-2013 and DEC-2013, Contaminant: Nitrate. Follow-up actions: St Violation/Reminder Notice (JAN-10-2014)
MCL, Monthly (TCR) - In NOV-2012, Contaminant: Coliform. Follow-up actions: St AO (w/penalty) issued (DEC-10-2012)
MCL, Monthly (TCR) - In JUL-2012, Contaminant: Coliform. Follow-up actions: St AO (w/penalty) issued (OCT-10-2012)
MCL, Monthly (TCR) - Between APR-2012 and JUN-2012, Contaminant: Coliform. Follow-up actions: St Violation/Reminder Notice (JUL-10-2012)
MCL, Monthly (TCR) - Between JUL-2011 and SEP-2011, Contaminant: Coliform. Follow-up actions: St Violation/Reminder Notice (OCT-10-2011), St Compliance achieved (JAN-10-2012)
6 other older health violations
Past monitoring violations:
33 routine major monitoring violations
4 regular monitoring violations
Population served: 125, Groundwater):
Past health violations:
MCL, Monthly (TCR) - In SEP-2013, Contaminant: Coliform. Follow-up actions: St AO (w/penalty) issued (OCT-10-2013)
MCL, Monthly (TCR) - In JUL-2013, Contaminant: Coliform. Follow-up actions: St AO (w/penalty) issued (AUG-10-2013)
MCL, Monthly (TCR) - In AUG-2012, Contaminant: Coliform. Follow-up actions: St AO (w/penalty) issued (OCT-10-2012)
MCL, Acute (TCR) - Between JUL-2011 and SEP-2011, Contaminant: Coliform. Follow-up actions: St Boil Water Order (JUL-25-2011), St Compliance achieved (JAN-10-2012)
MCL, Monthly (TCR) - Between JUL-2009 and SEP-2009, Contaminant: Coliform. Follow-up actions: St Violation/Reminder Notice (OCT-10-2009), St Compliance achieved (SEP-10-2010)
MCL, Monthly (TCR) - Between JUL-2008 and SEP-2008, Contaminant: Coliform. Follow-up actions: St Violation/Reminder Notice (OCT-10-2008), St Compliance achieved (SEP-10-2010)
3 other older health violations
Past monitoring violations:
3 regular monitoring violations
Drinking water stations with addresses in Porterville that have no violations reported:
USFS - OLD ISABELLA AUXILIARY DAM WS (Population served: 1,820, Primary Water Source Type: Groundwater)
USDA-FOREST SERVICE PRINCESS CAMPGROUND (Population served: 550, Primary Water Source Type: Groundwater)
USFS - SANDY FLAT CAMPGROUND WS (Population served: 204, Primary Water Source Type: Groundwater)
USFS-TROY MEADOW CAMPGROUND (Population served: 146, Primary Water Source Type: Groundwater)
USFS-FISH CREEK CAMPGROUND (Population served: 80, Primary Water Source Type: Groundwater)
USFS-HORSE MEADOW CAMPGROUND (Population served: 80, Primary Water Source Type: Groundwater)
USFS-KENNEDY CAMPGROUND (Population served: 78, Primary Water Source Type: Groundwater)
USFS-BLACKROCK STATION (Population served: 32, Primary Water Source Type: Groundwater)
USFS-BLACKROCK TRAILHEAD (Population served: 30, Primary Water Source Type: Groundwater)
TCOVE (Population served: 26, Primary Water Source Type: Groundwater)
Average household size: This city:
3.4 peopleCalifornia:
2.9 people
Percentage of family households: This city:
78.7%Whole state:
68.7%
Percentage of households with unmarried partners: This city:
9.8%Whole state:
7.2%
Likely homosexual households (counted as self-reported same-sex unmarried-partner households)
Lesbian couples: 0.4% of all households Gay men: 0.3% of all households
People in group quarters in Porterville in 2010:
931 people in nursing facilities/skilled-nursing facilities
90 people in group homes intended for adults
63 people in other noninstitutional facilities
35 people in emergency and transitional shelters (with sleeping facilities) for people experiencing homelessness
11 people in residential treatment centers for adults
8 people in workers' group living quarters and job corps centers
6 people in residential schools for people with disabilities
3 people in group homes for juveniles (non-correctional)
People in group quarters in Porterville in 2000:
765 people in orthopedic wards and institutions for the physically handicapped
276 people in nursing homes
176 people in other noninstitutional group quarters
132 people in other group homes
77 people in mental (psychiatric) hospitals or wards
74 people in homes for the mentally retarded
54 people in homes or halfway houses for drug/alcohol abuse
49 people in job corps and vocational training facilities
19 people in homes for the mentally ill
5 people in unknown juvenile institutions
5 people in other nonhousehold living situations
Banks with branches in Porterville (2011 data):
Bank of the Sierra: Bank Of The Sierra, Www.Bankofthesierra.com Branch, West Olive Branch. Info updated 2006/11/03: Bank assets: $1,332.3 mil, Deposits: $1,091.7 mil, local headquarters , positive income , Commercial Lending Specialization, 26 total offices , Holding Company: Sierra Bancorp
Finance and Thrift Company: Porterville Branch at 268 N. Main Street, branch established on 2001/08/16; Finance And Thrift Company at 268 North Main Street, branch established on 1925/07/09. Info updated 2010/02/16: Bank assets: $129.7 mil, Deposits: $98.5 mil, local headquarters , positive income , Consumer Lending Specialization, 9 total offices
Union Bank, National Association: Porterville -cash And Save Branch at 229 North Main Street, branch established on 1871/01/01; Porter And Henderson Instore Branch at 900 West Henderson Avenue, branch established on 1998/03/12. Info updated 2011/09/01: Bank assets: $88,967.5 mil, Deposits: $65,286.4 mil, headquarters in San Francisco, CA, positive income , Commercial Lending Specialization, 403 total offices , Holding Company: Mitsubishi Ufj Financial Group, Inc.
Citibank, National Association: 185 North D Street Branch at 185 North D Street, branch established on 1945/01/01. Info updated 2012/01/10: Bank assets: $1,288,658.0 mil, Deposits: $882,541.0 mil, headquarters in Sioux Falls, SD, positive income , International Specialization, 1048 total offices , Holding Company: Citigroup Inc.
Bank of America, National Association: Porterville Branch at 345 North Main Street, branch established on 1934/12/23. Info updated 2009/11/18: Bank assets: $1,451,969.3 mil, Deposits: $1,077,176.8 mil, headquarters in Charlotte, NC, positive income , 5782 total offices , Holding Company: Bank Of America Corporation
Wells Fargo Bank, National Association: Porterville Branch at 815 West Henderson Avenue, branch established on 1967/12/15. Info updated 2011/04/05: Bank assets: $1,161,490.0 mil, Deposits: $905,653.0 mil, headquarters in Sioux Falls, SD, positive income , 6395 total offices , Holding Company: Wells Fargo & Company
Suncrest Bank: Porterville Branch at 65 West Olive Avenue, branch established on 2008/08/04. Info updated 2008/05/19: Bank assets: $91.2 mil, Deposits: $78.0 mil, headquarters in Visalia, CA, negative income in the last year , Commercial Lending Specialization, 2 total offices
Citizens Business Bank: Porterville Branch at 334 North Main Street, branch established on 1998/10/26. Info updated 2011/03/30: Bank assets: $6,475.4 mil, Deposits: $4,625.6 mil, headquarters in Ontario, CA, positive income , Commercial Lending Specialization, 46 total offices , Holding Company: Cvb Financial Corp.
For population 15 years and over in Porterville:
Never married: 41.9%Now married: 43.0%Separated: 1.6%Widowed: 4.9%Divorced: 8.7% For population 25 years and over in Porterville:
High school or higher: 69.3%Bachelor's degree or higher: 13.7%Graduate or professional degree: 4.4%Unemployed: 12.3%Mean travel time to work (commute): 24.7 minutes
Education Gini index (Inequality in education) Here:
18.5California average:
15.5
Religion statistics for Porterville, CA (based on Tulare County data)
Religion Adherents Congregations Catholic 102,772 26 Evangelical Protestant 53,285 300 Other 13,983 37 Mainline Protestant 8,690 37 Black Protestant 757 5 Orthodox 650 2 None 262,042 -
Source: Clifford Grammich, Kirk Hadaway, Richard Houseal, Dale E.Jones, Alexei Krindatch, Richie Stanley and Richard H.Taylor. 2012. 2010 U.S.Religion Census: Religious Congregations & Membership Study. Association of Statisticians of American Religious Bodies. Jones, Dale E., et al. 2002. Congregations and Membership in the United States 2000. Nashville, TN: Glenmary Research Center. Graphs represent county-level data
Food Environment Statistics: Number of grocery stores : 119Tulare County :
2.84 / 10,000 pop.California :
2.14 / 10,000 pop.
Number of supercenters and club stores : 3Tulare County :
0.07 / 10,000 pop.California :
0.04 / 10,000 pop.
Number of convenience stores (no gas) : 32This county :
0.76 / 10,000 pop.California :
0.62 / 10,000 pop.
Number of convenience stores (with gas) : 89Here :
2.12 / 10,000 pop.State :
1.49 / 10,000 pop.
Number of full-service restaurants : 215This county :
5.13 / 10,000 pop.State :
7.42 / 10,000 pop.
Adult diabetes rate : Tulare County :
7.3%State :
7.3%
Adult obesity rate : This county :
28.2%State :
21.3%
Low-income preschool obesity rate : Tulare County :
16.9%California :
17.9%
Health and Nutrition: Healthy diet rate : Porterville:
46.7%State:
49.4%
Average overall health of teeth and gums : This city:
45.1%California:
48.0%
Average BMI : Porterville:
28.5California:
28.1
People feeling badly about themselves : Here:
22.9%California:
20.2%
People not drinking alcohol at all : Porterville:
11.3%California:
11.2%
Average hours sleeping at night : Porterville:
6.8California:
6.8
Overweight people : Here:
32.0%California:
31.5%
General health condition : This city:
53.9%State:
56.4%
Average condition of hearing : Porterville:
80.4%California:
80.9%
More about Health and Nutrition of Porterville, CA Residents
Local government employment and payroll (March 2022)
Function
Full-time employees
Monthly full-time payroll
Average yearly full-time wage
Part-time employees
Monthly part-time payroll
Police Protection - Officers
63 $513,196 $97,752 4 $228 Parks and Recreation
27 $118,169 $52,520 20 $25,911 Other and Unallocable
25 $145,330 $69,758 0 $0 Police - Other
25 $119,356 $57,291 3 $2,432 Firefighters
25 $141,716 $68,024 17 $29,986 Solid Waste Management
20 $91,220 $54,732 0 $0 Water Supply
18 $92,708 $61,805 0 $0 Financial Administration
18 $85,767 $57,178 1 $3,891 Other Government Administration
11 $75,001 $81,819 0 $0 Housing and Community Development (Local)
10 $63,383 $76,060 0 $0 Streets and Highways
9 $74,261 $99,015 0 $0 Local Libraries
8 $31,700 $47,550 5 $5,775 Sewerage
7 $33,725 $57,814 0 $0 Health
7 $37,206 $63,782 0 $0 Fire - Other
3 $15,032 $60,128 2 $3,492 Airports
3 $11,228 $44,912 0 $0
Totals for Government
279 $1,648,998 $70,925 52 $71,714
Porterville government finances - Expenditure in 2017 (per resident):
Construction - Regular Highways: $2,743,000 ($43.54)
Water Utilities: $2,660,000 ($42.22)Solid Waste Management: $893,000 ($14.18)Parks and Recreation: $700,000 ($11.11)Sewerage: $598,000 ($9.49)Local Fire Protection: $529,000 ($8.40)Central Staff Services: $485,000 ($7.70)Air Transportation: $274,000 ($4.35)General - Other: $110,000 ($1.75)Transit Utilities: $103,000 ($1.63)Housing and Community Development: $24,000 ($0.38)Current Operations - Police Protection: $11,905,000 ($188.97)
Transit Utilities: $7,591,000 ($120.50)Water Utilities: $5,785,000 ($91.83)Parks and Recreation: $5,111,000 ($81.13)Solid Waste Management: $5,002,000 ($79.40)Sewerage: $3,810,000 ($60.48)Local Fire Protection: $3,619,000 ($57.45)Central Staff Services: $3,379,000 ($53.64)Protective Inspection and Regulation - Other: $1,702,000 ($27.02)Financial Administration: $1,604,000 ($25.46)Regular Highways: $1,506,000 ($23.91)Air Transportation: $1,475,000 ($23.41)Libraries: $1,239,000 ($19.67)Housing and Community Development: $285,000 ($4.52)Health - Other: $114,000 ($1.81)General - Interest on Debt: $3,464,000 ($54.99)
Intergovernmental to Local - Other - Solid Waste Management: $972,000 ($15.43)
Other Capital Outlay - Sewerage: $2,114,000 ($33.56)
General - Other: $1,700,000 ($26.98)Water Utilities: $1,477,000 ($23.45)General Public Building: $329,000 ($5.22)Police Protection: $98,000 ($1.56)Transit Utilities: $77,000 ($1.22)Central Staff Services: $51,000 ($0.81)Protective Inspection and Regulation - Other: $47,000 ($0.75)Financial Administration: $28,000 ($0.44)Air Transportation: $25,000 ($0.40)Total Salaries and Wages: $79,000 ($1.25)
Water Utilities - Interest on Debt: $370,000 ($5.87)
Porterville government finances - Revenue in 2017 (per resident):
Charges - Sewerage: $8,527,000 ($135.35)
Solid Waste Management: $5,902,000 ($93.69)Other: $5,052,000 ($80.19)Parks and Recreation: $2,444,000 ($38.79)Air Transportation: $1,831,000 ($29.06)Federal Intergovernmental - Other: $3,498,000 ($55.53)
Transit Utilities: $2,280,000 ($36.19)Housing and Community Development: $595,000 ($9.44)Air Transportation: $47,000 ($0.75)Local Intergovernmental - Transit Utilities: $1,594,000 ($25.30)
Miscellaneous - Special Assessments: $1,211,000 ($19.22)
General Revenue - Other: $821,000 ($13.03)Interest Earnings: $556,000 ($8.83)Rents: $293,000 ($4.65)Fines and Forfeits: $241,000 ($3.83)Donations From Private Sources: $231,000 ($3.67)Revenue - Water Utilities: $10,810,000 ($171.59)
Transit Utilities: $1,281,000 ($20.33)State Intergovernmental - Transit Utilities: $2,349,000 ($37.29)
Other: $2,124,000 ($33.72)Highways: $1,121,000 ($17.79)Water Utilities: $902,000 ($14.32)General Local Government Support: $25,000 ($0.40)Tax - General Sales and Gross Receipts: $9,289,000 ($147.45)
Property: $6,505,000 ($103.26)Public Utilities Sales: $4,476,000 ($71.05)Other: $3,591,000 ($57.00)Other Selective Sales: $552,000 ($8.76)Other License: $530,000 ($8.41)Occupation and Business License - Other: $455,000 ($7.22)Documentary and Stock Transfer: $100,000 ($1.59)
Porterville government finances - Debt in 2017 (per resident):
Long Term Debt - Beginning Outstanding - Unspecified Public Purpose: $81,469,000 ($1293.20)
Outstanding Unspecified Public Purpose: $78,555,000 ($1246.94)Retired Unspecified Public Purpose: $2,915,000 ($46.27)
Porterville government finances - Cash and Securities in 2017 (per resident):
Bond Funds - Cash and Securities: $490,000 ($7.78)
Other Funds - Cash and Securities: $66,846,000 ($1061.08)
Sinking Funds - Cash and Securities: $1,008,000 ($16.00)
3.84% of this county's 2021 resident taxpayers lived in other counties in 2020 ($53,510 average adjusted gross income )
Here:
3.84%California average:
5.19%
0.01% of residents moved from foreign countries ($107 average AGI )Tulare County:
0.01%California average:
0.03%
Top counties from which taxpayers relocated into this county between 2020 and 2021:
3.70% of this county's 2020 resident taxpayers moved to other counties in 2021 ($58,158 average adjusted gross income )
Here:
3.70%California average:
6.14%
0.01% of residents moved to foreign countries ($170 average AGI )Tulare County:
0.01%California average:
0.02%
Top counties to which taxpayers relocated from this county between 2020 and 2021:
Businesses in Porterville, CA
Name Count Name Count
99 Cents Only Stores 1 Little Caesars Pizza 2 AT&T 2 Long John Silver's 1 Ace Hardware 1 Lowe's 1 AutoZone 2 MasterBrand Cabinets 2 Best Western 1 Maurices 1 Blockbuster 1 McDonald's 3 Burger King 2 Motel 6 1 CVS 4 Nike 1 Carl\s Jr. 1 OfficeMax 1 Chevrolet 1 Panda Express 1 Cricket Wireless 3 Payless 2 Dennys 2 Penske 1 Domino's Pizza 1 Pizza Hut 2 FedEx 6 Quiznos 1 Ford 1 RadioShack 1 GNC 1 Rite Aid 1 GameStop 1 Sears 1 Goodwill 2 Starbucks 4 H&R Block 2 Subway 4 Holiday Inn 1 T-Mobile 2 Home Depot 1 Taco Bell 2 Jack In The Box 2 Target 1 Jamba Juice 1 The Room Place 1 Jones New York 1 U-Haul 3 KFC 1 UPS 3 Kohl's 1 Walmart 1 La-Z-Boy 2 Wendy's 1 Lane Furniture 2
Strongest AM radio stations in Porterville:
KTIP (1450 AM; 1 kW; PORTERVILLE, CA; Owner: CALDWELL BROADCASTING CO., INC.)
KWRU (940 AM; 50 kW; FRESNO, CA)
KMJ (580 AM; 50 kW; FRESNO, CA; Owner: INFINITY RADIO OPERATIONS INC.)
KERI (1180 AM; 50 kW; WASCO-GREENACRES, CA; Owner: KWSO, INC.)
KJUG (1270 AM; 5 kW; TULARE, CA; Owner: WESTCOAST BROADCASTING, INC.)
KCHJ (1010 AM; 5 kW; DELANO, CA; Owner: ILLINOIS LOTUS CORP.)
KNZR (1560 AM; 25 kW; BAKERSFIELD, CA; Owner: BUCKLEY BROADCASTING CORP. OF CALIF.)
KGDP (660 AM; 50 kW; ORCUTT, CA; Owner: RADIO REPRESENTATIVES, INC.)
KRDU (1130 AM; 6 kW; DINUBA, CA; Owner: CAPSTAR TX LIMITED PARTNERSHIP)
KIRN (670 AM; 35 kW; SIMI VALLEY, CA; Owner: LOTUS OXNARD CORP.)
KLAC (570 AM; 50 kW; LOS ANGELES, CA; Owner: AMFM RADIO LICENSES, L.L.C.)
KSPN (710 AM; 50 kW; LOS ANGELES, CA; Owner: KABC-AM RADIO, INC.)
KUZZ (550 AM; 5 kW; BAKERSFIELD, CA; Owner: OWENS ONE COMPANY)
Strongest FM radio stations in Porterville:
KMQA (100.5 FM; EAST PORTERVILLE, CA; Owner: MOON BROADCASTING PORTERVILLE L.L.C.)
KIOO (99.7 FM; PORTERVILLE, CA; Owner: BUCKLEY B/CSTNG CORP OF SAN JOA VAL)
KZPO (103.3 FM; LINDSAY, CA; Owner: LINDSAY BROADCASTING)
KDUV (88.9 FM; VISALIA, CA; Owner: COMMUNITY EDUCATIONAL B/CASTNG, INC.)
KJUG-FM (106.7 FM; TULARE, CA; Owner: WESTCOAST BROADCASTING, INC.)
K220EY (91.9 FM; PORTERVILLE, CA; Owner: FAMILY STATIONS, INC.)
KUFW (90.5 FM; WOODLAKE, CA; Owner: NATIONAL FARM WORKERS SERVICE CENTER)
K266AH (101.1 FM; BENA, CA; Owner: CALVARY CHAPEL OF TWIN FALLS, INC.)
KTQX (90.1 FM; BAKERSFIELD, CA; Owner: RADIO BILINGUE, INC.)
KCRZ (104.9 FM; TIPTON, CA; Owner: WESTCOAST BROADCASTING, INC.)
KMAK (100.3 FM; ORANGE COVE, CA; Owner: RICHARD B. SMITH)
KFRR (104.1 FM; WOODLAKE, CA; Owner: IONOSPHERE B/CASTING LTD PARTNERSHIP)
K203CM (88.5 FM; SANGER, CA; Owner: EDUCATIONAL MEDIA FOUNDATION)
KMYX-FM (92.5 FM; ARVIN, CA; Owner: FARMWORKER EDUC. RADIO NETWORK, INC.)
KFRB (91.3 FM; BAKERSFIELD, CA; Owner: FAMILY STATIONS, INC.)
KUZZ-FM (107.9 FM; BAKERSFIELD, CA; Owner: OWENS ONE COMPANY, INC)
KISV (94.1 FM; BAKERSFIELD, CA; Owner: AMERICAN GENERAL MEDIA CORP.)
KVLI-FM (104.5 FM; LAKE ISABELLA, CA; Owner: ROBERT J. AND KATHERINE M. BOHN)
KGFM (101.5 FM; BAKERSFIELD, CA; Owner: LAGNIAPPE BROADCASTING, INC.)
KCNQ (102.5 FM; KERNVILLE, CA; Owner: ROBERT J. & KATHERINE M. BOHN)
TV broadcast stations around Porterville:
KKAK-LP (Channel 20; PORTERVILLE, CA; Owner: GARY M. COCOLA FAMILY TRUST)
KTRO-LP (Channel 50; LANCASTER, CA; Owner: ROBERT D. ADELMAN)
KFAZ-CA (Channel 8; VISALIA, CA; Owner: GARY M. COCOLA FAMILY TRUST)
KTFF (Channel 61; PORTERVILLE, CA; Owner: TELEFUTURA FRESNO LLC)
KMCF-LP (Channel 35; VISALIA, CA; Owner: GARY M. COCOLA FAMILY TRUST, GARY M. COCOLA TRUSTEE)
KNXT (Channel 49; VISALIA, CA; Owner: DIOCESE OF FRESNO EDUCATION CORP.)
National Bridge Inventory (NBI) Statistics 66 Number of bridges745ft / 227m Total length $4,704,000 Total costs431,279 Total average daily traffic31,335 Total average daily truck traffic
New bridges - historical statistics
1 1920-1929 5 1930-1939 20 1940-1949 13 1950-1959 7 1960-1969 15 1970-1979 2 1990-1999 3 2000-2009
See full National Bridge Inventory statistics for Porterville, CA
Home Mortgage Disclosure Act Aggregated Statistics For Year 2009(Based on 5 full and 6 partial tracts) A) FHA, FSA/RHS & VA B) Conventional C) Refinancings D) Home Improvement Loans E) Loans on Dwellings For 5+ Families F) Non-occupant Loans on G) Loans On Manufactured Number Average Value Number Average Value Number Average Value Number Average Value Number Average Value Number Average Value Number Average Value
LOANS ORIGINATED 170 $138,108 63 $121,899 157 $132,961 11 $92,666 4 $740,938 40 $104,434 2 $27,955 APPLICATIONS APPROVED, NOT ACCEPTED 13 $144,788 10 $150,014 16 $189,261 4 $124,635 0 $0 2 $97,670 2 $88,120 APPLICATIONS DENIED 29 $129,523 16 $93,977 155 $149,685 37 $59,162 0 $0 18 $108,196 5 $75,986 APPLICATIONS WITHDRAWN 20 $122,962 16 $96,292 72 $146,132 10 $64,692 0 $0 12 $101,619 0 $0 FILES CLOSED FOR INCOMPLETENESS 1 $66,830 3 $87,177 32 $154,328 6 $39,335 1 $221,000 4 $128,930 0 $0
Aggregated Statistics For Year 2008(Based on 5 full and 6 partial tracts) A) FHA, FSA/RHS & VA B) Conventional C) Refinancings D) Home Improvement Loans E) Loans on Dwellings For 5+ Families F) Non-occupant Loans on G) Loans On Manufactured Number Average Value Number Average Value Number Average Value Number Average Value Number Average Value Number Average Value Number Average Value
LOANS ORIGINATED 103 $180,750 71 $185,316 258 $137,073 53 $71,666 1 $1,150,000 52 $116,712 3 $77,287 APPLICATIONS APPROVED, NOT ACCEPTED 15 $179,714 28 $180,659 84 $140,039 18 $66,454 0 $0 15 $131,593 5 $65,002 APPLICATIONS DENIED 20 $175,039 42 $151,295 406 $167,397 98 $88,947 1 $2,700,000 69 $143,999 7 $55,654 APPLICATIONS WITHDRAWN 25 $162,762 33 $158,980 98 $161,964 23 $107,890 1 $175,560 19 $142,719 3 $31,553 FILES CLOSED FOR INCOMPLETENESS 2 $210,405 6 $200,368 33 $163,049 7 $60,866 0 $0 6 $129,605 0 $0
Aggregated Statistics For Year 2007(Based on 5 full and 6 partial tracts) A) FHA, FSA/RHS & VA B) Conventional C) Refinancings D) Home Improvement Loans E) Loans on Dwellings For 5+ Families F) Non-occupant Loans on G) Loans On Manufactured Number Average Value Number Average Value Number Average Value Number Average Value Number Average Value Number Average Value Number Average Value
LOANS ORIGINATED 40 $152,717 282 $163,734 723 $153,278 127 $101,412 4 $2,915,715 147 $149,459 7 $88,064 APPLICATIONS APPROVED, NOT ACCEPTED 3 $193,830 57 $155,336 217 $158,854 33 $106,793 0 $0 31 $171,173 3 $58,327 APPLICATIONS DENIED 5 $186,426 177 $159,316 787 $179,207 155 $107,200 2 $625,000 117 $160,608 12 $82,862 APPLICATIONS WITHDRAWN 9 $150,243 54 $201,048 394 $165,065 57 $111,343 2 $650,000 47 $165,110 1 $37,020 FILES CLOSED FOR INCOMPLETENESS 1 $89,000 20 $195,274 137 $192,861 13 $109,118 0 $0 18 $165,522 2 $161,140
Aggregated Statistics For Year 2006(Based on 5 full and 6 partial tracts) A) FHA, FSA/RHS & VA B) Conventional C) Refinancings D) Home Improvement Loans E) Loans on Dwellings For 5+ Families F) Non-occupant Loans on G) Loans On Manufactured Number Average Value Number Average Value Number Average Value Number Average Value Number Average Value Number Average Value Number Average Value
LOANS ORIGINATED 37 $140,361 603 $135,796 1,198 $154,408 215 $99,500 2 $750,580 247 $153,386 9 $93,063 APPLICATIONS APPROVED, NOT ACCEPTED 6 $133,408 148 $118,470 241 $155,392 46 $89,746 0 $0 77 $134,991 4 $62,380 APPLICATIONS DENIED 4 $138,232 285 $148,157 793 $162,460 189 $90,701 0 $0 106 $159,427 14 $105,676 APPLICATIONS WITHDRAWN 3 $151,003 134 $139,122 722 $162,438 54 $118,993 0 $0 62 $137,430 3 $92,013 FILES CLOSED FOR INCOMPLETENESS 0 $0 37 $138,329 161 $166,898 13 $126,518 0 $0 11 $175,455 1 $39,780
Aggregated Statistics For Year 2005(Based on 6 full and 6 partial tracts) A) FHA, FSA/RHS & VA B) Conventional C) Refinancings D) Home Improvement Loans E) Loans on Dwellings For 5+ Families F) Non-occupant Loans on G) Loans On Manufactured Number Average Value Number Average Value Number Average Value Number Average Value Number Average Value Number Average Value Number Average Value
LOANS ORIGINATED 48 $116,295 768 $127,068 1,342 $133,116 190 $94,429 3 $1,249,870 301 $129,210 13 $64,868 APPLICATIONS APPROVED, NOT ACCEPTED 8 $85,778 158 $123,468 222 $122,401 43 $52,452 0 $0 55 $119,293 2 $73,740 APPLICATIONS DENIED 2 $148,135 235 $120,863 815 $126,299 161 $66,374 1 $113,380 115 $132,546 15 $83,485 APPLICATIONS WITHDRAWN 2 $162,505 165 $134,924 745 $132,011 105 $136,585 0 $0 72 $137,984 2 $75,845 FILES CLOSED FOR INCOMPLETENESS 0 $0 30 $115,117 132 $126,820 15 $95,075 0 $0 12 $117,742 0 $0
Aggregated Statistics For Year 2004(Based on 5 full and 6 partial tracts) A) FHA, FSA/RHS & VA B) Conventional C) Refinancings D) Home Improvement Loans E) Loans on Dwellings For 5+ Families F) Non-occupant Loans on G) Loans On Manufactured Number Average Value Number Average Value Number Average Value Number Average Value Number Average Value Number Average Value Number Average Value
LOANS ORIGINATED 142 $108,526 688 $96,746 971 $99,803 106 $59,516 7 $909,583 283 $97,484 9 $66,222 APPLICATIONS APPROVED, NOT ACCEPTED 12 $104,172 110 $103,489 249 $101,349 29 $51,249 0 $0 56 $105,927 7 $58,897 APPLICATIONS DENIED 12 $114,438 161 $108,257 786 $95,368 158 $53,058 2 $142,500 97 $97,794 11 $57,985 APPLICATIONS WITHDRAWN 15 $113,365 121 $99,804 618 $102,305 50 $61,511 0 $0 56 $95,096 5 $93,246 FILES CLOSED FOR INCOMPLETENESS 3 $107,407 11 $95,685 116 $104,502 6 $57,625 1 $300,000 11 $99,961 0 $0
Aggregated Statistics For Year 2003(Based on 5 full and 6 partial tracts) A) FHA, FSA/RHS & VA B) Conventional C) Refinancings D) Home Improvement Loans E) Loans on Dwellings For 5+ Families F) Non-occupant Loans on Number Average Value Number Average Value Number Average Value Number Average Value Number Average Value Number Average Value
LOANS ORIGINATED 225 $99,695 373 $87,878 1,157 $85,543 43 $39,872 5 $461,792 226 $76,660 APPLICATIONS APPROVED, NOT ACCEPTED 12 $100,227 50 $90,442 230 $90,142 12 $36,482 0 $0 27 $93,944 APPLICATIONS DENIED 23 $100,706 82 $88,657 669 $88,985 63 $30,992 1 $169,000 61 $74,869 APPLICATIONS WITHDRAWN 11 $100,379 60 $95,952 460 $92,991 10 $39,505 1 $225,000 29 $79,672 FILES CLOSED FOR INCOMPLETENESS 1 $59,010 6 $113,097 63 $94,265 1 $59,320 0 $0 10 $83,663
Aggregated Statistics For Year 2002(Based on 1 full and 2 partial tracts) A) FHA, FSA/RHS & VA B) Conventional C) Refinancings D) Home Improvement Loans E) Loans on Dwellings For 5+ Families F) Non-occupant Loans on Number Average Value Number Average Value Number Average Value Number Average Value Number Average Value Number Average Value
LOANS ORIGINATED 51 $101,631 86 $92,258 137 $97,589 18 $49,915 1 $655,420 26 $92,802 APPLICATIONS APPROVED, NOT ACCEPTED 1 $99,020 5 $86,122 27 $95,190 10 $19,810 0 $0 6 $103,343 APPLICATIONS DENIED 4 $92,995 18 $82,953 82 $88,043 13 $25,442 0 $0 9 $85,807 APPLICATIONS WITHDRAWN 6 $88,390 5 $86,162 53 $100,911 3 $11,413 0 $0 2 $79,300 FILES CLOSED FOR INCOMPLETENESS 0 $0 0 $0 7 $113,116 0 $0 0 $0 0 $0
Aggregated Statistics For Year 2001(Based on 1 full and 2 partial tracts) A) FHA, FSA/RHS & VA B) Conventional C) Refinancings D) Home Improvement Loans F) Non-occupant Loans on Number Average Value Number Average Value Number Average Value Number Average Value Number Average Value
LOANS ORIGINATED 47 $94,727 64 $93,432 112 $87,433 20 $24,038 29 $73,287 APPLICATIONS APPROVED, NOT ACCEPTED 1 $143,010 3 $89,707 19 $81,019 7 $30,351 2 $89,610 APPLICATIONS DENIED 4 $85,272 8 $75,032 75 $74,499 12 $19,732 7 $57,406 APPLICATIONS WITHDRAWN 5 $83,694 5 $106,814 59 $90,766 8 $19,121 4 $61,012 FILES CLOSED FOR INCOMPLETENESS 0 $0 0 $0 10 $88,007 0 $0 2 $43,625
Aggregated Statistics For Year 2000(Based on 1 full and 2 partial tracts) A) FHA, FSA/RHS & VA B) Conventional C) Refinancings D) Home Improvement Loans F) Non-occupant Loans on Number Average Value Number Average Value Number Average Value Number Average Value Number Average Value
LOANS ORIGINATED 37 $90,004 44 $79,227 37 $64,755 13 $26,358 10 $58,438 APPLICATIONS APPROVED, NOT ACCEPTED 4 $78,598 4 $50,970 9 $66,811 7 $24,717 3 $56,813 APPLICATIONS DENIED 2 $109,780 10 $71,959 41 $59,307 11 $21,601 3 $33,450 APPLICATIONS WITHDRAWN 3 $83,863 4 $72,488 25 $60,156 2 $19,625 0 $0 FILES CLOSED FOR INCOMPLETENESS 0 $0 2 $81,425 5 $100,074 0 $0 0 $0
Aggregated Statistics For Year 1999(Based on 1 full and 6 partial tracts) A) FHA, FSA/RHS & VA B) Conventional C) Refinancings D) Home Improvement Loans E) Loans on Dwellings For 5+ Families F) Non-occupant Loans on Number Average Value Number Average Value Number Average Value Number Average Value Number Average Value Number Average Value
LOANS ORIGINATED 198 $85,569 140 $74,737 288 $67,601 55 $23,498 3 $147,107 69 $64,563 APPLICATIONS APPROVED, NOT ACCEPTED 3 $94,463 19 $75,128 57 $63,396 31 $18,819 1 $71,180 11 $50,618 APPLICATIONS DENIED 22 $87,506 41 $67,227 241 $64,351 77 $22,339 1 $118,350 25 $57,299 APPLICATIONS WITHDRAWN 29 $108,860 30 $79,295 163 $69,387 8 $22,715 0 $0 17 $55,496 FILES CLOSED FOR INCOMPLETENESS 6 $85,482 9 $121,444 37 $72,906 0 $0 0 $0 2 $45,315
Detailed mortgage data for all 11 tracts in Porterville, CA
Private Mortgage Insurance Companies Aggregated Statistics For Year 2009(Based on 4 full and 5 partial tracts) A) Conventional B) Refinancings C) Non-occupant Loans on Number Average Value Number Average Value Number Average Value
LOANS ORIGINATED 12 $163,766 2 $191,720 1 $113,380 APPLICATIONS APPROVED, NOT ACCEPTED 2 $140,005 1 $248,780 0 $0 APPLICATIONS DENIED 2 $174,475 1 $144,000 0 $0 APPLICATIONS WITHDRAWN 0 $0 0 $0 0 $0 FILES CLOSED FOR INCOMPLETENESS 0 $0 1 $157,010 0 $0
Aggregated Statistics For Year 2008(Based on 5 full and 6 partial tracts) A) Conventional B) Refinancings C) Non-occupant Loans on Number Average Value Number Average Value Number Average Value
LOANS ORIGINATED 50 $200,084 29 $188,587 2 $162,430 APPLICATIONS APPROVED, NOT ACCEPTED 39 $183,679 33 $202,529 6 $141,152 APPLICATIONS DENIED 7 $201,329 9 $182,961 2 $182,520 APPLICATIONS WITHDRAWN 4 $174,312 5 $179,174 0 $0 FILES CLOSED FOR INCOMPLETENESS 1 $176,480 0 $0 0 $0
Aggregated Statistics For Year 2007(Based on 5 full and 6 partial tracts) A) Conventional B) Refinancings C) Non-occupant Loans on Number Average Value Number Average Value Number Average Value
LOANS ORIGINATED 70 $211,812 55 $219,693 13 $148,993 APPLICATIONS APPROVED, NOT ACCEPTED 16 $216,654 13 $244,973 3 $163,860 APPLICATIONS DENIED 3 $161,263 2 $401,045 1 $90,000 APPLICATIONS WITHDRAWN 6 $210,108 5 $182,726 1 $194,300 FILES CLOSED FOR INCOMPLETENESS 0 $0 0 $0 0 $0
Aggregated Statistics For Year 2006(Based on 5 full and 6 partial tracts) A) Conventional B) Refinancings C) Non-occupant Loans on Number Average Value Number Average Value Number Average Value
LOANS ORIGINATED 46 $210,668 22 $193,030 7 $192,494 APPLICATIONS APPROVED, NOT ACCEPTED 4 $264,212 5 $202,602 2 $157,500 APPLICATIONS DENIED 0 $0 1 $173,000 0 $0 APPLICATIONS WITHDRAWN 1 $256,830 2 $184,010 0 $0 FILES CLOSED FOR INCOMPLETENESS 0 $0 0 $0 0 $0
Aggregated Statistics For Year 2005(Based on 5 full and 6 partial tracts) A) Conventional B) Refinancings C) Non-occupant Loans on Number Average Value Number Average Value Number Average Value
LOANS ORIGINATED 90 $163,181 35 $167,725 22 $156,997 APPLICATIONS APPROVED, NOT ACCEPTED 11 $157,567 14 $132,804 3 $127,667 APPLICATIONS DENIED 0 $0 1 $95,000 0 $0 APPLICATIONS WITHDRAWN 3 $115,760 2 $203,045 0 $0 FILES CLOSED FOR INCOMPLETENESS 2 $85,500 0 $0 0 $0
Aggregated Statistics For Year 2004(Based on 5 full and 6 partial tracts) A) Conventional B) Refinancings C) Non-occupant Loans on Number Average Value Number Average Value Number Average Value
LOANS ORIGINATED 131 $121,216 54 $122,703 29 $96,432 APPLICATIONS APPROVED, NOT ACCEPTED 5 $114,666 18 $105,431 2 $82,800 APPLICATIONS DENIED 5 $120,518 4 $118,250 3 $118,710 APPLICATIONS WITHDRAWN 8 $131,501 1 $194,230 1 $151,910 FILES CLOSED FOR INCOMPLETENESS 2 $79,005 0 $0 0 $0
Aggregated Statistics For Year 2003(Based on 5 full and 6 partial tracts) A) Conventional B) Refinancings C) Non-occupant Loans on Number Average Value Number Average Value Number Average Value
LOANS ORIGINATED 137 $106,159 161 $103,417 35 $90,567 APPLICATIONS APPROVED, NOT ACCEPTED 13 $100,775 24 $103,126 3 $82,157 APPLICATIONS DENIED 1 $114,910 5 $110,526 0 $0 APPLICATIONS WITHDRAWN 3 $84,607 5 $102,208 0 $0 FILES CLOSED FOR INCOMPLETENESS 0 $0 2 $84,500 0 $0
Aggregated Statistics For Year 2002(Based on 2 partial tracts) A) Conventional B) Refinancings C) Non-occupant Loans on Number Average Value Number Average Value Number Average Value
LOANS ORIGINATED 34 $117,041 24 $109,805 5 $79,182 APPLICATIONS APPROVED, NOT ACCEPTED 1 $206,590 6 $93,127 1 $55,590 APPLICATIONS DENIED 2 $102,480 0 $0 0 $0 APPLICATIONS WITHDRAWN 1 $98,500 1 $83,390 0 $0 FILES CLOSED FOR INCOMPLETENESS 0 $0 0 $0 0 $0
Aggregated Statistics For Year 2001(Based on 2 partial tracts) A) Conventional B) Refinancings C) Non-occupant Loans on Number Average Value Number Average Value Number Average Value
LOANS ORIGINATED 22 $111,195 16 $108,458 1 $108,370 APPLICATIONS APPROVED, NOT ACCEPTED 2 $97,700 1 $108,090 0 $0 APPLICATIONS DENIED 0 $0 0 $0 0 $0 APPLICATIONS WITHDRAWN 2 $130,600 0 $0 0 $0 FILES CLOSED FOR INCOMPLETENESS 0 $0 0 $0 0 $0
Aggregated Statistics For Year 2000(Based on 2 partial tracts) A) Conventional B) Refinancings C) Non-occupant Loans on Number Average Value Number Average Value Number Average Value
LOANS ORIGINATED 19 $89,609 4 $106,785 4 $54,998 APPLICATIONS APPROVED, NOT ACCEPTED 1 $84,210 0 $0 0 $0 APPLICATIONS DENIED 1 $136,560 0 $0 0 $0 APPLICATIONS WITHDRAWN 0 $0 0 $0 0 $0 FILES CLOSED FOR INCOMPLETENESS 0 $0 0 $0 0 $0
Aggregated Statistics For Year 1999(Based on 1 full and 6 partial tracts) A) Conventional B) Refinancings C) Non-occupant Loans on Number Average Value Number Average Value Number Average Value
LOANS ORIGINATED 59 $87,073 40 $89,593 4 $73,352 APPLICATIONS APPROVED, NOT ACCEPTED 4 $87,048 2 $109,945 1 $52,880 APPLICATIONS DENIED 5 $66,672 2 $102,000 2 $35,160 APPLICATIONS WITHDRAWN 3 $81,433 1 $209,360 1 $46,310 FILES CLOSED FOR INCOMPLETENESS 0 $0 0 $0 0 $0
Fire-safe hotels and motels in Porterville, California:
Best Western Porterville Inn, 350 W Montgomery Ave, Porterville, California 93257 Phone: (559) 781-7411, Fax: (559) 781-8910
Holiday Inn Express Hotel & Suites, 840 S Jaye St, Porterville, California 93257 Phone: (559) 782-1200, Fax: (559) 782-1300
Americas Best Value Inn - Porterville, 676 N Main St, Porterville, California 93257 Phone: (559) 306-1900, Fax: (559) 306-1901
All 3 fire-safe hotels and motels in Porterville, California
Most common first names in Porterville, CA among deceased individuals Name Count Lived (average)
John 330 72.6 years William 285 75.0 years James 256 70.9 years Mary 250 78.0 years Robert 205 69.1 years George 167 75.3 years Charles 152 73.1 years Frank 99 74.6 years Dorothy 87 75.1 years Richard 83 62.7 years
Most common last names in Porterville, CA among deceased individuals Last name Count Lived (average)
Smith 149 89.0 years Johnson 110 71.5 years Jones 107 73.2 years Brown 93 68.9 years Wilson 68 75.1 years Miller 67 76.4 years Davis 66 74.6 years Martinez 63 64.6 years Williams 62 74.0 years Moore 59 74.3 years
Porterville compared to California state average:
Median household income below state average. Median house value significantly below state average. Black race population percentage significantly below state average. Hispanic race population percentage above state average. Foreign-born population percentage above state average. Length of stay since moving in significantly above state average. Percentage of population with a bachelor's degree or higher below state average. Porterville on our top lists :
#5 on the list of "Top 101 cities with largest percentage of males in occupations: farming, fishing, and forestry occupations (population 50,000+)"
#6 on the list of "Top 101 cities with largest percentage of males in industries: agriculture, forestry, fishing and hunting (population 50,000+)"
#6 on the list of "Top 101 cities with the smallest percentage of elementary and middle school students in private schools (5,000+ students)"
#8 on the list of "Top 101 cities with largest percentage of females in industries: agriculture, forestry, fishing and hunting (population 50,000+)"
#9 on the list of "Top 101 cities with largest percentage of females in occupations: farming, fishing, and forestry occupations (population 50,000+)"
#10 on the list of "Top 101 cities with largest percentage of workers with very short commute times (9 minutes or less) (population 50,000+)"
#13 on the list of "Top 101 cities with the largest sunshine amount differences during a year (population 50,000+)"
#14 on the list of "Top 101 cities with the largest percentage of people in orthopedic wards and institutions for the physically handicapped (population 1,000+)"
#16 on the list of "Top 101 cities with the largest humidity differences during a year (population 50,000+)"
#16 on the list of "Top 101 cities with largest percentage of males in occupations: law enforcement workers including supervisors (population 50,000+)"
#16 on the list of "Top 101 cities with the largest differences between morning and afternoon humidity (population 50,000+)"
#20 on the list of "Top 101 cities with the least people having Doctorate degrees (population 50,000+)"
#20 on the list of "Top 101 cities with largest percentage of females in occupations: law enforcement workers including supervisors (population 50,000+)"
#31 on the list of "Top 100 least-educated cities (pop. 50,000+)"
#33 on the list of "Top 101 cities with the largest percentage of unmarried partner households (population 50,000+)"
#35 on the list of "Top 101 cities with the highest average sunshine amount (population 50,000+)"
#37 on the list of "Top 101 cities with the smallest percentage of high school students in private schools (3,000+ students)"
#38 on the list of "Top 101 cities with the lowest number of arson incidents per 100,000 residents (population 50,000+)"
#41 on the list of "Top 101 cities with the highest daily high temperatures (population 50,000+)"
#42 on the list of "Top 101 cities with the lowest number of days clear of clouds (population 50,000+)"
#6 on the list of "Top 101 counties with the highest Particulate Matter (PM2.5 ) Annual air pollution readings in 2012 (µg/m3 )"
#7 on the list of "Top 101 counties with the highest Particulate Matter (PM10 ) Annual air pollution readings in 2012 (µg/m3 )"
#10 on the list of "Top 101 counties with the highest number of births per 1000 residents 2007-2013"
#16 on the list of "Top 101 counties with the highest Ozone (1-hour) air pollution readings in 2012 (ppm)"
#25 on the list of "Top 101 counties with the lowest percentage of residents relocating to foreign countries in 2011"
Top Patent Applicants
Steven Lane (17)
Timothy P. Sheehan (6)
Orville Allen Ennis (2)
Lieng Hong Vang (2)
Ernest John Shearing (2)
Huu Tieu (2)
Bill T. Scarbrough (1)
Edward M. Sybesma (1)
Wallace E. Ruminson (1)
Ubaldo Garza (1)
Total of 43 patent applications in 2008-2024.


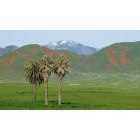


 Recent articles from our blog. Our writers, many of them Ph.D. graduates or candidates, create easy-to-read articles on a wide variety of topics.

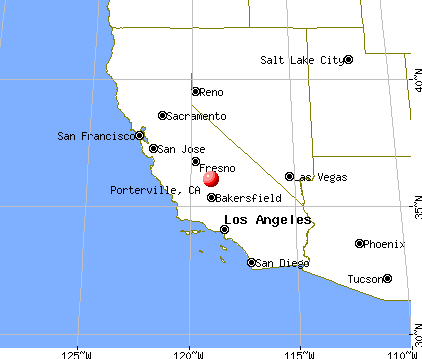
 (23.6 miles
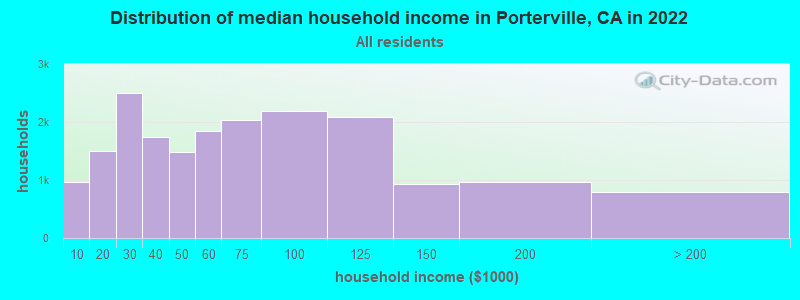
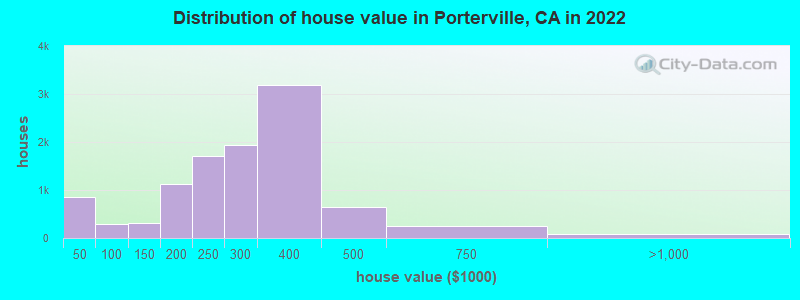
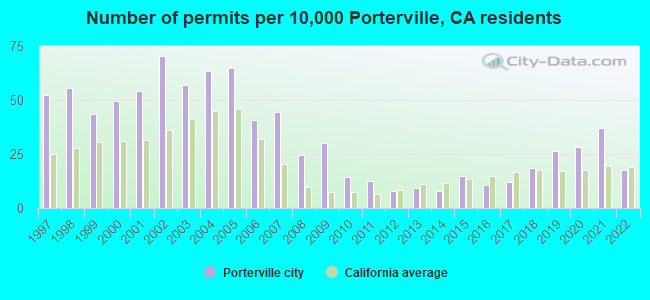
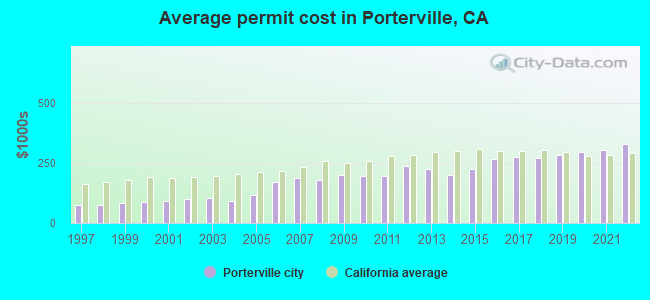
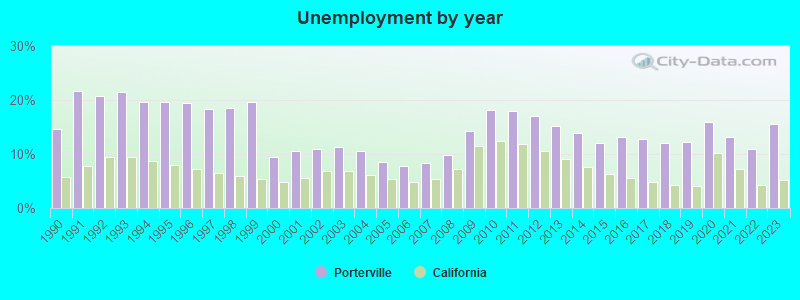
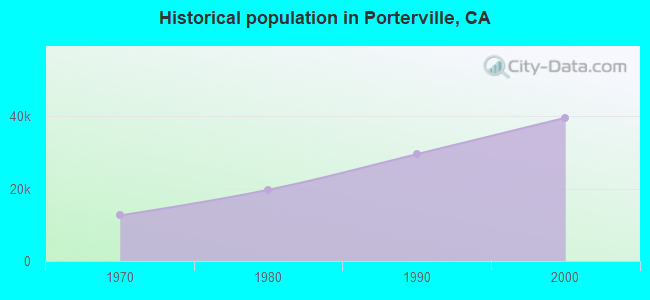
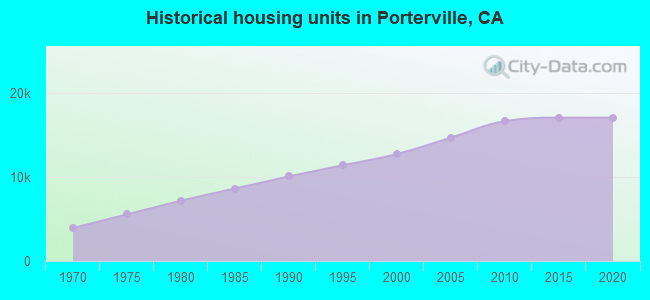
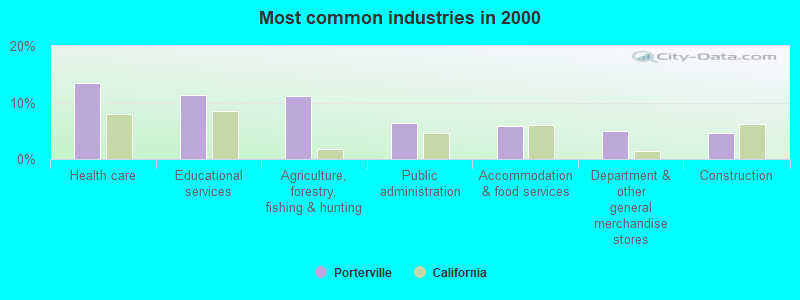
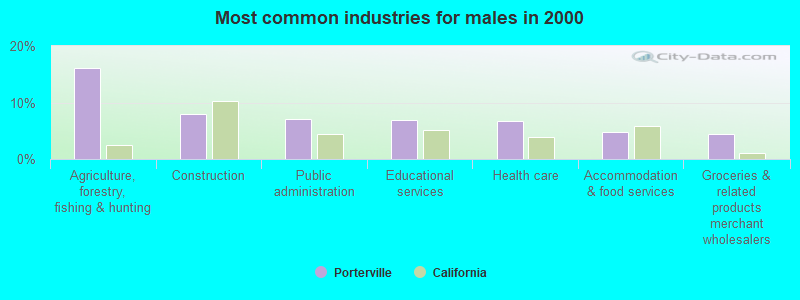
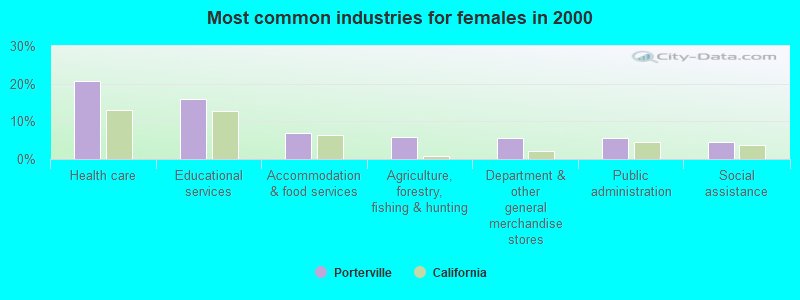
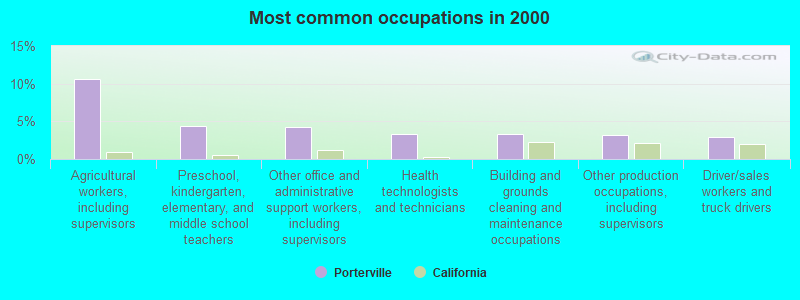
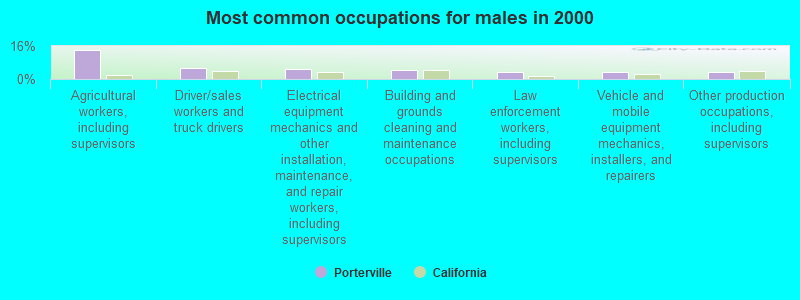
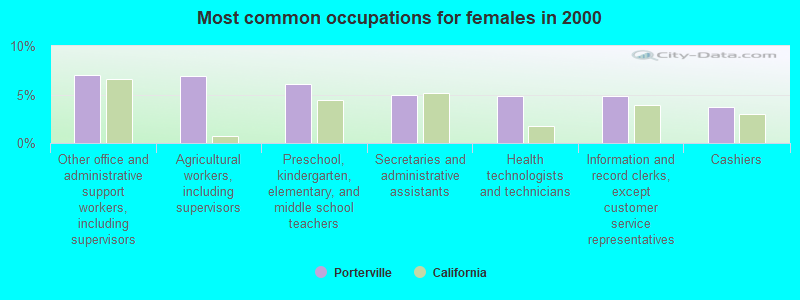
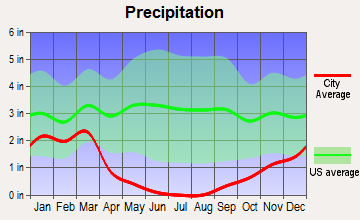
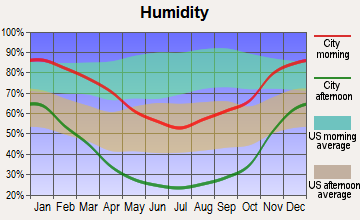
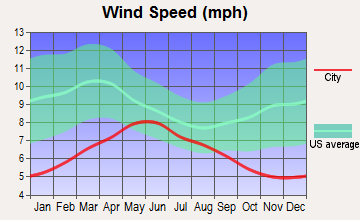
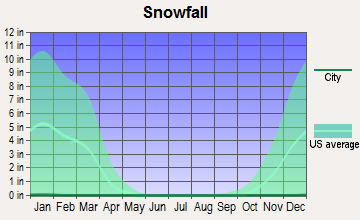
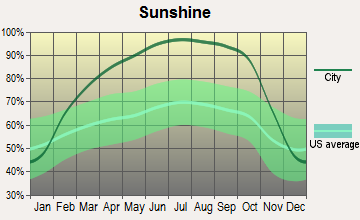
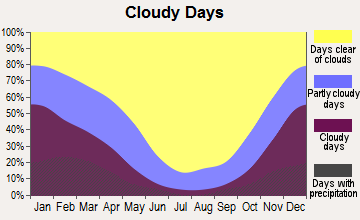
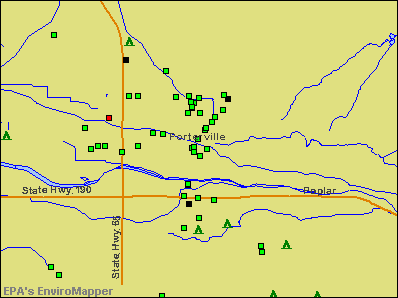


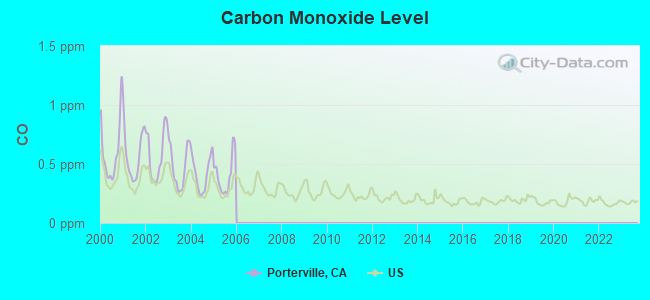
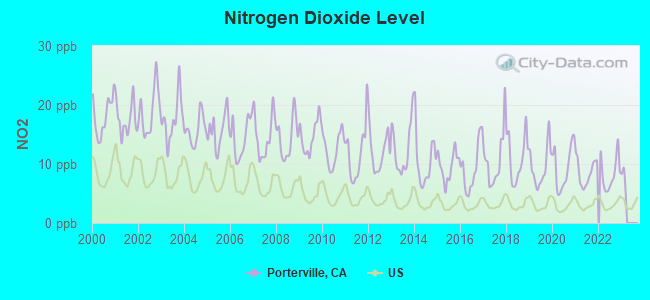
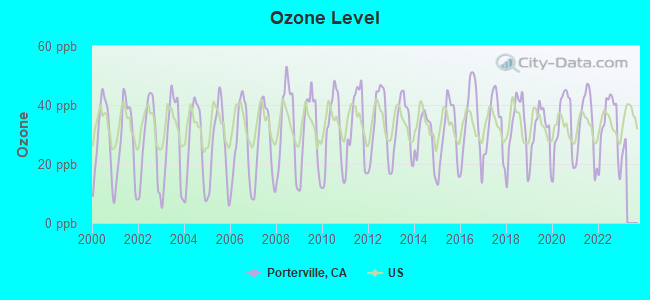
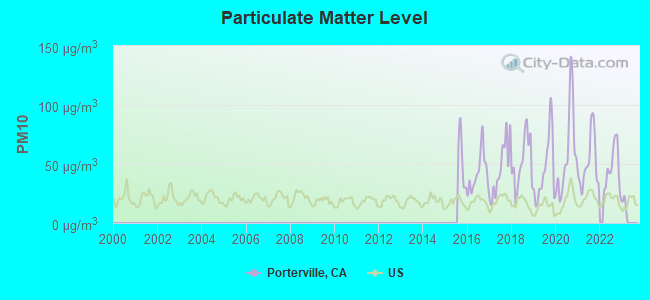
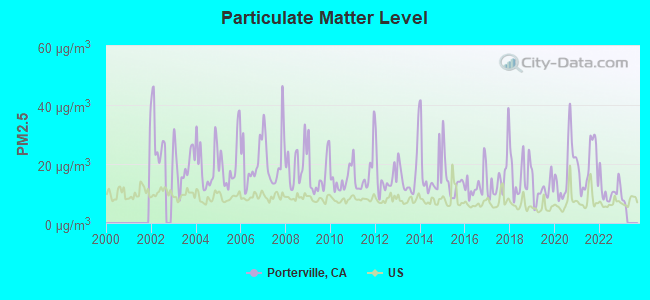

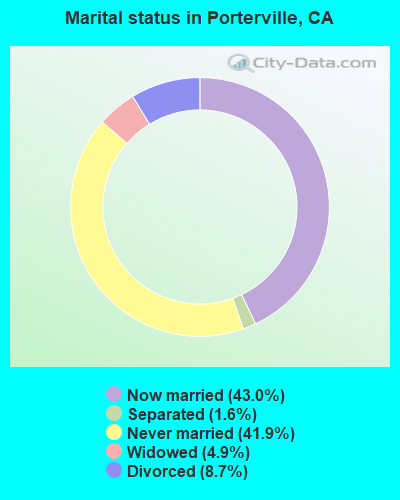
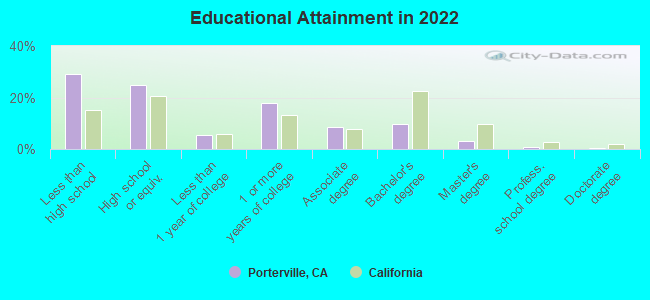
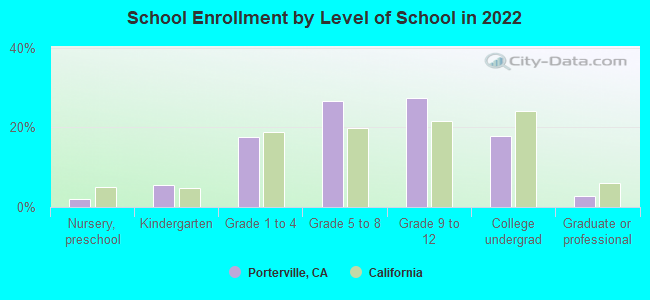
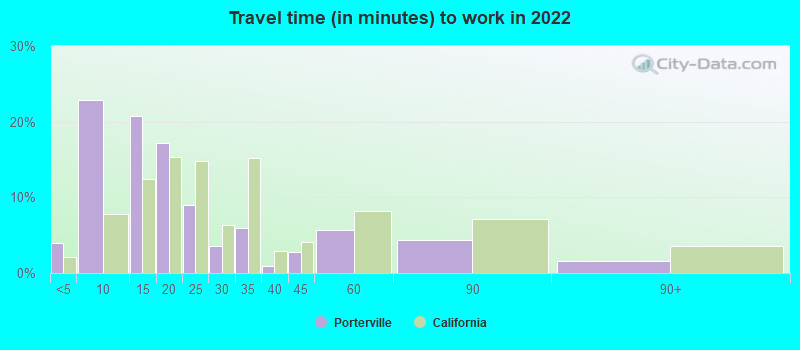
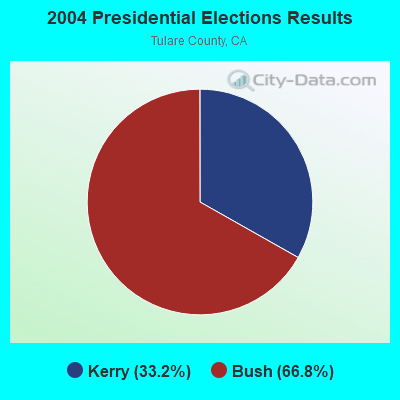
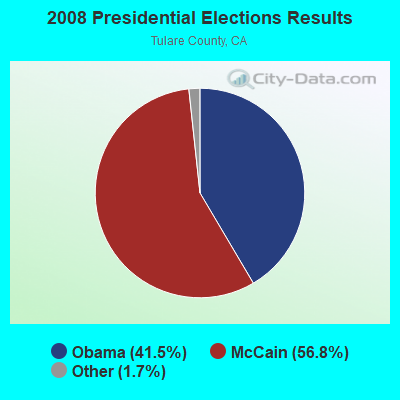
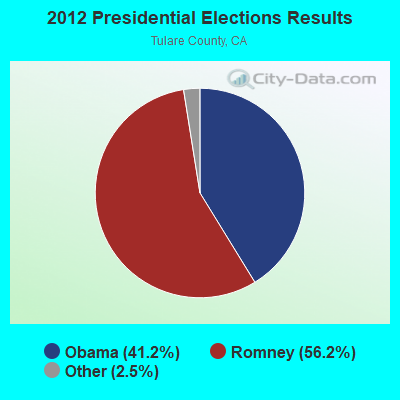
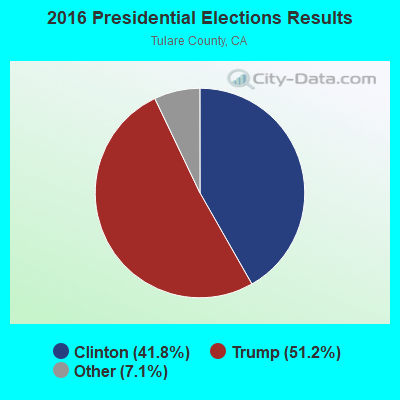
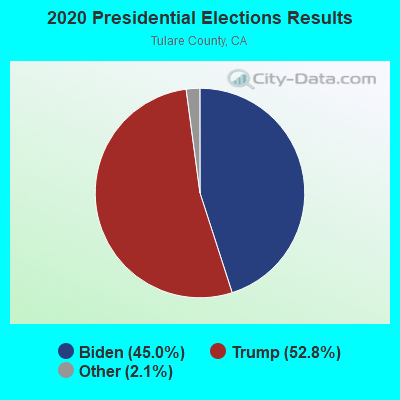
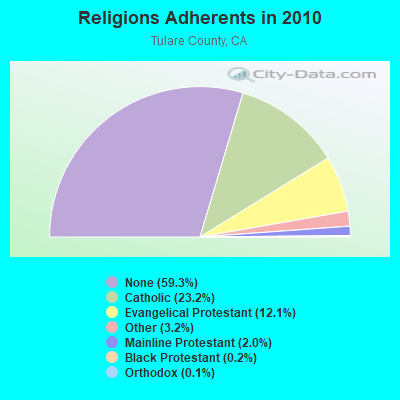
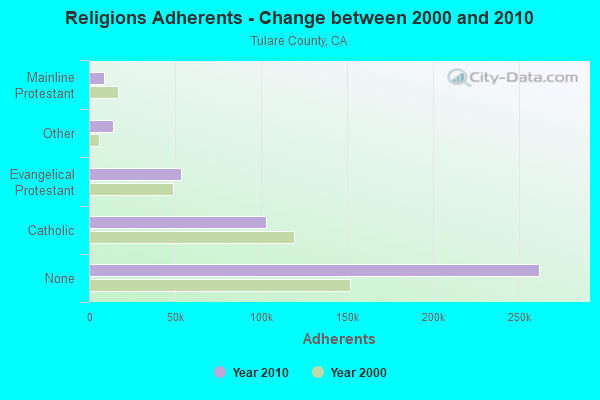
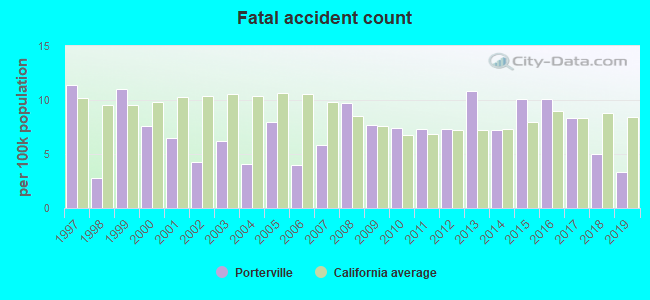
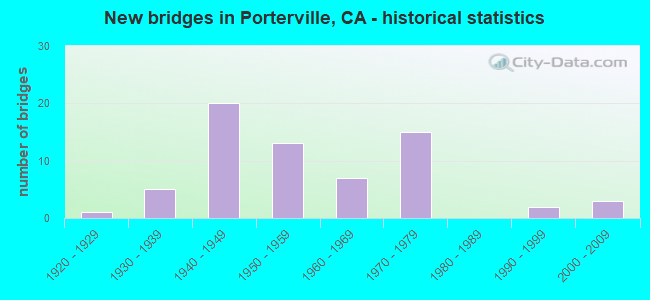
 According to the data from the years 2005 - 2018 the average number of fires per year is 268. The highest number of fires - 413 took place in 2005, and the least - 155 in 2018. The data has a dropping trend.
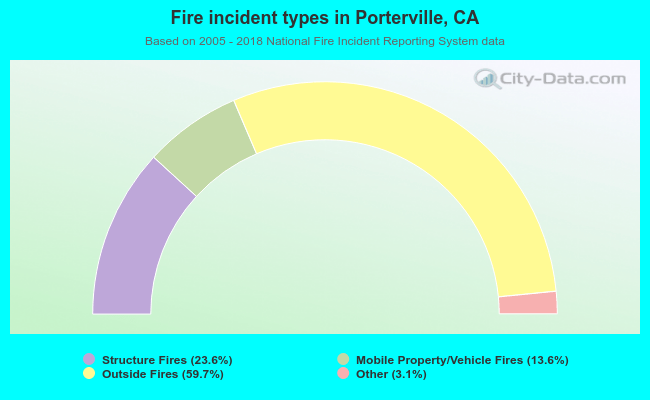 When looking into fire subcategories, the most reports belonged to: Outside Fires (59.7%), and Structure Fires (23.6%).