Overland Park, KS (Kansas) Houses and Residents
| Overland Park: | $374,300 |
| Kansas: | $206,600 |
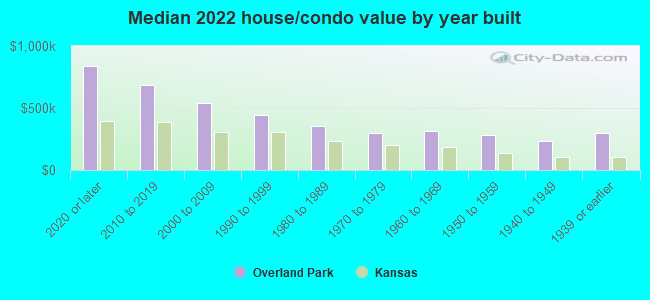
Mean price in 2022:
Detached houses: $431,757
Here: $431,757 State: $264,181 Townhouses or other attached units: $282,714
Here: $282,714 State: $219,178 In 2-unit structures: $220,002
Here: $220,002 State: $190,919 In 3-to-4-unit structures: $222,059
Here: $222,059 State: $161,859 In 5-or-more-unit structures: $238,841
Here: $238,841 State: $267,030 Mobile homes: $168,808
Here: $168,808 State: $74,712
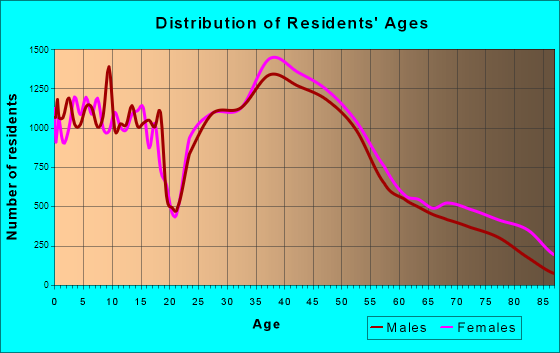
Total population: 184,525 (Urban population: 147,732, Rural population: 1,116 (15 farm, 1,101 nonfarm))
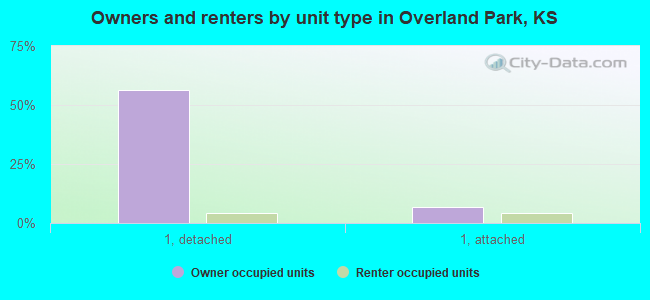
Houses: 91,560 (85,630 occupied: 50,867 owner occupied, 34,763 renter occupied)
| % of renters here: | 41% |
| State: | 32% |
Housing density: 1,613 houses/condos per square mile
Median price asked for vacant for-sale houses and condos in 2022: $258,336.
Median contract rent in 2022: $1,194 (lower quartile is $988, upper quartile is $1,492)
Median rent asked for vacant for-rent units in 2022: $3,902
Median gross rent in Overland Park, KS in 2022: $1,371
Housing units in Overland Park with a mortgage: 34,456 (4,479 second mortgage, 145 home equity loan, 3,861 both second mortgage and home equity loan)
Houses without a mortgage: 1,217
Median household income for houses/condos with a mortgage: $144,180
Median household income for apartments without a mortgage: $91,487
Median monthly housing costs: $1,448
Compare current foreclosures in Overland Park, KS:
| Photo | Address | Area | Beds / Baths | Price | Details |
|---|---|---|---|---|---|

|
#1
W 155th St
Overland Park, KS 66224
|
2,157 sq. feet
|
5 baths 4 beds |
show details | |

|
#2
Hemlock St
Overland Park, KS 66204
|
1,816 sq. feet
|
2 baths 3 beds |
show details | |

|
#3
Craig St
Overland Park, KS 66213
|
2,883 sq. feet
|
3 baths 4 beds |
show details | |

|
#4
W 151st Pl
Overland Park, KS 66223
|
1,446 sq. feet
|
2 baths 3 beds |
show details | |

|
#5
W 115th St
Overland Park, KS 66210
|
1,312 sq. feet
|
1 baths 2 beds |
show details | |

|
#6
W 72nd St
Overland Park, KS 66204
|
1,008 sq. feet
|
2 baths 3 beds |
show details | |

|
#7
Craig St
Overland Park, KS 66213
|
2,924 sq. feet
|
3 baths 4 beds |
show details | |

|
#8
Connell Dr
Overland Park, KS 66212
|
1,539 sq. feet
|
2 baths 3 beds |
show details | |

|
#9
W 143rd Ter
Overland Park, KS 66224
|
3,269 sq. feet
|
3 baths 4 beds |
show details | |

|
#10
W 96th Ter
Overland Park, KS 66214
|
1,354 sq. feet
|
2 baths 3 beds |
show details |
| Photo | Address | Area | Beds / Baths | Price | Details |
|---|---|---|---|---|---|

|
#11
W 115th St
Overland Park, KS 66210
|
1,376 sq. feet
|
2 baths 2 beds |
show details | |

|
#12
Robinson St
Overland Park, KS 66204
|
2,108 sq. feet
|
3 baths 4 beds |
show details | |

|
#13
Walmer St
Overland Park, KS 66204
|
1,677 sq. feet
|
1 baths 3 beds |
show details | |

|
#14
Santa Fe Dr
Overland Park, KS 66212
|
977 sq. feet
|
1 baths 2 beds |
show details | |

|
#15
W 158th Ter
Overland Park, KS 66223
|
1,804 sq. feet
|
3 baths 3 beds |
show details | |

|
#16
W 69th St
Overland Park, KS 66204
|
2,449 sq. feet
|
2 baths 5 beds |
show details | |

|
#17
Hemlock St
Overland Park, KS 66223
|
3,015 sq. feet
|
2 baths 4 beds |
show details | |

|
#18
W 138th Ter
Overland Park, KS 66224
|
3,257 sq. feet
|
3 baths 4 beds |
show details | |

|
#19
Hayes St
Overland Park, KS 66212
|
924 sq. feet
|
1 baths 2 beds |
show details | |

|
#20
Lowell Ave
Overland Park, KS 66204
|
1,908 sq. feet
|
2 baths 4 beds |
show details |
| Photo | Address | Area | Beds / Baths | Price | Details |
|---|---|---|---|---|---|

|
#21
Hemlock St
Overland Park, KS 66223
|
3,250 sq. feet
|
4 baths 5 beds |
show details | |

|
#22
England Dr
Overland Park, KS 66212
|
1,631 sq. feet
|
2 baths 4 beds |
show details | |

|
#23
Larsen St
Overland Park, KS 66213
|
2,903 sq. feet
|
3 baths 4 beds |
show details | |

|
#24
Riley St
Overland Park, KS 66223
|
1,654 sq. feet
|
2 baths 3 beds |
show details | |

|
#25
W 146th St
Overland Park, KS 66221
|
3,454 sq. feet
|
3 baths 4 beds |
show details | |

|
#26
W 87th St
Overland Park, KS 66212
|
924 sq. feet
|
1 baths 2 beds |
show details | |

|
#27
W 152nd St
Overland Park, KS 66223
|
1,734 sq. feet
|
2 baths 3 beds |
show details | |

|
#28
Larsen St
Overland Park, KS 66213
|
2,885 sq. feet
|
3 baths 4 beds |
show details | |

|
#29
W 140th St
Overland Park, KS 66221
|
4,830 sq. feet
|
4 baths 5 beds |
show details | |

|
#30
Russell St
Overland Park, KS 66212
|
1,780 sq. feet
|
3 baths 3 beds |
show details |
| Photo | Address | Area | Beds / Baths | Price | Details |
|---|---|---|---|---|---|

|
#31
W 157th Ter
Overland Park, KS 66223
|
2,168 sq. feet
|
2 baths 4 beds |
show details | |

|
#32
Broadmoor St
Overland Park, KS 66223
|
1,788 sq. feet
|
2 baths 3 beds |
show details | |

|
#33
W 90th St
Overland Park, KS 66214
|
1,144 sq. feet
|
3 baths 3 beds |
show details | |

|
#34
Kessler St
Overland Park, KS 66204
|
1,620 sq. feet
|
2 baths 3 beds |
show details | |

|
#35
Mackey St
Overland Park, KS 66204
|
880 sq. feet
|
1 baths 2 beds |
show details | |

|
#36
Haskins St
Overland Park, KS 66210
|
1,498 sq. feet
|
2 baths 3 beds |
show details | |

|
#37
W 152nd St
Overland Park, KS 66223
|
1,948 sq. feet
|
2 baths 3 beds |
show details | |

|
#38
W 101st St
Overland Park, KS 66212
|
2,786 sq. feet
|
2 baths 4 beds |
show details | |

|
#39
Foster Ln
Overland Park, KS 66212
|
1,412 sq. feet
|
2 baths 3 beds |
show details | |

|
#40
W 97th St
Overland Park, KS 66207
|
1,024 sq. feet
|
1 baths 2 beds |
show details |
| Photo | Address | Area | Beds / Baths | Price | Details |
|---|---|---|---|---|---|

|
#41
W 77th Ter
Overland Park, KS 66204
|
984 sq. feet
|
1 baths 2 beds |
show details | |

|
#42
W 88th Ter
Overland Park, KS 66212
|
960 sq. feet
|
3 baths 3 beds |
show details | |

|
#43
Hauser St
Overland Park, KS 66210
|
2,218 sq. feet
|
3 baths 4 beds |
show details | |

|
#44
W 101st Ter
Overland Park, KS 66212
|
2,320 sq. feet
|
2 baths 4 beds |
show details | |

|
#45
Bluejacket St
Overland Park, KS 66213
|
2,929 sq. feet
|
3 baths 4 beds |
show details | |

|
#46
Goddard St
Overland Park, KS 66214
|
1,536 sq. feet
|
1 baths 5 beds |
show details | |

|
#47
Santa Fe Dr
Overland Park, KS 66204
|
768 sq. feet
|
1 baths 2 beds |
show details | |

|
#48
Garnett Ln
Overland Park, KS 66213
|
2,420 sq. feet
|
2 baths 4 beds |
show details | |

|
#49
W 84th St
Overland Park, KS 66212
|
1,368 sq. feet
|
2 baths 3 beds |
show details | |

|
Check over 1 million property listings on Foreclosure.com!
|
browse all offers | |||


 | Garden City — Any tricks for finding a nice house to rent? (70 replies) |
| Do you folks think areas in eastern Kansas like Overland Park, KS will run out of water? (3 replies) |
| Rent to own homes? (2 replies) |
| What to expect as a single, POC guy? (42 replies) |
| Kansas Heat (20 replies) |
| Kansas pictures (295 replies) |
Median year apartment built: 1996
Household type by relationship:
Households: 197,747- Male householders: 45,994 (14,585 living alone), Female householders: 39,636 (15,466 living alone)
40,410 spouses (40,090 opposite-sex spouses), 5,226 unmarried partners, (4,871 opposite-sex unmarried partners), 50,435 children (46,804 natural, 2,298 adopted, 1,333 stepchildren), 3,108 grandchildren, 890 brothers or sisters, 2,045 parents, 104 foster children, 566 other relatives, 7,665 non-relatives
- In group quarters: 1,668
Size of family households: 21,680 2-persons, 11,080 3-persons, 9,834 4-persons, 4,189 5-persons, 1,170 6-persons, 599 7-or-more-persons.
Size of nonfamily households: 30,051 1-person, 5,822 2-persons, 962 3-persons, 243 4-persons.
33,198 married couples with children.
5,261 single-parent households (1,528 men, 3,733 women).
86.0% of residents of Overland Park speak English at home.
4.2% of residents speak Spanish at home (65% speak English very well, 22% speak English well, 11% speak English not well, 2% don't speak English at all).
3.1% of residents speak other Indo-European language at home (81% speak English very well, 13% speak English well, 5% speak English not well).
5.4% of residents speak Asian or Pacific Island language at home (61% speak English very well, 25% speak English well, 9% speak English not well, 4% don't speak English at all).
1.4% of residents speak other language at home (70% speak English very well, 24% speak English well, 6% speak English not well).
Foreign born population: 22,252 (11.3%)
(45.7% of them are naturalized citizens)
| Here: | 7.8 |
| State: | 6.9 |
| Here: | 3.8 |
| State: | 4.4 |
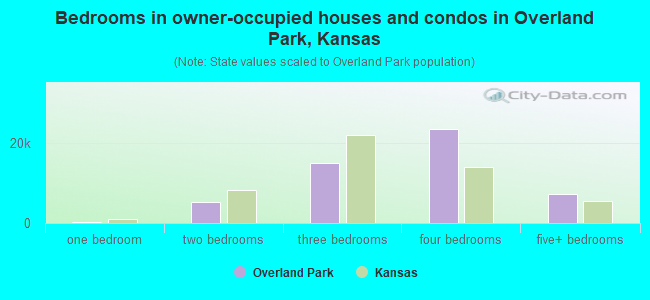
- Bedrooms in owner-occupied houses and condos in Overland Park, Kansas
- 50no bedroom
- 1931 bedroom
- 5,1132 bedrooms
- 14,9243 bedrooms
- 23,4394 bedrooms
- 7,1485+ bedrooms
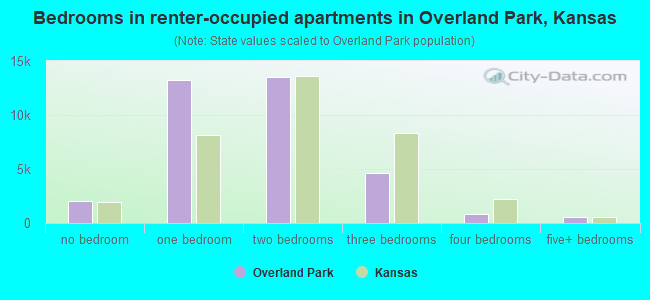
- Bedrooms in renter-occupied apartments in Overland Park, Kansas
- 2,036no bedroom
- 13,2211 bedroom
- 13,4942 bedrooms
- 4,6153 bedrooms
- 8364 bedrooms
- 5615+ bedrooms
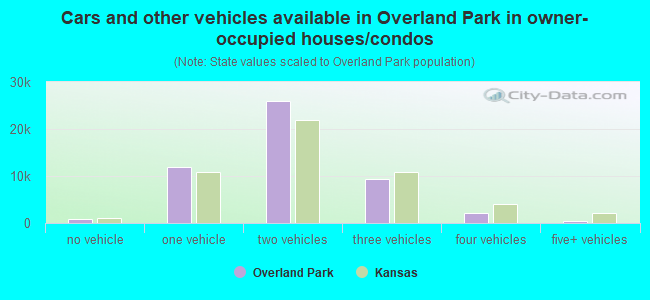
- Cars and other vehicles available in Overland Park in owner-occupied houses/condos
- 752no vehicle
- 11,9591 vehicle
- 26,0622 vehicles
- 9,4273 vehicles
- 2,1494 vehicles
- 5185+ vehicles
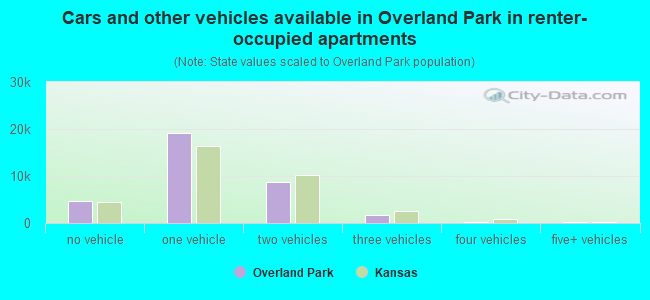
- Cars and other vehicles available in Overland Park in renter-occupied apartments
- 4,647no vehicle
- 19,2131 vehicle
- 8,8222 vehicles
- 1,6863 vehicles
- 2084 vehicles
- 1875+ vehicles
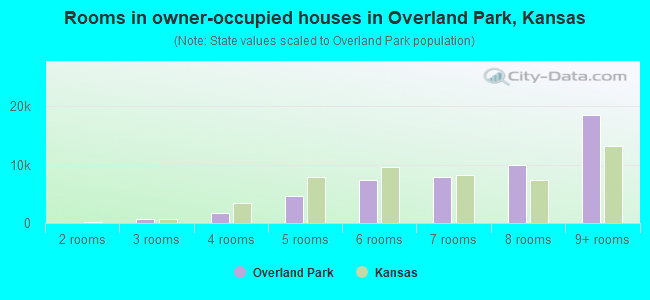
- Rooms in owner-occupied houses in Overland Park, Kansas
- 501 room
- 02 rooms
- 6763 rooms
- 1,7694 rooms
- 4,6435 rooms
- 7,4466 rooms
- 7,8627 rooms
- 9,8918 rooms
- 18,5309+ rooms
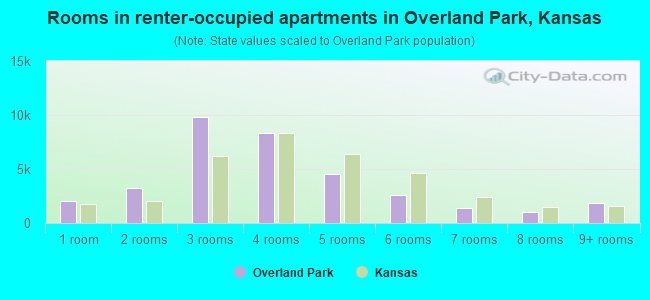
- Rooms in renter-occupied apartments in Overland Park, Kansas
- 2,0361 room
- 3,2032 rooms
- 9,7983 rooms
- 8,3214 rooms
- 4,5425 rooms
- 2,5996 rooms
- 1,4107 rooms
- 9788 rooms
- 1,8769+ rooms
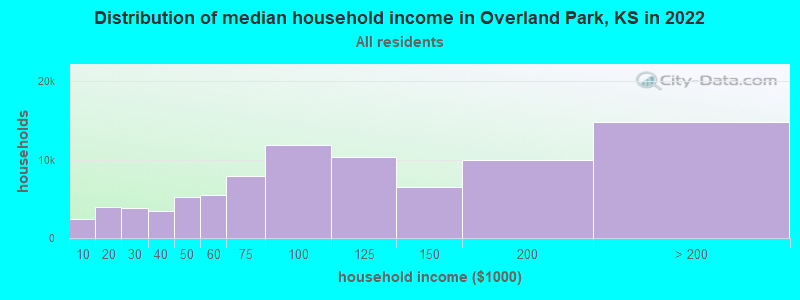
Overland Park, KS household income distribution

- 2,450Less than $10,000
- 3,904$10,000 to $19,999
- 3,809$20,000 to $29,999
- 3,486$30,000 to $39,999
- 5,194$40,000 to $49,999
- 5,515$50,000 to $59,999
- 7,881$60,000 to $74,999
- 11,895$75,000 to $99,999
- 10,320$100,000 to $124,999
- 6,510$125,000 to $149,999
- 9,884$150,000 to $199,999
- 14,782$200,000 or more
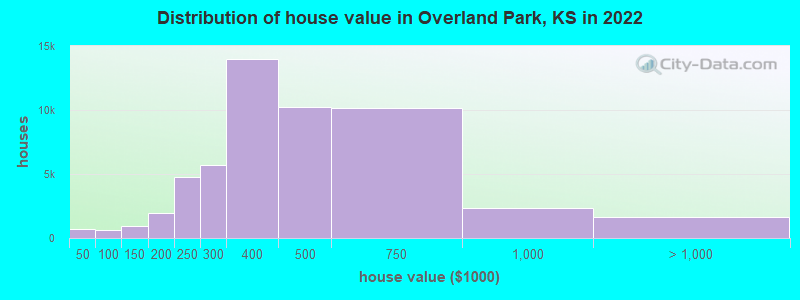
Home value of owner - occupied houses in 2022 in Overland Park, KS
-
- 156Less than $10,000
- 29$10,000 to $14,999
- 124$15,000 to $19,999
- 56$20,000 to $24,999
- 46$25,000 to $29,999
- 73$30,000 to $34,999
- 50$35,000 to $39,999
- 185$40,000 to $49,999
- 133$50,000 to $59,999
- 33$60,000 to $69,999
- 116$70,000 to $79,999
- 56$80,000 to $89,999
- 96$90,000 to $99,999
- 465$100,000 to $124,999
- 443$125,000 to $149,999
- 724$150,000 to $174,999
- 1,264$175,000 to $199,999
- 4,782$200,000 to $249,999
- 5,670$250,000 to $299,999
- 13,970$300,000 to $399,999
- 10,210$400,000 to $499,999
- 10,120$500,000 to $749,999
- 2,374$750,000 to $999,999
- 1,238$1,000,000 to $1,499,999
- 309$1,500,000 to $1,999,999
- 78$2,000,000 or more
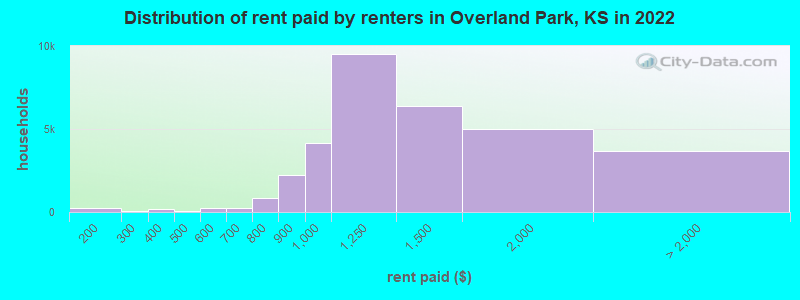
Rent paid by renters in 2022 in Overland Park, KS
-
- 12Less than $100
- 33$100 to $149
- 193$150 to $199
- 37$200 to $249
- 46$250 to $299
- 82$300 to $349
- 74$350 to $399
- 67$400 to $449
- 14$450 to $499
- 137$500 to $549
- 102$550 to $599
- 180$600 to $649
- 63$650 to $699
- 320$700 to $749
- 533$750 to $799
- 2,202$800 to $899
- 4,174$900 to $999
- 9,503$1,000 to $1,249
- 6,358$1,250 to $1,499
- 5,004$1,500 to $1,999
- 1,569$2,000 to $2,499
- 629$2,500 to $2,999
- 504$3,000 to $3,499
- 487$3,500 or more
- 478No cash rent
Percentage of workers working in this county: 77.0%
Number of people working at home: 28,804 (26.1% of all workers)
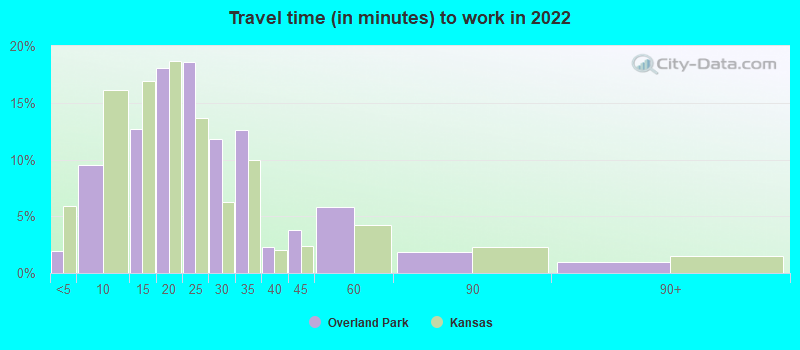
Travel time to work (commute)
- Less than 5 minutes: 2,131
- 5 to 9 minutes: 8,621
- 10 to 14 minutes: 12,507
- 15 to 19 minutes: 20,361
- 20 to 24 minutes: 15,092
- 25 to 29 minutes: 6,766
- 30 to 34 minutes: 9,413
- 35 to 39 minutes: 1,680
- 40 to 44 minutes: 1,054
- 45 to 59 minutes: 1,947
- 60 to 89 minutes: 442
- 90 or more minutes: 808
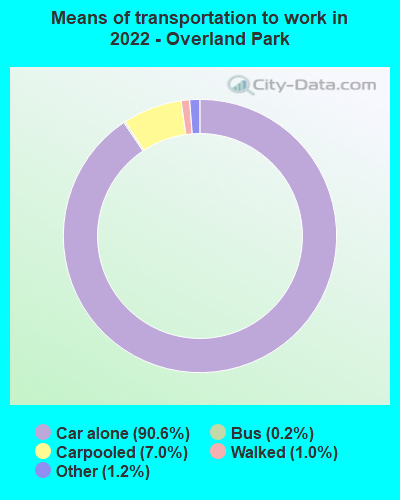
Means of transportation to work:
- Drove a car alone: 93,418 (70.6%)
- Carpooled: 6,775 (5.1%)
- Bus: 445 (0.3%)
- Ferryboat: 44 (0.0%)
- Taxi: 1,870 (1.4%)
- Bicycle: 51 (0.0%)
- Walked: 1,081 (0.8%)
- Worked at home: 28,804 (21.8%)
- Unemployment by race in 2022
- Unemployment rate for White non-Hispanic residents
- 2.4%Males
- 1.8%Females
- Unemployment rate for Black residents
- 6.4%Males
- 21.9%Females
- Unemployment rate for American Indian and Alaska Native residents
- 1.4%Females
- Unemployment rate for Asian residents
- 6.4%Females
- Unemployment rate for other race residents
- 8.3%Males
- Unemployment rate for two or more race residents
- 11.1%Males
- 4.9%Females
- Unemployment rate for Hispanic or Latino residents
- 3.1%Males
- 4.2%Females
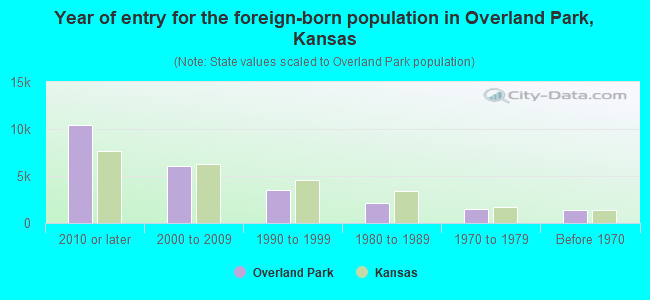
- Year of entry for the foreign-born population in Overland Park, Kansas
- 10,3752010 or later
- 6,0982000 to 2009
- 3,5271990 to 1999
- 2,1301980 to 1989
- 1,4781970 to 1979
- 1,391Before 1970
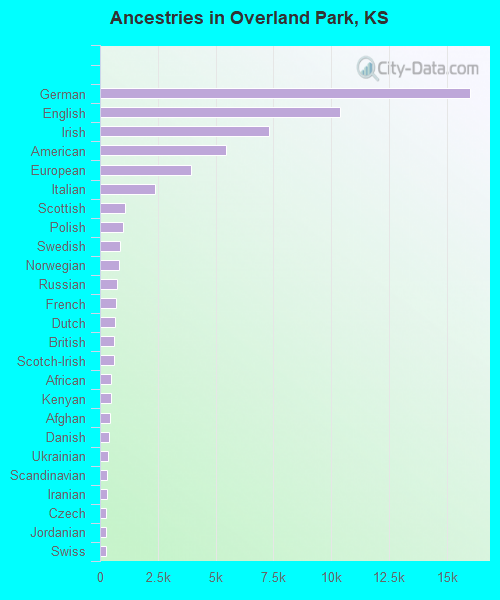
First ancestries reported:
- German: 16,030 (17.5%)
- English: 10,404 (11.3%)
- Irish: 7,330 (8.0%)
- American: 5,448 (5.9%)
- European: 3,953 (4.3%)
- Italian: 2,369 (2.6%)
- Scottish: 1,086 (1.2%)
- Polish: 989 (1.1%)
- Swedish: 877 (1.0%)
- Norwegian: 838 (0.9%)
- Russian: 748 (0.8%)
- French: 673 (0.7%)
- Dutch: 640 (0.7%)
- British: 600 (0.7%)
- Scotch-Irish: 589 (0.6%)
- African: 490 (0.5%)
- Kenyan: 466 (0.5%)
- Afghan: 424 (0.5%)
- Danish: 380 (0.4%)
- Ukrainian: 340 (0.4%)
- Scandinavian: 316 (0.3%)
- Iranian: 295 (0.3%)
- Czech: 255 (0.3%)
- Jordanian: 249 (0.3%)
- Swiss: 247 (0.3%)
- French Canadian: 232 (0.3%)
- Croatian: 227 (0.2%)
- Jamaican: 200 (0.2%)
- Eastern European: 178 (0.2%)
- Ugandan: 169 (0.2%)
- Welsh: 137 (0.1%)
- Austrian: 130 (0.1%)
- Northern European: 129 (0.1%)
- Israeli: 124 (0.1%)
- Palestinian: 120 (0.1%)
- Lebanese: 111 (0.1%)
- Greek: 101 (0.1%)
- Slovak: 100 (0.1%)
- Celtic: 93 (0.1%)
- Egyptian: 89 (0.10%)
- Iraqi: 88 (0.10%)
- Brazilian: 87 (0.09%)
- Hungarian: 85 (0.09%)
- Ethiopian: 75 (0.08%)
- Lithuanian: 74 (0.08%)
- Canadian: 69 (0.08%)
- Somali: 67 (0.07%)
- Arab: 66 (0.07%)
- Slovene: 51 (0.06%)
- Cajun: 50 (0.05%)
- Nigerian: 50 (0.05%)
- Haitian: 46 (0.05%)
- Romanian: 39 (0.04%)
- Albanian: 37 (0.04%)
- Czechoslovakian: 36 (0.04%)
- Belgian: 36 (0.04%)
- Turkish: 34 (0.04%)
- Portuguese: 31 (0.03%)
- South African: 27 (0.03%)
- West Indian: 23 (0.03%)
- Sudanese: 22 (0.02%)
- German Russian: 15 (0.02%)
- Finnish: 13 (0.01%)
- Australian: 13 (0.01%)
- Slavic: 12 (0.01%)
- Armenian: 10 (0.01%)
- Serbian: 7 (0.01%)
- Bulgarian: 6 (0.01%)
Most common places of birth for foreign-born residents (%):
| Overland Park: | 28.5% (6,526) |
| Kansas: | 6.5% (13,547) |
| Overland Park: | 9.2% (2,102) |
| Kansas: | 39.2% (81,282) |
| Overland Park: | 7.9% (1,812) |
| Kansas: | 3.9% (8,053) |
| Overland Park: | 3.5% (796) |
| Kansas: | 3.5% (7,355) |
| Overland Park: | 3.5% (790) |
| Kansas: | 1.6% (3,322) |
| Overland Park: | 3.4% (772) |
| Kansas: | 1.6% (3,345) |
| Overland Park: | 2.7% (608) |
| Kansas: | 5.5% (11,323) |
| Overland Park: | 2.4% (540) |
| Kansas: | 2.6% (5,492) |
| Overland Park: | 2.1% (478) |
| Kansas: | 0.6% (1,150) |
| Overland Park: | 1.8% (415) |
| Kansas: | 0.7% (1,401) |
| Overland Park: | 1.7% (386) |
| Kansas: | 0.7% (1,362) |
Place of birth for U.S.-born residents:
- This state: 73,929
- Other state: 99,700
- Northeast: 8,931
- Midwest: 60,382
- South: 19,187
- West: 11,200
83.7% of Overland Park residents lived in the same house 1 years ago.
Out of people who lived in different houses, 34.2% lived in this county.
Out of people who lived in different counties, 18.6% lived in Kansas.
| Overland Park: | 83.7% |
| State average: | 85.3% |
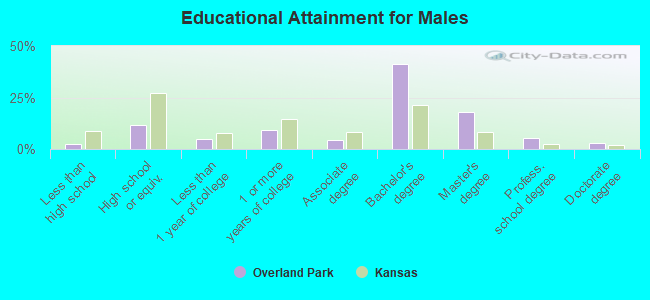
Education attainment for males 25 years and older:
- No schooling: 627
- Nursery to 4th grade: 0
- 5th and 6th grade: 67
- 7th and 8th grade: 0
- 9th grade: 3
- 10th grade: 58
- 11th grade: 36
- 12th grade, no diploma: 804
- High school graduate (or equivalency): 7,839
- Less than 1 year of college: 3,284
- Some college more than 1 year, no degree: 6,425
- Associate degree: 2,880
- Bachelor's degree: 28,311
- Master's degree: 12,444
- Professional school degree: 3,812
- Doctorate degree: 1,885
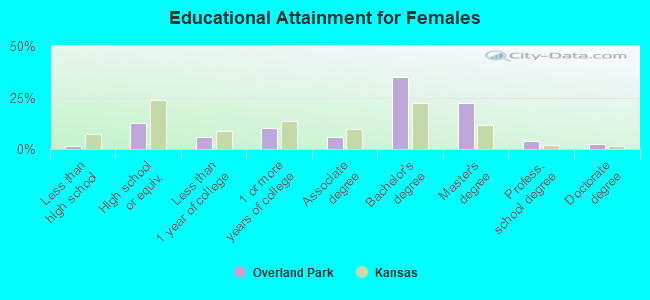
Education attainment for females 25 years and older:
- No schooling: 549
- Nursery to 4th grade: 0
- 5th and 6th grade: 0
- 7th and 8th grade: 62
- 9th grade: 0
- 10th grade: 0
- 11th grade: 147
- 12th grade, no diploma: 366
- High school graduate (or equivalency): 8,791
- Less than 1 year of college: 4,030
- Some college more than 1 year, no degree: 7,022
- Associate degree: 3,919
- Bachelor's degree: 24,405
- Master's degree: 15,681
- Professional school degree: 2,820
- Doctorate degree: 1,796
Housing units in structures:
- One, detached: 50,663
- One, attached: 7,992
- Two: 738
- 3 or 4: 5,461
- 5 to 9: 8,834
- 10 to 19: 6,870
- 20 to 49: 3,160
- 50 or more: 7,731
- Mobile homes: 111
Housing units lacking complete kitchen facilities in 2022: 1.8%
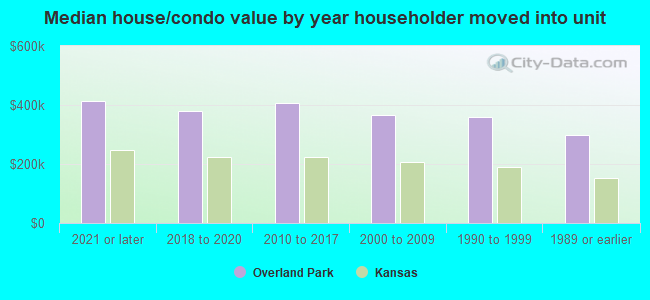
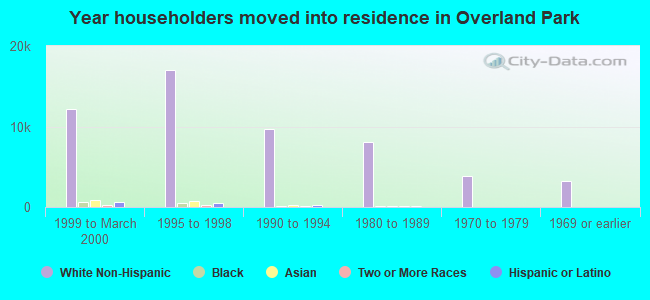
House/condo owner moved in on average 9 years ago
Renter moved in on average 1 years ago
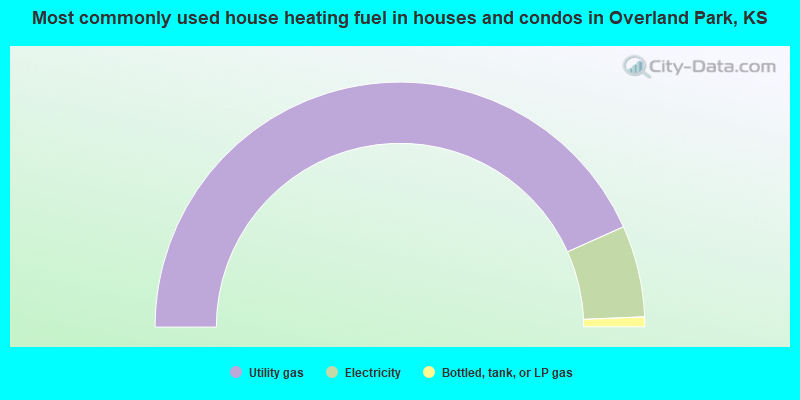
- 86.5%Utility gas
- 12.1%Electricity
- 1.3%Bottled, tank, or LP gas
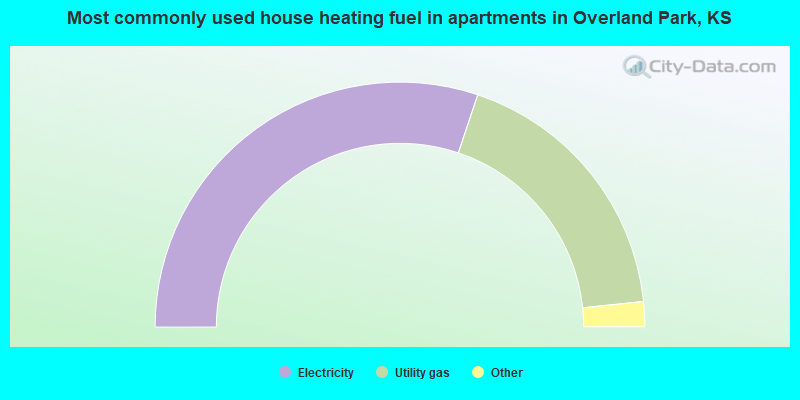
- 60.3%Electricity
- 36.4%Utility gas
- 2.0%Bottled, tank, or LP gas
- 0.8%No fuel used
- 0.2%Other fuel
- 0.1%Solar energy
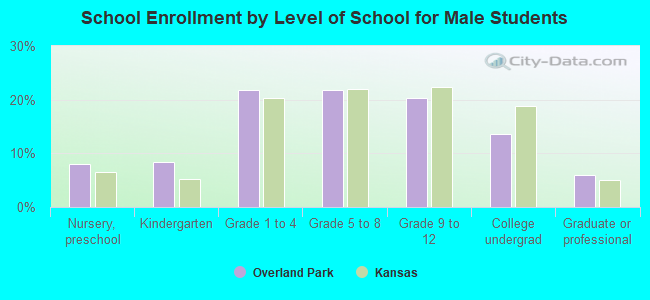
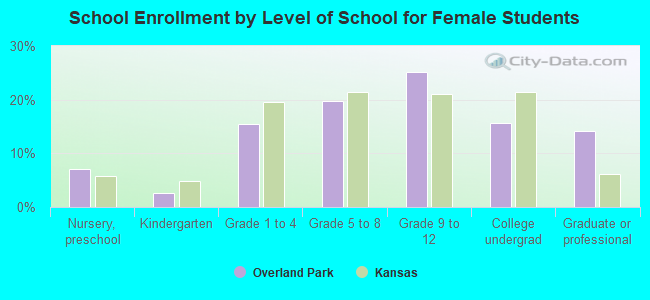
Private vs. public school enrollment:
| Here: | 16.1% |
| Kansas: | 14.1% |
| Here: | 10.2% |
| Kansas: | 10.8% |
| Here: | 16.7% |
| Kansas: | 15.4% |