Races in Overland Park, Kansas (KS) Detailed Stats
Data:
Races - White alone (%)
Races - White alone (% change since 2000)
Races - Black alone (%)
Races - Black alone (% change since 2000)
Races - American Indian alone (%)
Races - American Indian alone (% change since 2000)
Races - Asian alone (%)
Races - Asian alone (% change since 2000)
Races - Hispanic (%)
Races - Hispanic (% change since 2000)
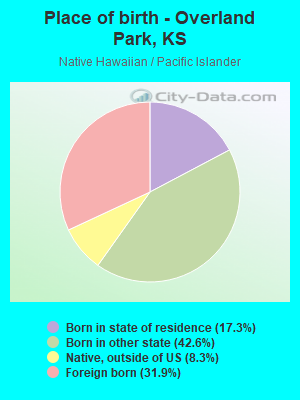
Races - Native Hawaiian and Other Pacific Islander alone (%)
Races - Native Hawaiian and Other Pacific Islander alone (% change since 2000)
Races - Two or more races(%)
Races - Two or more races(% change since 2000)
Races - Other race alone (%)
Races - Other race alone (% change since 2000)
Racial diversity
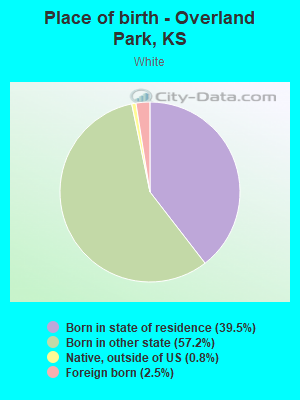
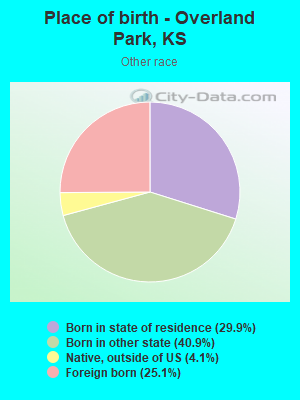
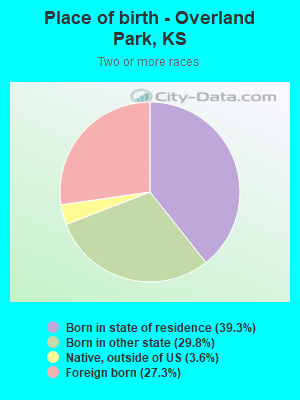
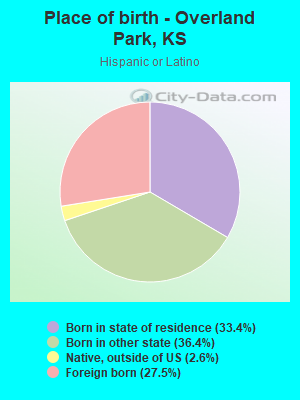
Place of birth - Born in state of residence (%)
Place of birth - Born in state of residence (%) - White
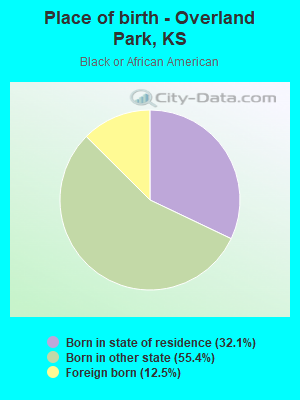
Place of birth - Born in state of residence (%) - Black or African American
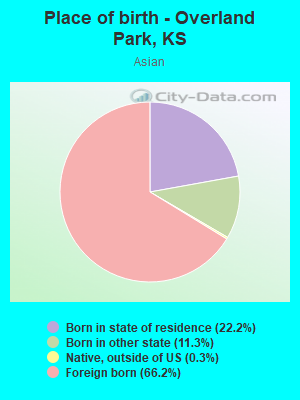
Place of birth - Born in state of residence (%) - Asian
Place of birth - Born in state of residence (%) - Hispanic or Latino
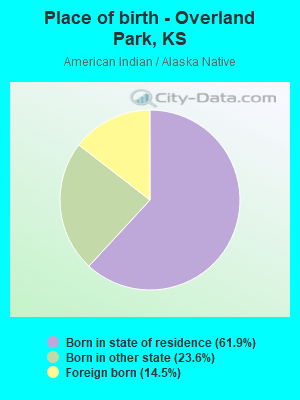
Place of birth - Born in state of residence (%) - American Indian and Alaska Native
Place of birth - Born in state of residence (%) - Multirace
Place of birth - Born in state of residence (%) - Other Race
Place of birth - Born in other state (%)
Place of birth - Born in other state (%) - White
Place of birth - Born in other state (%) - Black or African American
Place of birth - Born in other state (%) - Asian
Place of birth - Born in other state (%) - Hispanic or Latino
Place of birth - Born in other state (%) - American Indian and Alaska Native
Place of birth - Born in other state (%) - Multirace
Place of birth - Born in other state (%) - Other Race
Place of birth - Native, outside of US (%)
Place of birth - Native, outside of US (%) - White
Place of birth - Native, outside of US (%) - Black or African American
Place of birth - Native, outside of US (%) - Asian
Place of birth - Native, outside of US (%) - Hispanic or Latino
Place of birth - Native, outside of US (%) - American Indian and Alaska Native
Place of birth - Native, outside of US (%) - Multirace
Place of birth - Native, outside of US (%) - Other Race
Place of birth - Foreign born (%)
Place of birth - Foreign born (%) - White
Place of birth - Foreign born (%) - Black or African American
Place of birth - Foreign born (%) - Asian
Place of birth - Foreign born (%) - Hispanic or Latino
Place of birth - Foreign born (%) - American Indian and Alaska Native
Place of birth - Foreign born (%) - Multirace
Place of birth - Foreign born (%) - Other Race
Residents speaking English at home (%)
Residents speaking English at home - Born in the United States (%)
Residents speaking English at home - Native, born elsewhere (%)
Residents speaking English at home - Foreign born (%)
Residents speaking Spanish at home (%)
Residents speaking Spanish at home - Born in the United States (%)
Residents speaking Spanish at home - Native, born elsewhere (%)
Residents speaking Spanish at home - Foreign born (%)
Residents speaking other language at home (%)
Residents speaking other language at home - Born in the United States (%)
Residents speaking other language at home - Native, born elsewhere (%)
Residents speaking other language at home - Foreign born (%)
Marital status - Never married (%)
Marital status - Now married (%)
Marital status - Separated (%)
Marital status - Widowed (%)
Marital status - Divorced (%)
Ancestries Reported - Arab (%)
Ancestries Reported - Czech (%)
Ancestries Reported - Danish (%)
Ancestries Reported - Dutch (%)
Ancestries Reported - English (%)
Ancestries Reported - French (%)
Ancestries Reported - French Canadian (%)
Ancestries Reported - German (%)
Ancestries Reported - Greek (%)
Ancestries Reported - Hungarian (%)
Ancestries Reported - Irish (%)
Ancestries Reported - Italian (%)
Ancestries Reported - Lithuanian (%)
Ancestries Reported - Norwegian (%)
Ancestries Reported - Polish (%)
Ancestries Reported - Portuguese (%)
Ancestries Reported - Russian (%)
Ancestries Reported - Scotch-Irish (%)
Ancestries Reported - Scottish (%)
Ancestries Reported - Slovak (%)
Ancestries Reported - Subsaharan African (%)
Ancestries Reported - Swedish (%)
Ancestries Reported - Swiss (%)
Ancestries Reported - Ukrainian (%)
Ancestries Reported - United States (%)
Ancestries Reported - Welsh (%)
Ancestries Reported - West Indian (%)
Ancestries Reported - Other (%)
Geographical mobility - Same house 1 year ago (%)
Geographical mobility - Same house 1 year ago (%) - White
Geographical mobility - Same house 1 year ago (%) - Black or African American
Geographical mobility - Same house 1 year ago (%) - Asian
Geographical mobility - Same house 1 year ago (%) - Hispanic or Latino
Geographical mobility - Same house 1 year ago (%) - American Indian and Alaska Native
Geographical mobility - Same house 1 year ago (%) - Multirace
Geographical mobility - Same house 1 year ago (%) - Other Race
Geographical mobility - Moved within same county (%)
Geographical mobility - Moved within same county (%) - White
Geographical mobility - Moved within same county (%) - Black or African American
Geographical mobility - Moved within same county (%) - Asian
Geographical mobility - Moved within same county (%) - Hispanic or Latino
Geographical mobility - Moved within same county (%) - American Indian and Alaska Native
Geographical mobility - Moved within same county (%) - Multirace
Geographical mobility - Moved within same county (%) - Other Race
Geographical mobility - Moved from different county within same state (%)
Geographical mobility - Moved from different county within same state (%) - White
Geographical mobility - Moved from different county within same state (%) - Black or African American
Geographical mobility - Moved from different county within same state (%) - Asian
Geographical mobility - Moved from different county within same state (%) - Hispanic or Latino
Geographical mobility - Moved from different county within same state (%) - American Indian and Alaska Native
Geographical mobility - Moved from different county within same state (%) - Multirace
Geographical mobility - Moved from different county within same state (%) - Other Race
Geographical mobility - Moved from different state (%)
Geographical mobility - Moved from different state (%) - White
Geographical mobility - Moved from different state (%) - Black or African American
Geographical mobility - Moved from different state (%) - Asian
Geographical mobility - Moved from different state (%) - Hispanic or Latino
Geographical mobility - Moved from different state (%) - American Indian and Alaska Native
Geographical mobility - Moved from different state (%) - Multirace
Geographical mobility - Moved from different state (%) - Other Race
Geographical mobility - Moved from abroad (%)
Geographical mobility - Moved from abroad (%) - White
Geographical mobility - Moved from abroad (%) - Black or African American
Geographical mobility - Moved from abroad (%) - Asian
Geographical mobility - Moved from abroad (%) - Hispanic or Latino
Geographical mobility - Moved from abroad (%) - American Indian and Alaska Native
Geographical mobility - Moved from abroad (%) - Multirace
Geographical mobility - Moved from abroad (%) - Other Race
Place of birth for the foreign-born population - Ireland (%)
Place of birth for the foreign-born population - Denmark (%)
Place of birth for the foreign-born population - Norway (%)
Place of birth for the foreign-born population - Sweden (%)
Place of birth for the foreign-born population - United Kingdom (%)
Place of birth for the foreign-born population - England (%)
Place of birth for the foreign-born population - Scotland (%)
Place of birth for the foreign-born population - Other Northern Europe (%)
Place of birth for the foreign-born population - Austria (%)
Place of birth for the foreign-born population - Belgium (%)
Place of birth for the foreign-born population - France (%)
Place of birth for the foreign-born population - Germany (%)
Place of birth for the foreign-born population - Netherlands (%)
Place of birth for the foreign-born population - Switzerland (%)
Place of birth for the foreign-born population - Other Western Europe (%)
Place of birth for the foreign-born population - Greece (%)
Place of birth for the foreign-born population - Italy (%)
Place of birth for the foreign-born population - Portugal (%)
Place of birth for the foreign-born population - Spain (%)
Place of birth for the foreign-born population - Other Southern Europe (%)
Place of birth for the foreign-born population - Albania (%)
Place of birth for the foreign-born population - Belarus (%)
Place of birth for the foreign-born population - Bosnia and Herzegovina (%)
Place of birth for the foreign-born population - Bulgaria (%)
Place of birth for the foreign-born population - Croatia (%)
Place of birth for the foreign-born population - Czechoslovakia (%)
Place of birth for the foreign-born population - Hungary (%)
Place of birth for the foreign-born population - Latvia (%)
Place of birth for the foreign-born population - Lithuania (%)
Place of birth for the foreign-born population - North Macedonia (Macedonia) (%)
Place of birth for the foreign-born population - Moldova (%)
Place of birth for the foreign-born population - Poland (%)
Place of birth for the foreign-born population - Romania (%)
Place of birth for the foreign-born population - Russia (%)
Place of birth for the foreign-born population - Serbia (%)
Place of birth for the foreign-born population - Ukraine (%)
Place of birth for the foreign-born population - Other Eastern Europe (%)
Place of birth for the foreign-born population - China (%)
Place of birth for the foreign-born population - Hong Kong (%)
Place of birth for the foreign-born population - Taiwan (%)
Place of birth for the foreign-born population - Japan (%)
Place of birth for the foreign-born population - Korea (%)
Place of birth for the foreign-born population - Other Eastern Asia (%)
Place of birth for the foreign-born population - Afghanistan (%)
Place of birth for the foreign-born population - Bangladesh (%)
Place of birth for the foreign-born population - India (%)
Place of birth for the foreign-born population - Iran (%)
Place of birth for the foreign-born population - Kazakhstan (%)
Place of birth for the foreign-born population - Nepal (%)
Place of birth for the foreign-born population - Pakistan (%)
Place of birth for the foreign-born population - Sri Lanka (%)
Place of birth for the foreign-born population - Uzbekistan (%)
Place of birth for the foreign-born population - Other South Central Asia (%)
Place of birth for the foreign-born population - Burma (%)
Place of birth for the foreign-born population - Cambodia (%)
Place of birth for the foreign-born population - Indonesia (%)
Place of birth for the foreign-born population - Laos (%)
Place of birth for the foreign-born population - Malaysia (%)
Place of birth for the foreign-born population - Philippines (%)
Place of birth for the foreign-born population - Singapore (%)
Place of birth for the foreign-born population - Thailand (%)
Place of birth for the foreign-born population - Vietnam (%)
Place of birth for the foreign-born population - Other South Eastern Asia (%)
Place of birth for the foreign-born population - Armenia (%)
Place of birth for the foreign-born population - Iraq (%)
Place of birth for the foreign-born population - Israel (%)
Place of birth for the foreign-born population - Jordan (%)
Place of birth for the foreign-born population - Kuwait (%)
Place of birth for the foreign-born population - Lebanon (%)
Place of birth for the foreign-born population - Saudi Arabia (%)
Place of birth for the foreign-born population - Syria (%)
Place of birth for the foreign-born population - Turkey (%)
Place of birth for the foreign-born population - Yemen (%)
Place of birth for the foreign-born population - Other Western Asia (%)
Place of birth for the foreign-born population - Eritrea (%)
Place of birth for the foreign-born population - Ethiopia (%)
Place of birth for the foreign-born population - Kenya (%)
Place of birth for the foreign-born population - Somalia (%)
Place of birth for the foreign-born population - Uganda (%)
Place of birth for the foreign-born population - Zimbabwe (%)
Place of birth for the foreign-born population - Other Eastern Africa (%)
Place of birth for the foreign-born population - Cameroon (%)
Place of birth for the foreign-born population - Congo (%)
Place of birth for the foreign-born population - Democratic Republic of Congo (Zaire) (%)
Place of birth for the foreign-born population - Other Middle Africa (%)
Place of birth for the foreign-born population - Egypt (%)
Place of birth for the foreign-born population - Morocco (%)
Place of birth for the foreign-born population - Sudan (%)
Place of birth for the foreign-born population - Other Northern Africa (%)
Place of birth for the foreign-born population - South Africa (%)
Place of birth for the foreign-born population - Other Southern Africa (%)
Place of birth for the foreign-born population - Cabo Verde (%)
Place of birth for the foreign-born population - Ghana (%)
Place of birth for the foreign-born population - Liberia (%)
Place of birth for the foreign-born population - Nigeria (%)
Place of birth for the foreign-born population - Senegal (%)
Place of birth for the foreign-born population - Sierra Leone (%)
Place of birth for the foreign-born population - Other Western Africa (%)
Place of birth for the foreign-born population - Australia (%)
Place of birth for the foreign-born population - New Zealand (%)
Place of birth for the foreign-born population - Fiji (%)
Place of birth for the foreign-born population - Micronesia (%)
Place of birth for the foreign-born population - Bahamas (%)
Place of birth for the foreign-born population - Barbados (%)
Place of birth for the foreign-born population - Cuba (%)
Place of birth for the foreign-born population - Dominica (%)
Place of birth for the foreign-born population - Dominican Republic (%)
Place of birth for the foreign-born population - Grenada (%)
Place of birth for the foreign-born population - Haiti (%)
Place of birth for the foreign-born population - Jamaica (%)
Place of birth for the foreign-born population - St. Vincent and the Grenadines (%)
Place of birth for the foreign-born population - Trinidad and Tobago (%)
Place of birth for the foreign-born population - West Indies (%)
Place of birth for the foreign-born population - Other Caribbean (%)
Place of birth for the foreign-born population - Belize (%)
Place of birth for the foreign-born population - Costa Rica (%)
Place of birth for the foreign-born population - El Salvador (%)
Place of birth for the foreign-born population - Guatemala (%)
Place of birth for the foreign-born population - Honduras (%)
Place of birth for the foreign-born population - Mexico (%)
Place of birth for the foreign-born population - Nicaragua (%)
Place of birth for the foreign-born population - Panama (%)
Place of birth for the foreign-born population - Other Central America (%)
Place of birth for the foreign-born population - Argentina (%)
Place of birth for the foreign-born population - Bolivia (%)
Place of birth for the foreign-born population - Brazil (%)
Place of birth for the foreign-born population - Chile (%)
Place of birth for the foreign-born population - Colombia (%)
Place of birth for the foreign-born population - Ecuador (%)
Place of birth for the foreign-born population - Guyana (%)
Place of birth for the foreign-born population - Peru (%)
Place of birth for the foreign-born population - Uruguay (%)
Place of birth for the foreign-born population - Venezuela (%)
Place of birth for the foreign-born population - Other South America (%)
Place of birth for the foreign-born population - Canada (%)
Place of birth for the foreign-born population - Other Northern America (%)
Place of birth for the foreign-born population - Other (%)
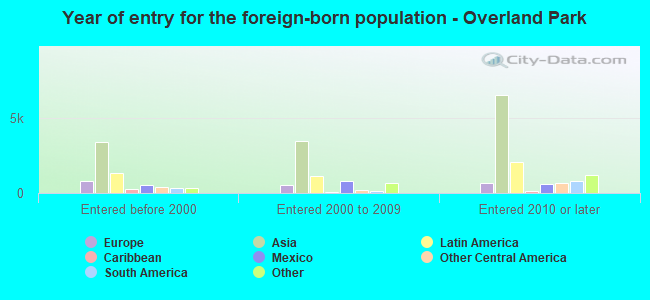
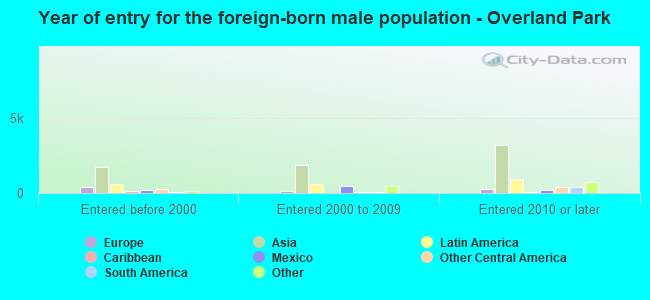
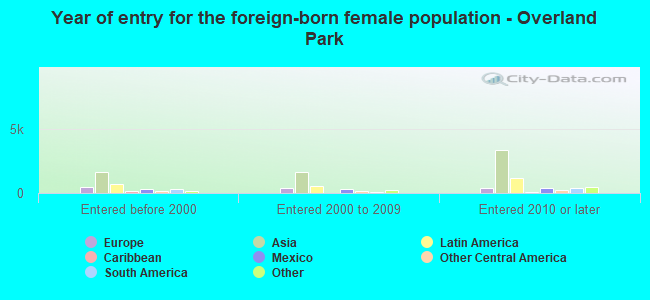
According to 2022 data, the most numerous races in Overland Park, KS are White alone (145,809 residents), Hispanic (16,669 residents), and Black alone (9,686 residents). 85.2% of Overland Park residents speak English at home. 11.5% of Overland Park, KS residents are foreign-born (6.9% born in Asia, 2.3% born in Latin America), which is 39.0% greater than the foreign-born rate of 7.0% across the entire state of Kansas.
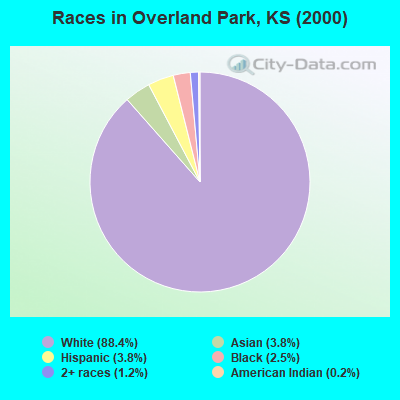
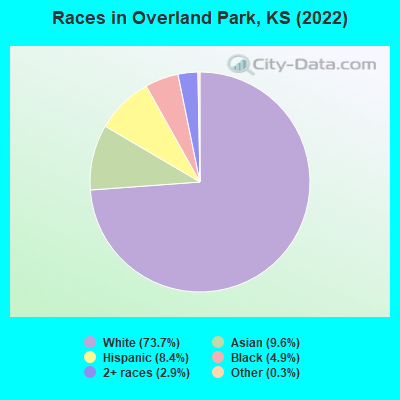
Race distribution in Overland Park
2000 2022
131,782 88.4% White alone 5,620 3.8% Hispanic 5,687 3.8% Asian alone 3,729 2.5% Black alone 1,736 1.2% Two or more races 349 0.2% American Indian alone 126 0.08% Other race alone 51 0.03% Native Hawaiian and Other
145,809 73.7% White alone 18,980 9.6% Asian alone 16,669 8.4% Hispanic 9,686 4.9% Black alone 5,805 2.9% Two or more races 691 0.3% Other race alone 71 0.04% American Indian alone 36 0.02% Native Hawaiian and Other
2000 2022
2,233,997 83.1% White alone 188,252 7.0% Hispanic 151,407 5.6% Black alone 46,301 1.7% Asian alone 42,508 1.6% Two or more races 22,322 0.8% American Indian alone 2,477 0.09% Other race alone 1,154 0.04% Native Hawaiian and Other
2,147,943 73.1% White alone 381,746 13.0% Hispanic 147,666 5.0% Black alone 145,362 4.9% Two or more races 85,085 2.9% Asian alone 13,263 0.5% Other race alone 12,065 0.4% American Indian alone 4,020 0.1% Native Hawaiian and Other
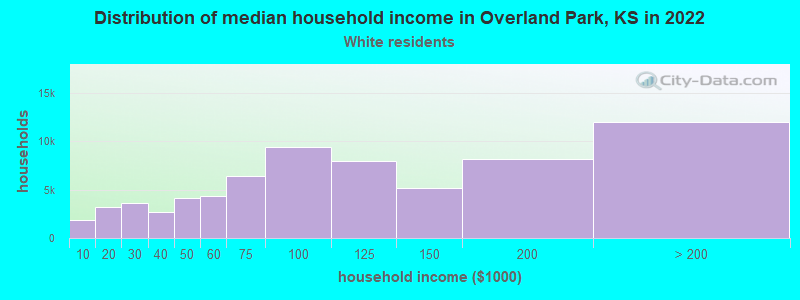
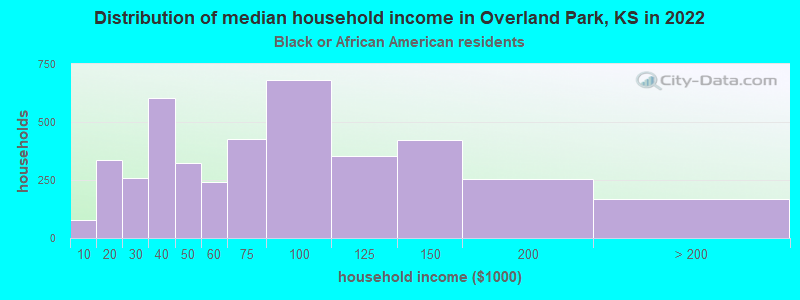
Income and house value in Overland Park Median household income in 2022 $96,307 White non-Hispanic householders$74,799 Black householders$125,464 Asian householders$76,103 Some other race householders$102,043 Two or more races householders$97,287 Hispanic or Latino race householdersMedian 2022 house value $378,719 White Non-Hispanic householders$428,967 Black or African American householders$297,997 American Indian or Alaska Native householders $386,629 Asian householders$349,641 Some other race householders$326,145 Two or more races householders$342,429 Hispanic or Latino householders
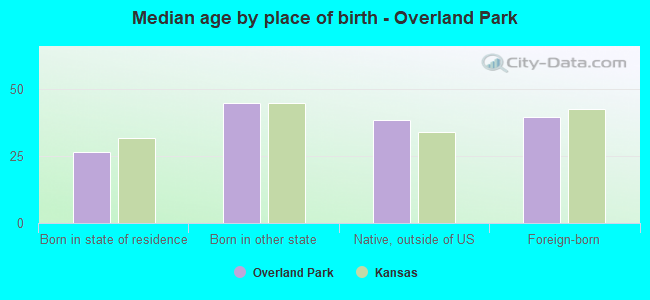
Median age by race in Overland Park
40.1 Median age for White residents39.3 41.0 35.1 Median age for Black or African American residents32.4 38.6 37.5 Median age for American Indian / Alaska Native residents-666,666,666.0 -666,666,666.0 33.2 Median age for Asian residents33.2 33.1 -666,666,666.0 Median age for Native Hawaiian / Pacific Islander residents-666,666,666.0 -666,666,666.0 38.8 Median age for Other race residents34.9 38.9 22.7 Median age for Two or more races residents22.8 22.6 40.6 Median age for White alone residents40.1 41.4 27.0 Median age for Hispanic or Latino residents23.7 28.8
Owner/renter occupied households by race in Overland Park
House owners and renters - White residents 44,027 63.9% Owner occupied24,904 36.1% Renter occupiedHouse owners and renters - Black or African American residents 827 18.4% Owner occupied3,674 81.6% Renter occupiedHouse owners and renters - American Indian / Alaska Native residents 103 59.6% Owner occupied70 40.4% Renter occupiedHouse owners and renters - Asian residents 4,053 61.3% Owner occupied2,559 38.7% Renter occupiedHouse owners and renters - Native Hawaiian / Pacific Islander residents 14 32.8% Owner occupied29 67.2% Renter occupiedHouse owners and renters - Other race residents 343 25.9% Owner occupied980 74.1% Renter occupiedHouse owners and renters - Two or more races residents 1,617 38.8% Owner occupied2,552 61.2% Renter occupiedHouse owners and renters - White alone residents 43,141 63.9% Owner occupied24,414 36.1% Renter occupiedHouse owners and renters - Hispanic or Latino residents 1,952 39.9% Owner occupied2,942 60.1% Renter occupied
Language usage in Overland Park
English speakers - Total 85.2% of residents of Overland Park speak English at home.
4.6% of residents speak Spanish at home 6,723 77.8% Speak English very well1,913 22.2% Speak English less than very well10.2% of residents speak other language at home 14,097 74.6% Speak English very well4,790 25.4% Speak English less than very well
English speakers - Born in the United States 95.2% of residents of Overland Park speak English at home.
2.8% of residents speak Spanish at home 2,642 97.9% Speak English very well58 2.1% Speak English less than very well2.0% of residents speak other language at home 1,635 85.6% Speak English very well274 14.4% Speak English less than very well
English speakers - Native, born elsewhere 69.4% of residents of Overland Park speak English at home.
20.8% of residents speak Spanish at home 286 73.7% Speak English very well102 26.3% Speak English less than very well9.8% of residents speak other language at home 96 52.5% Speak English very well87 47.5% Speak English less than very well
English speakers - Foreign-born 14.5% of residents of Overland Park speak English at home.
19.8% of residents speak Spanish at home 2,854 65.3% Speak English very well1,516 34.7% Speak English less than very well65.7% of residents speak other language at home 10,471 72.3% Speak English very well4,004 27.7% Speak English less than very well
White (Caucasian) - Speak only English Native:
96.8% (134,550)Foreign-born:
45.4% (1,705)
White (Caucasian) - Speak another language Native:
3.2% (4,429)Foreign-born:
54.6% (2,053)
Black or African American - Speak only English Native:
95.5% (7,152)Foreign-born:
6.5% (108)
Black or African American - Speak another language Native:
4.5% (337)Foreign-born:
97.5% (1,611)
American Indian / Alaska Native - Speak another language Native:
31.9% (85)Foreign-born:
100.0% (53)
Asian - Speak only English Native:
62.5% (3,254)Foreign-born:
8.1% (1,001)
Asian - Speak another language Native:
37.5% (1,953)Foreign-born:
91.9% (11,360)
Native Hawaiian / Pacific Islander - Speak only English Native:
60.0% (113)Foreign-born:
16.5% (15)
Native Hawaiian / Pacific Islander - Speak another language Native:
14.0% (26)Foreign-born:
57.3% (52)
Other race - Speak only English Native:
73.7% (1,991)Foreign-born:
20.2% (183)
Other race - Speak another language Native:
26.3% (709)Foreign-born:
79.8% (722)
Two or more races - Speak only English Native:
84.2% (7,113)Foreign-born:
8.1% (306)
Two or more races - Speak another language Native:
15.8% (1,334)Foreign-born:
91.9% (3,487)
White alone - Speak only English Native:
97.3% (130,914)Foreign-born:
48.2% (1,663)
White alone - Speak another language Native:
2.7% (3,666)Foreign-born:
51.8% (1,788)
Hispanic or Latino - Speak only English Native:
73.8% (7,827)Foreign-born:
5.5% (253)
Hispanic or Latino - Speak another language Native:
26.2% (2,780)Foreign-born:
94.5% (4,336)
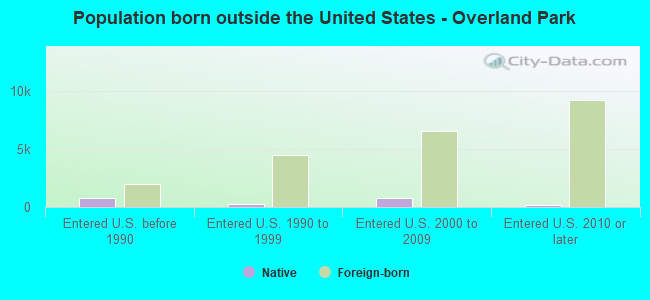
Foreign-born residents in Overland Park 22,887 residents are foreign born (6.9% Asia , 2.3% Latin America ).
This city:
11.5%Kansas:
7.1%
Marital status for residents in Overland Park Marital status - White (Caucasian) population 15 years and over
Males 35.0% Never married54.8% Now married0.5% Separated2.5% Widowed7.2% DivorcedFemales 27.7% Never married51.0% Now married0.8% Separated7.2% Widowed13.4% DivorcedWomen who gave birth in the past 12 months Now married:
93.5% (1,928)Unmarried:
6.5% (134)
Women who did not give birth in the past 12 months Now married:
44.4% (14,339)Unmarried:
55.6% (17,923)
Marital status - Black or African American population 15 years and over
Males 49.1% Never married35.4% Now married1.9% Separated0.0% Widowed13.6% DivorcedFemales 42.4% Never married33.9% Now married0.0% Separated16.7% Widowed7.0% DivorcedWomen who gave birth in the past 12 months Now married:
32.8% (46)Unmarried:
67.2% (94)
Women who did not give birth in the past 12 months Now married:
31.2% (872)Unmarried:
68.8% (1,926)
Marital status - American Indian / Alaska Native population 15 years and over
Males 18.6% Never married71.2% Now married1.7% Separated0.0% Widowed8.5% DivorcedFemales 23.9% Never married69.4% Now married0.0% Separated0.7% Widowed6.0% DivorcedWomen who did not give birth in the past 12 months Now married:
54.9% (44)Unmarried:
45.1% (36)
Marital status - Asian population 15 years and over
Males 27.0% Never married67.4% Now married0.0% Separated2.6% Widowed3.0% DivorcedFemales 30.5% Never married59.1% Now married1.4% Separated4.6% Widowed4.5% DivorcedWomen who gave birth in the past 12 months Now married:
100.0% (272)Unmarried:
0.0% (0)
Women who did not give birth in the past 12 months Now married:
54.1% (3,239)Unmarried:
45.9% (2,743)
Marital status - Native Hawaiian / Pacific Islander population 15 years and over
Males 41.5% Never married44.6% Now married13.8% Separated0.0% Widowed0.0% DivorcedFemales 0.0% Never married100.0% Now married0.0% Separated0.0% Widowed0.0% DivorcedWomen who gave birth in the past 12 months Now married:
100.0% (23)Unmarried:
0.0% (0)
Women who did not give birth in the past 12 months Now married:
100.0% (12)Unmarried:
0.0% (0)
Marital status - Other race population 15 years and over
Males 30.7% Never married58.4% Now married3.8% Separated0.0% Widowed7.1% DivorcedFemales 36.7% Never married41.4% Now married2.3% Separated3.1% Widowed16.5% DivorcedWomen who gave birth in the past 12 months Now married:
0.0% (0)Unmarried:
100.0% (56)
Women who did not give birth in the past 12 months Now married:
39.3% (521)Unmarried:
60.7% (803)
Marital status - Two or more races population 15 years and over
Males 33.3% Never married50.8% Now married0.0% Separated2.2% Widowed13.6% DivorcedFemales 34.6% Never married47.9% Now married3.6% Separated5.8% Widowed8.1% DivorcedWomen who gave birth in the past 12 months Now married:
91.1% (103)Unmarried:
8.9% (10)
Women who did not give birth in the past 12 months Now married:
41.6% (1,383)Unmarried:
58.4% (1,939)
Marital status - White alone, not Hispanic / Latino population 15 years and over
Males 33.5% Never married55.9% Now married0.5% Separated2.6% Widowed7.5% DivorcedFemales 28.1% Never married50.4% Now married0.8% Separated7.2% Widowed13.5% DivorcedWomen who gave birth in the past 12 months Now married:
100.0% (1,878)Unmarried:
0.0% (0)
Women who did not give birth in the past 12 months Now married:
43.4% (13,629)Unmarried:
56.6% (17,758)
Marital status - Hispanic or Latino population 15 years and over
Males 53.6% Never married40.5% Now married1.2% Separated0.0% Widowed4.8% DivorcedFemales 35.6% Never married47.4% Now married2.0% Separated4.5% Widowed10.5% DivorcedWomen who gave birth in the past 12 months Now married:
55.8% (118)Unmarried:
44.2% (93)
Women who did not give birth in the past 12 months Now married:
45.4% (1,641)Unmarried:
54.6% (1,975)
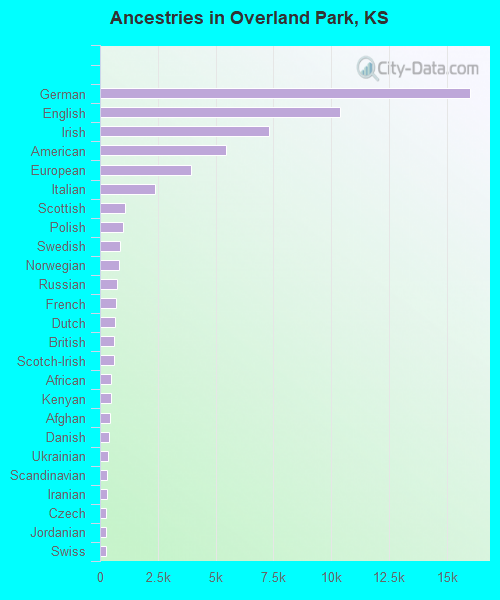
Ancestries in Overland Park
16,030 17.5% German10,404 11.3% English7,330 8.0% Irish5,448 5.9% American3,953 4.3% European2,369 2.6% Italian1,086 1.2% Scottish989 1.1% Polish877 1.0% Swedish838 0.9% Norwegian748 0.8% Russian673 0.7% French640 0.7% Dutch600 0.7% British589 0.6% Scotch-Irish490 0.5% African466 0.5% Kenyan424 0.5% Afghan380 0.4% Danish340 0.4% Ukrainian316 0.3% Scandinavian295 0.3% Iranian255 0.3% Czech249 0.3% Jordanian247 0.3% Swiss232 0.3% French Canadian227 0.2% Croatian200 0.2% Jamaican178 0.2% Eastern European169 0.2% Ugandan137 0.1% Welsh130 0.1% Austrian129 0.1% Northern European124 0.1% Israeli120 0.1% Palestinian111 0.1% Lebanese101 0.1% Greek100 0.1% Slovak93 0.1% Celtic89 0.10% Egyptian88 0.10% Iraqi87 0.09% Brazilian85 0.09% Hungarian75 0.08% Ethiopian74 0.08% Lithuanian69 0.08% Canadian67 0.07% Somali66 0.07% Arab51 0.06% Slovene50 0.05% Cajun50 0.05% Nigerian46 0.05% Haitian39 0.04% Romanian37 0.04% Albanian36 0.04% Czechoslovakian36 0.04% Belgian34 0.04% Turkish31 0.03% Portuguese27 0.03% South African23 0.03% West Indian22 0.02% Sudanese15 0.02% German Russian13 0.01% Finnish13 0.01% Australian12 0.01% Slavic10 0.01% Armenian7 0.01% Serbian6 0.01% Bulgarian
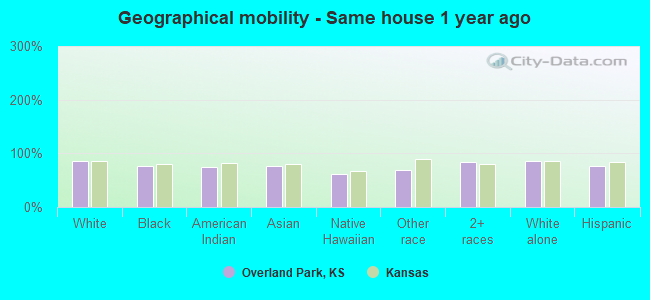
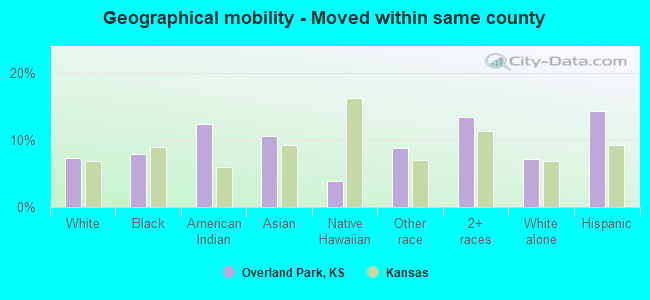
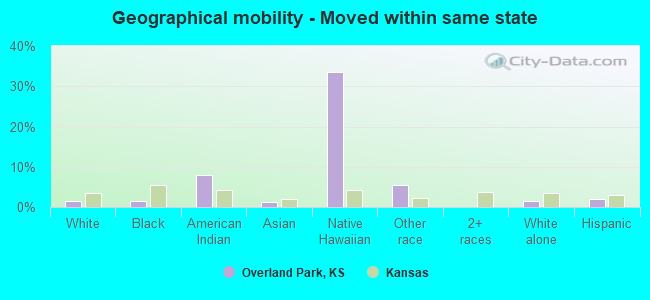
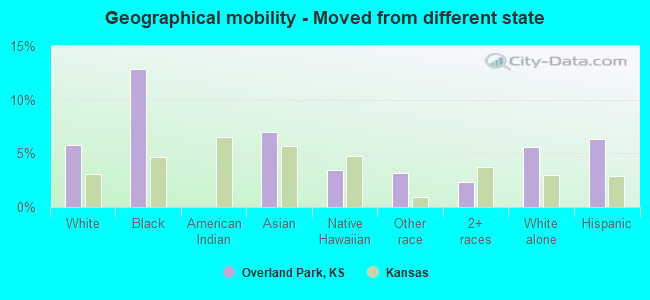
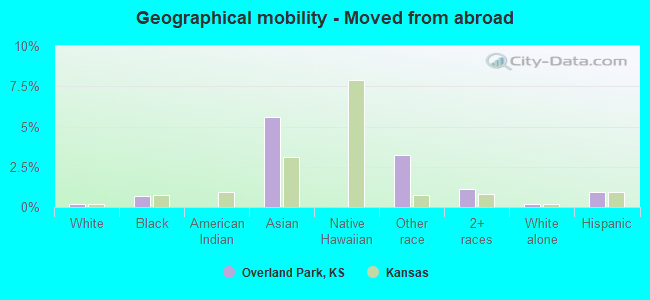
Geographical mobility in Overland Park Same house 1 year ago 127,250 85.2% White (Caucasian)7,531 77.1% Black or African American258 74.6% American Indian / Alaska Native14,294 75.7% Asian93 61.1% Native Hawaiian / Pacific Islander2,879 68.5% Other race11,189 83.2% Two or more races123,534 85.7% White alone, not Hispanic / Latino12,545 76.5% Hispanic or LatinoMoved within same county 10,862 7.3% White / Caucasian765 7.8% Black or African American43 12.3% American Indian / Alaska Native1,997 10.6% Asian6 3.9% Native Hawaiian / Pacific Islander369 8.8% Other race1,796 13.4% Two or more races10,239 7.1% White alone, not Hispanic / Latino2,351 14.3% Hispanic or LatinoMoved within same state 2,340 1.6% White / Caucasian156 1.6% Black or African American28 8.1% American Indian / Alaska Native217 1.1% Asian51 33.5% Native Hawaiian / Pacific Islander225 5.3% Other race2,024 1.4% White alone, not Hispanic / Latino316 1.9% Hispanic or LatinoMoved from different state 8,655 5.8% White / Caucasian1,254 12.8% Black or African American1,318 7.0% Asian5 3.4% Native Hawaiian / Pacific Islander135 3.2% Other race315 2.3% Two or more races8,051 5.6% White alone, not Hispanic / Latino1,037 6.3% Hispanic or LatinoMoved from abroad 299 0.2% White67 0.7% Black or African American1,055 5.6% Asian136 3.2% Other race149 1.1% Two or more races299 0.2% White alone, not Hispanic / Latino149 0.9% Hispanic or Latino
Children Nativity (place of birth) in Overland Park
Children under 6 years - Living with two parents Both parents native 9,540 99.5% Native44 0.5% Foreign-bornBoth parents foreign-born 1,626 90.6% Native168 9.4% Foreign-bornOne native, one foreign-born parent 933 100.0% NativeChildren under 6 years - Living with one parent Native parent 1,011 100.0% NativeForeign-born parent 145 100.0% NativeChildren 6 to 17 years - Living with two parents Both parents native 15,392 99.1% Native137 0.9% Foreign-bornBoth parents foreign-born 2,789 77.6% Native805 22.4% Foreign-bornOne native, one foreign-born parent 1,970 100.0% NativeChildren 6 to 17 years - Living with one parent Native parent 4,019 100.0% NativeForeign-born parent 924 57.3% Native688 42.7% Foreign-born
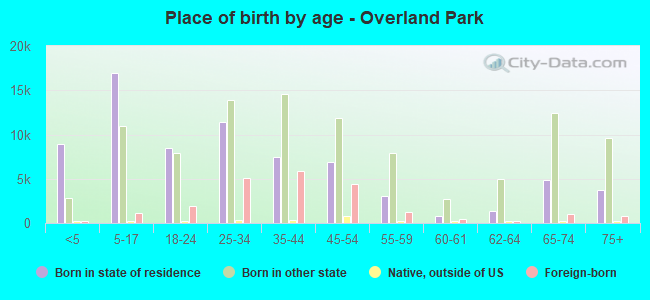
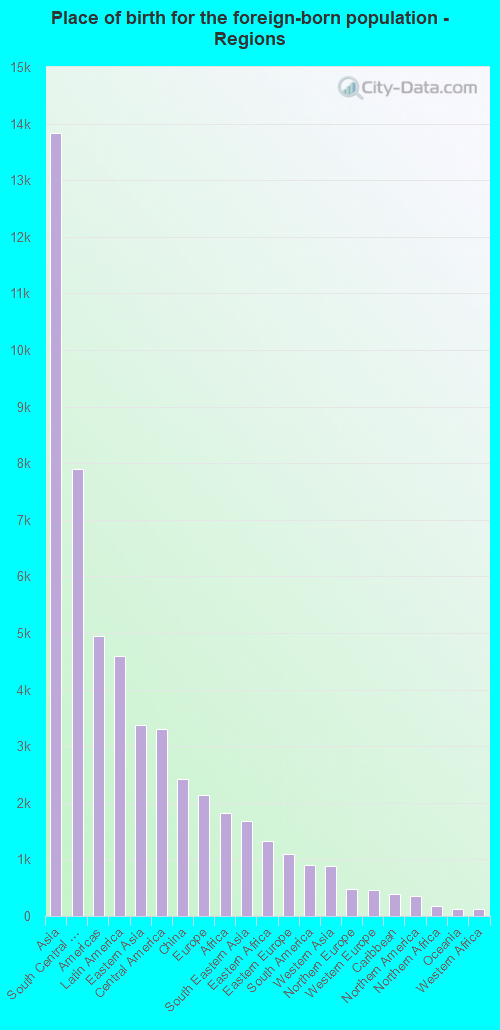
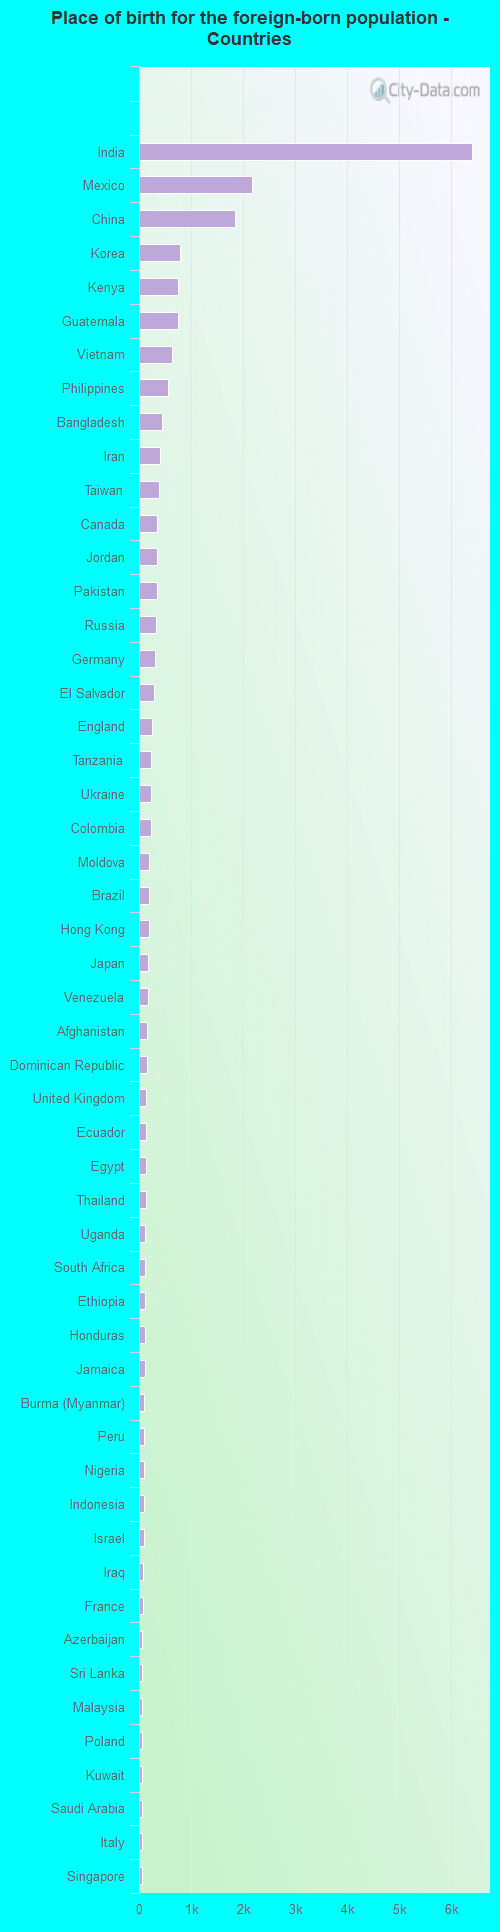
Place of birth for residents in Overland Park 13,839 Asia7,894 South Central Asia4,952 Americas4,601 Latin America3,375 Eastern Asia3,306 Central America2,423 China2,136 Europe1,827 Africa1,677 South Eastern Asia1,325 Eastern Africa1,101 Eastern Europe907 South America880 Western Asia470 Northern Europe457 Western Europe387 Caribbean350 Northern America172 Northern Africa131 Oceania129 Western Africa115 Southern Africa107 Southern Europe98 Australia and New Zealand Subregion73 Middle Africa6,405 India2,162 Mexico1,845 China780 Korea756 Kenya744 Guatemala629 Vietnam551 Philippines449 Bangladesh406 Iran392 Taiwan350 Canada344 Jordan339 Pakistan325 Russia302 Germany284 El Salvador254 England239 Tanzania230 Ukraine229 Colombia191 Moldova188 Brazil185 Hong Kong172 Japan172 Venezuela160 Afghanistan154 Dominican Republic142 United Kingdom129 Ecuador128 Egypt126 Thailand118 Uganda115 South Africa114 Ethiopia106 Honduras106 Jamaica104 Burma (Myanmar)97 Peru93 Nigeria91 Indonesia87 Israel83 Iraq69 France67 Azerbaijan66 Sri Lanka65 Malaysia65 Poland63 Kuwait63 Saudi Arabia60 Italy59 Singapore57 Ireland53 Cameroon53 Australia52 Haiti50 Albania49 Turkey49 Argentina48 Nepal46 Spain46 Romania45 New Zealand42 Syria42 Netherlands38 Belarus35 Sudan35 Switzerland35 Hungary31 Zimbabwe27 Lebanon27 Laos24 Yemen22 Czechoslovakia22 Cambodia21 Cuba19 Bahamas19 Guyana18 Croatia17 Somalia15 Bulgaria15 Georgia12 Fiji11 St. Lucia10 United Arab Emirates9 Panama9 Bosnia and Herzegovina8 Denmark7 Austria7 Scotland5 Uzbekistan
Grandparents responsible for own grandchildren in Overland Park
Grandparents (30 to 59 years) White / Caucasian 216 51.1% Responsible for grandchildren207 48.9% Not responsible for grandchildrenBlack or African American 9 9.2% Responsible for grandchildren89 90.8% Not responsible for grandchildrenAsian 171 100.0% Not responsible for grandchildrenOther race 34 60.0% Responsible for grandchildren23 40.0% Not responsible for grandchildrenTwo or more races 26 100.0% Not responsible for grandchildrenWhite alone, not Hispanic / Latino 199 51.9% Responsible for grandchildren184 48.1% Not responsible for grandchildrenHispanic or Latino 42 33.4% Responsible for grandchildren84 66.6% Not responsible for grandchildrenGrandparents (60 years and over) White / Caucasian 337 33.0% Responsible for grandchildren684 67.0% Not responsible for grandchildrenBlack or African American 202 90.8% Responsible for grandchildren20 9.2% Not responsible for grandchildrenAsian 25 6.7% Responsible for grandchildren351 93.3% Not responsible for grandchildrenOther race 92 90.1% Responsible for grandchildren10 9.9% Not responsible for grandchildrenTwo or more races 51 100.0% Not responsible for grandchildrenWhite alone, not Hispanic / Latino 338 31.3% Responsible for grandchildren739 68.7% Not responsible for grandchildrenHispanic or Latino 55 88.9% Responsible for grandchildren7 11.1% Not responsible for grandchildren