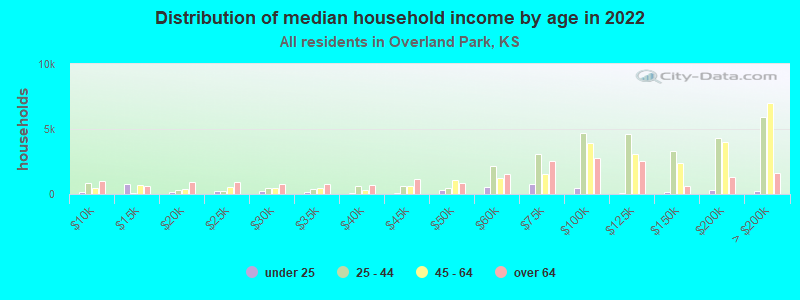
The median household income in Overland Park, KS in 2022 was $96,694, which was 28.7% greater than the median annual income of $68,925 across the entire state of Kansas. Compared to the median income of $62,116 in 2000 this represents an increase of 35.8%. The per capita income in 2022 was $57,734, which means an increase of 44.5% compared to 2000 when it was $32,069.
Whole page based on the data from 2000 / 2022 when the population of Overland Park, Kansas was 149,080 / 197,747
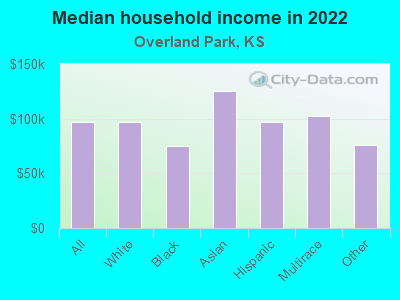
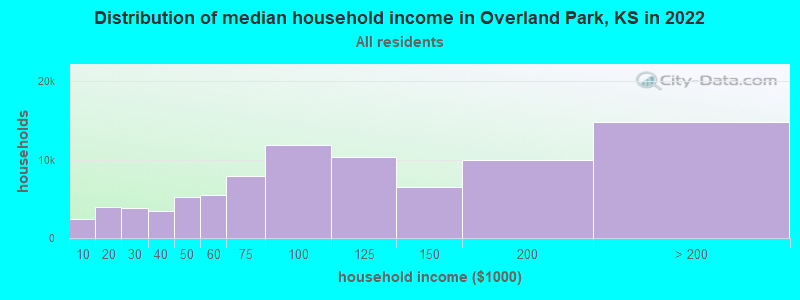
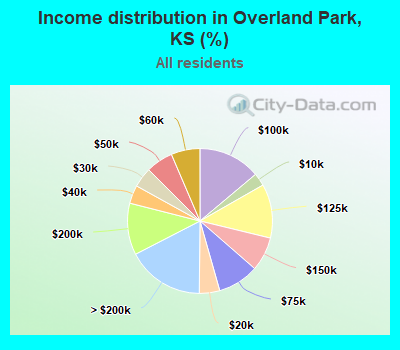
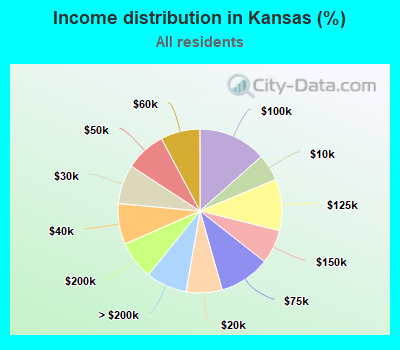
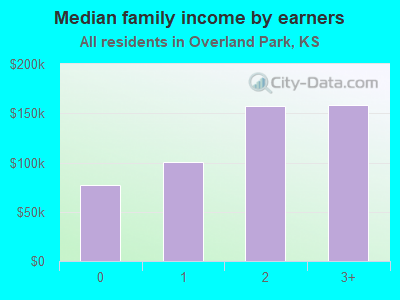
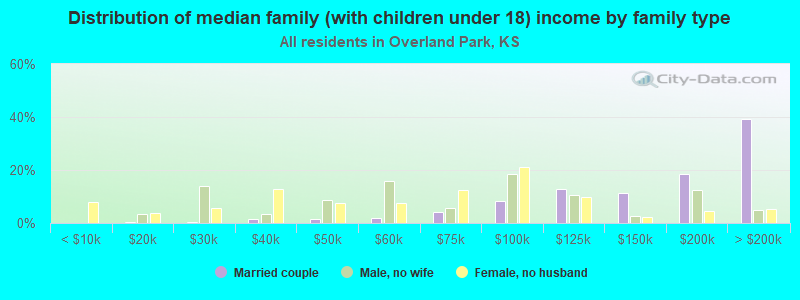
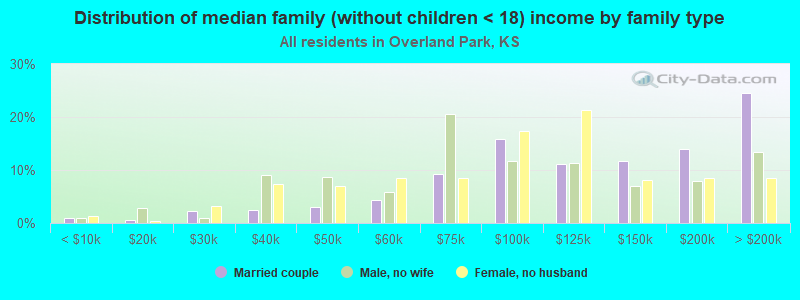
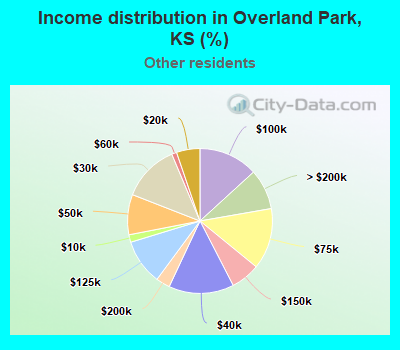
Income statistics for all residents
Median household income in Overland Park, KS in 2022:
Overland Park:
$96,694
Kansas:
$68,925
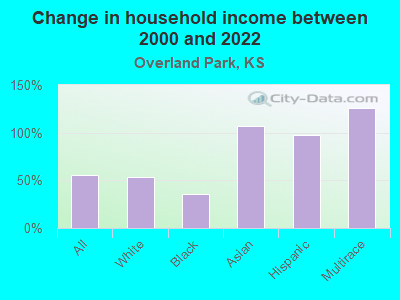
Change in median household income between 2000 and 2022:
Overland Park, Kansas:
+55.7%
State:
+69.7%
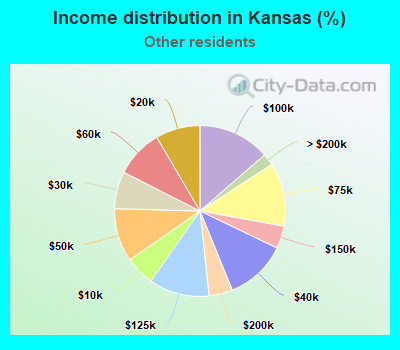
Number of households with income < $10k:
Overland Park:
2.9% (2,450)
State:
5.3% (62,150)
Number of households with income $10k - 20k:
Overland Park:
4.6% (3,904)
State:
7.1% (83,216)
Number of households with income $20k - 30k:
Overland Park:
4.4% (3,809)
State:
7.8% (91,088)
Number of households with income $30k - 40k:
Overland Park:
4.1% (3,486)
State:
8.0% (94,460)
Number of households with income $40k - 50k:
Overland Park:
6.1% (5,194)
State:
8.0% (93,996)
Number of households with income $50k - 60k:
Overland Park:
6.4% (5,515)
State:
7.8% (91,448)
Number of households with income $60k - 75k:
Overland Park:
9.2% (7,881)
State:
10.0% (118,030)
Number of households with income $75k - 100k:
Overland Park:
13.9% (11,895)
Kansas:
13.5% (158,162)
Number of households with income $100k - 125k:
Overland Park:
12.1% (10,320)
State:
10.1% (119,120)
Number of households with income $125k - 150k:
Overland Park:
7.6% (6,510)
State:
6.7% (79,026)
Number of households with income $150k - 200k:
Overland Park:
11.5% (9,884)
Kansas:
7.6% (89,342)
Number of households with income > $200k:
Overland Park:
17.3% (14,782)
State:
8.1% (95,256)
Aggregate household income in Overland Park in 2022: $11,334,103,800
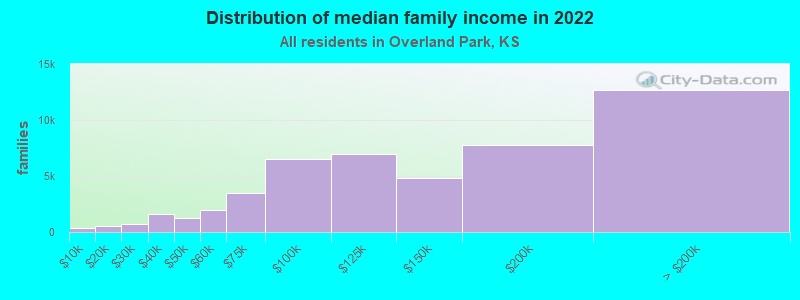
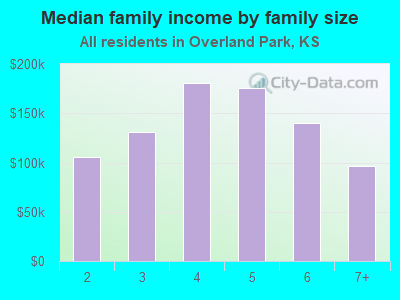
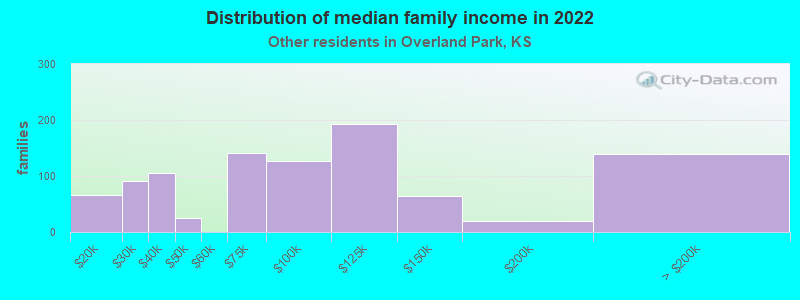
Median family income in Overland Park in 2022:
Overland Park:
$130,539
State:
$89,712
Number of families with income < $10k:
Overland Park:
0.7% (318)
State:
2.8% (20,881)
Number of families with income $10k - 20k:
Overland Park:
1.0% (504)
State:
3.0% (22,116)
Number of families with income $20k - 30k:
Overland Park:
1.5% (749)
State:
4.7% (34,526)
Number of families with income $30k - 40k:
Overland Park:
3.4% (1,639)
State:
6.1% (44,877)
Number of families with income $40k - 50k:
Overland Park:
2.6% (1,241)
Kansas:
6.4% (47,576)
Number of families with income $50k - 60k:
Overland Park:
4.0% (1,920)
Kansas:
7.4% (54,924)
Number of families with income $60k - 75k:
Overland Park:
7.1% (3,442)
State:
10.1% (74,853)
Number of families with income $75k - 100k:
Overland Park:
13.5% (6,547)
State:
15.8% (116,759)
Number of families with income $100k - 125k:
Overland Park:
14.3% (6,955)
Kansas:
13.1% (96,843)
Number of families with income $125k - 150k:
Overland Park:
10.0% (4,838)
Kansas:
9.2% (67,850)
Number of families with income $150k - 200k:
Overland Park:
16.0% (7,765)
State:
10.3% (76,190)
Number of families with income > $200k:
Overland Park:
26.0% (12,634)
State:
11.2% (83,012)
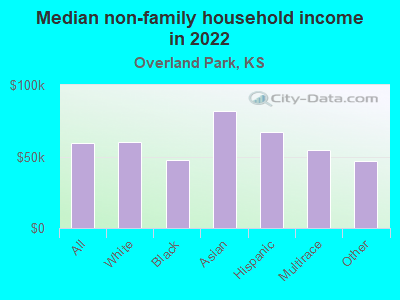
Median non-family income in Overland Park in 2022:
Overland Park:
$59,600
Kansas:
$39,735
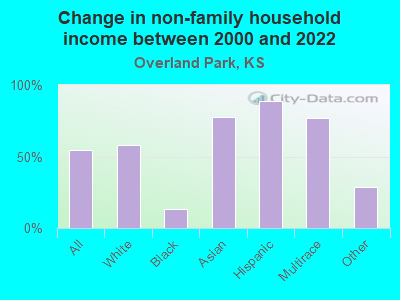
Change in median non-family income between 2000 and 2022:
Overland Park, Kansas:
+54.3%
State:
+72.7%
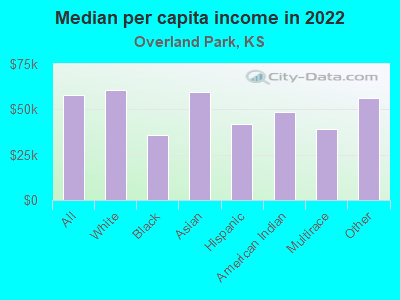
Median per capita income in Overland Park in 2022:
Overland Park:
$57,734
State:
$37,919
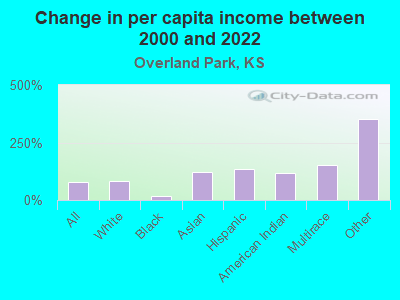
Change in median per capita income between 2000 and 2022:
Overland Park, Kansas:
+80.0%
Kansas:
+84.9%
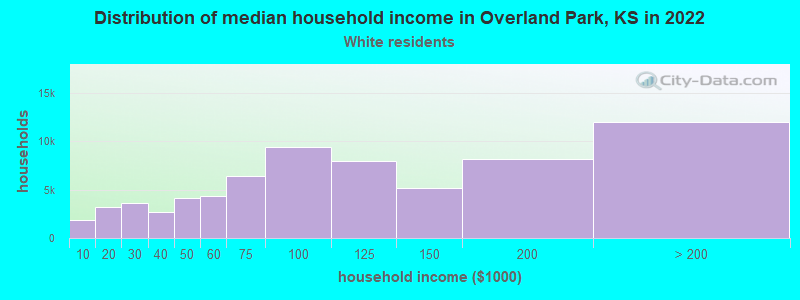
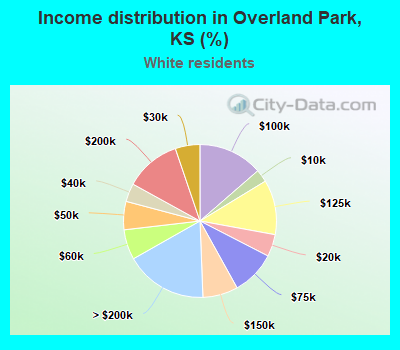
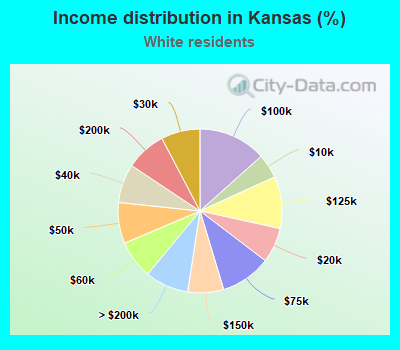
Income statistics for White residents
Median household income in Overland Park, KS in 2022:
Overland Park:
$96,589
Kansas:
$70,867
Change in median household income between 2000 and 2022:
Overland Park, Kansas:
+53.5%
State:
+70.0%
Number of households with income < $10k:
Overland Park:
2.7% (1,849)
Kansas:
4.8% (45,776)
Number of households with income $10k - 20k:
Overland Park:
4.7% (3,241)
State:
6.9% (65,871)
Number of households with income $20k - 30k:
Overland Park:
5.2% (3,592)
Kansas:
7.7% (73,347)
Number of households with income $30k - 40k:
Overland Park:
3.9% (2,666)
Kansas:
7.7% (73,088)
Number of households with income $40k - 50k:
Overland Park:
6.0% (4,118)
State:
8.1% (77,163)
Number of households with income $50k - 60k:
Overland Park:
6.4% (4,390)
Kansas:
7.6% (72,222)
Number of households with income $60k - 75k:
Overland Park:
9.4% (6,459)
State:
10.0% (95,343)
Number of households with income $75k - 100k:
Overland Park:
13.6% (9,386)
Kansas:
13.4% (127,944)
Number of households with income $100k - 125k:
Overland Park:
11.6% (7,981)
State:
10.3% (97,946)
Number of households with income $125k - 150k:
Overland Park:
7.5% (5,140)
Kansas:
7.1% (67,594)
Number of households with income $150k - 200k:
Overland Park:
11.8% (8,121)
State:
8.0% (76,160)
Number of households with income > $200k:
Overland Park:
17.4% (11,988)
Kansas:
8.6% (82,143)
Aggregate household income in Overland Park in 2022: $9,231,704,900
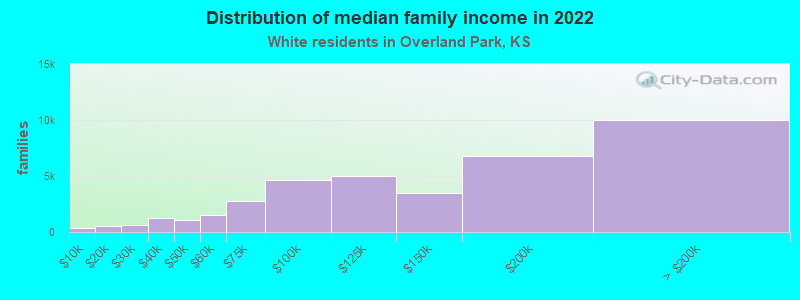
Median family income in Overland Park in 2022:
Overland Park:
$132,493
State:
$92,959
Number of families with income < $10k:
Overland Park:
0.8% (318)
State:
2.6% (15,527)
Number of families with income $10k - 20k:
Overland Park:
1.3% (504)
State:
2.6% (15,745)
Number of families with income $20k - 30k:
Overland Park:
1.7% (652)
State:
4.3% (25,378)
Number of families with income $30k - 40k:
Overland Park:
3.4% (1,276)
State:
5.4% (31,857)
Number of families with income $40k - 50k:
Overland Park:
2.7% (1,030)
Kansas:
6.2% (36,915)
Number of families with income $50k - 60k:
Overland Park:
3.9% (1,478)
State:
6.9% (40,853)
Number of families with income $60k - 75k:
Overland Park:
7.4% (2,807)
State:
10.3% (61,077)
Number of families with income $75k - 100k:
Overland Park:
12.2% (4,618)
Kansas:
15.8% (94,278)
Number of families with income $100k - 125k:
Overland Park:
13.2% (5,001)
State:
13.2% (78,493)
Number of families with income $125k - 150k:
Overland Park:
9.1% (3,468)
State:
9.6% (57,098)
Number of families with income $150k - 200k:
Overland Park:
17.9% (6,810)
State:
11.0% (65,691)
Number of families with income > $200k:
Overland Park:
26.4% (10,036)
State:
12.1% (71,928)
Median non-family income in Overland Park in 2022:
Overland Park:
$60,402
State:
$40,531
Change in median non-family income between 2000 and 2022:
Overland Park, Kansas:
+57.7%
State:
+72.5%
Median per capita income in Overland Park in 2022:
Overland Park:
$60,711
Kansas:
$41,198
Change in median per capita income between 2000 and 2022:
Overland Park, Kansas:
+84.2%
State:
+90.0%
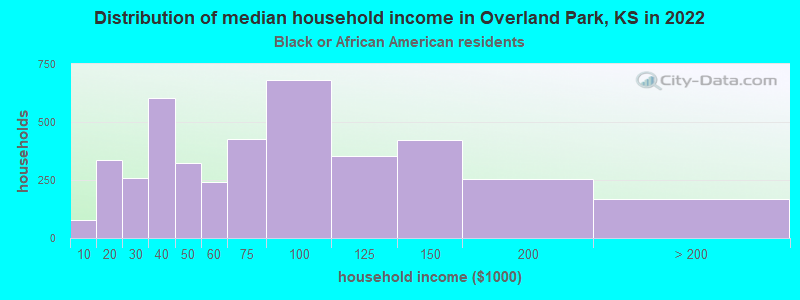
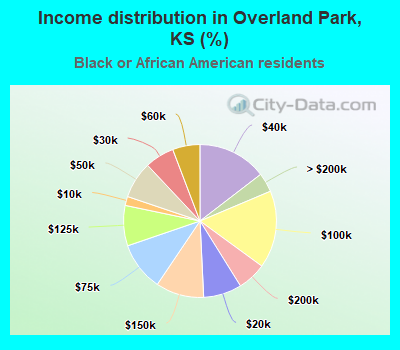
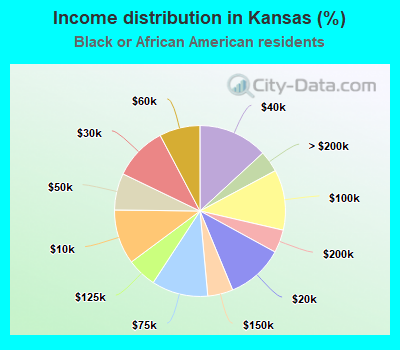
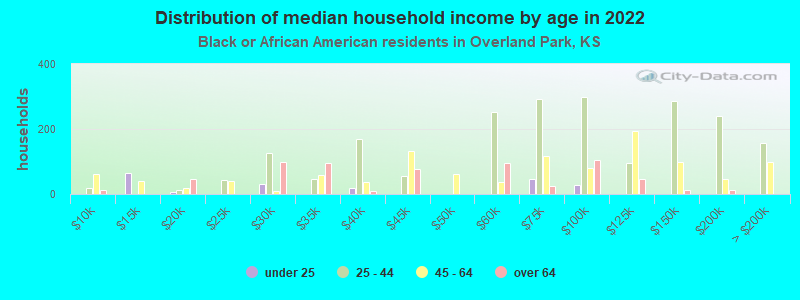
Income statistics for Black or African American residents
Median household income in Overland Park, KS in 2022:
Overland Park:
$74,799
State:
$47,907
Change in median household income between 2000 and 2022:
Overland Park, Kansas:
+35.8%
State:
+67.3%
Number of households with income < $10k:
Overland Park:
1.9% (79)
Kansas:
10.4% (6,135)
Number of households with income $10k - 20k:
Overland Park:
8.1% (336)
State:
10.8% (6,393)
Number of households with income $20k - 30k:
Overland Park:
6.2% (258)
State:
10.1% (6,007)
Number of households with income $30k - 40k:
Overland Park:
14.6% (605)
Kansas:
13.1% (7,791)
Number of households with income $40k - 50k:
Overland Park:
7.8% (324)
State:
7.0% (4,124)
Number of households with income $50k - 60k:
Overland Park:
5.8% (240)
State:
7.7% (4,567)
Number of households with income $60k - 75k:
Overland Park:
10.3% (428)
Kansas:
10.7% (6,317)
Number of households with income $75k - 100k:
Overland Park:
16.4% (680)
State:
11.4% (6,775)
Number of households with income $100k - 125k:
Overland Park:
8.5% (354)
Kansas:
5.6% (3,331)
Number of households with income $125k - 150k:
Overland Park:
10.2% (423)
State:
4.8% (2,840)
Number of households with income $150k - 200k:
Overland Park:
6.1% (253)
Kansas:
4.4% (2,579)
Number of households with income > $200k:
Overland Park:
4.1% (169)
Kansas:
4.0% (2,390)
Aggregate household income in Overland Park in 2022: $373,061,600
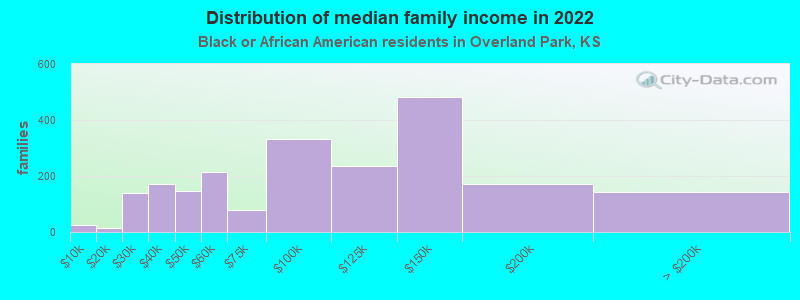
Median family income in Overland Park in 2022:
Overland Park:
$94,995
State:
$62,906
Number of families with income < $10k:
Overland Park:
1.2% (26)
State:
4.0% (1,297)
Number of families with income $10k - 20k:
Overland Park:
0.8% (16)
State:
4.5% (1,468)
Number of families with income $20k - 30k:
Overland Park:
6.4% (138)
Kansas:
8.9% (2,871)
Number of families with income $30k - 40k:
Overland Park:
7.9% (170)
State:
13.1% (4,236)
Number of families with income $40k - 50k:
Overland Park:
6.7% (145)
State:
7.7% (2,505)
Number of families with income $50k - 60k:
Overland Park:
10.0% (216)
Kansas:
9.9% (3,219)
Number of families with income $60k - 75k:
Overland Park:
3.6% (78)
State:
8.9% (2,883)
Number of families with income $75k - 100k:
Overland Park:
15.4% (333)
State:
11.8% (3,837)
Number of families with income $100k - 125k:
Overland Park:
10.9% (236)
Kansas:
9.7% (3,158)
Number of families with income $125k - 150k:
Overland Park:
22.4% (483)
Kansas:
8.5% (2,769)
Number of families with income $150k - 200k:
Overland Park:
8.0% (173)
State:
5.8% (1,874)
Number of families with income > $200k:
Overland Park:
6.6% (142)
State:
7.0% (2,280)
Median non-family income in Overland Park in 2022:
Overland Park:
$47,838
Kansas:
$29,864
Change in median non-family income between 2000 and 2022:
Overland Park, Kansas:
+13.3%
Kansas:
+67.4%
Median per capita income in Overland Park in 2022:
Overland Park:
$36,014
Kansas:
$28,387
Change in median per capita income between 2000 and 2022:
Overland Park, Kansas:
+17.1%
Kansas:
+99.8%
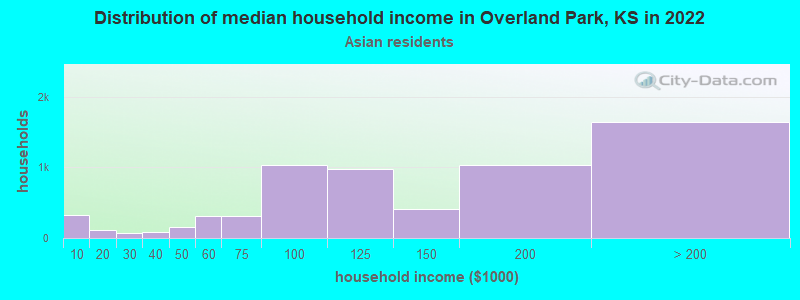
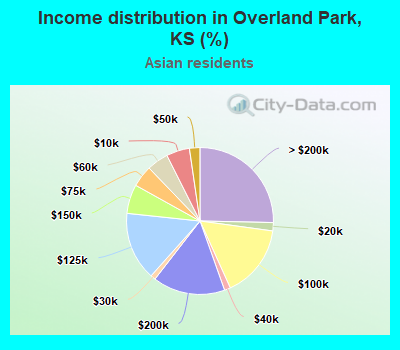
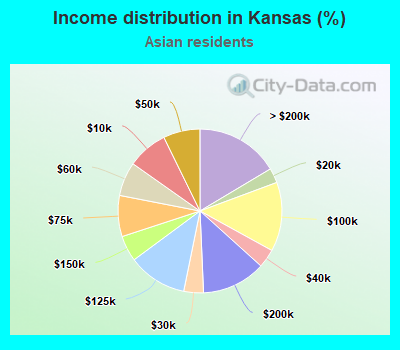
Income statistics for Asian residents
Median household income in Overland Park, KS in 2022:
Overland Park:
$125,464
Kansas:
$89,857
Change in median household income between 2000 and 2022:
Overland Park, Kansas:
+106.6%
State:
+110.1%
Number of households with income < $10k:
Overland Park:
5.1% (333)
State:
8.0% (2,351)
Number of households with income $10k - 20k:
Overland Park:
1.8% (118)
State:
2.9% (862)
Number of households with income $20k - 30k:
Overland Park:
1.1% (71)
Kansas:
3.9% (1,145)
Number of households with income $30k - 40k:
Overland Park:
1.3% (87)
State:
3.7% (1,091)
Number of households with income $40k - 50k:
Overland Park:
2.3% (149)
State:
7.3% (2,141)
Number of households with income $50k - 60k:
Overland Park:
4.7% (308)
Kansas:
6.7% (1,984)
Number of households with income $60k - 75k:
Overland Park:
4.7% (308)
Kansas:
8.1% (2,390)
Number of households with income $75k - 100k:
Overland Park:
16.1% (1,042)
State:
13.7% (4,031)
Number of households with income $100k - 125k:
Overland Park:
15.1% (978)
Kansas:
11.7% (3,443)
Number of households with income $125k - 150k:
Overland Park:
6.4% (415)
Kansas:
5.1% (1,507)
Number of households with income $150k - 200k:
Overland Park:
15.9% (1,034)
State:
12.6% (3,725)
Number of households with income > $200k:
Overland Park:
25.4% (1,645)
State:
16.4% (4,850)
Aggregate household income in Overland Park in 2022: $1,077,825,300
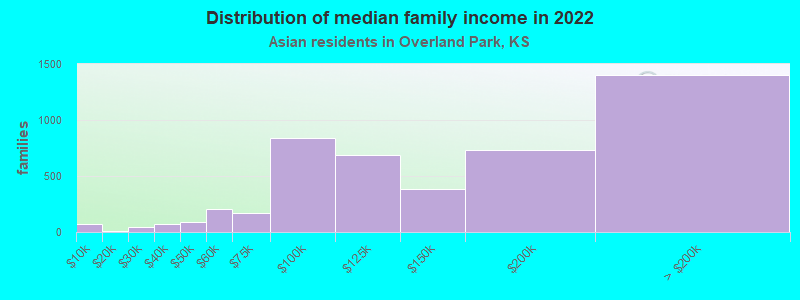
Median family income in Overland Park in 2022:
Overland Park:
$157,645
State:
$107,423
Number of families with income < $10k:
Overland Park:
1.6% (74)
Kansas:
2.0% (414)
Number of families with income $10k - 20k:
Overland Park:
0.3% (13)
State:
2.1% (438)
Number of families with income $20k - 30k:
Overland Park:
0.9% (44)
State:
2.1% (433)
Number of families with income $30k - 40k:
Overland Park:
1.5% (70)
State:
1.3% (264)
Number of families with income $40k - 50k:
Overland Park:
1.9% (88)
State:
6.9% (1,428)
Number of families with income $50k - 60k:
Overland Park:
4.4% (209)
State:
7.9% (1,641)
Number of families with income $60k - 75k:
Overland Park:
3.7% (174)
State:
7.2% (1,485)
Number of families with income $75k - 100k:
Overland Park:
17.9% (843)
Kansas:
15.6% (3,236)
Number of families with income $100k - 125k:
Overland Park:
14.5% (684)
State:
14.0% (2,900)
Number of families with income $125k - 150k:
Overland Park:
8.0% (380)
Kansas:
5.9% (1,224)
Number of families with income $150k - 200k:
Overland Park:
15.6% (736)
State:
15.3% (3,159)
Number of families with income > $200k:
Overland Park:
29.8% (1,406)
State:
19.6% (4,063)
Median non-family income in Overland Park in 2022:
Overland Park:
$81,828
State:
$45,221
Change in median non-family income between 2000 and 2022:
Overland Park, Kansas:
+77.5%
State:
+112.9%
Median per capita income in Overland Park in 2022:
Overland Park:
$59,340
State:
$43,649
Change in median per capita income between 2000 and 2022:
Overland Park, Kansas:
+122.1%
Kansas:
+140.1%
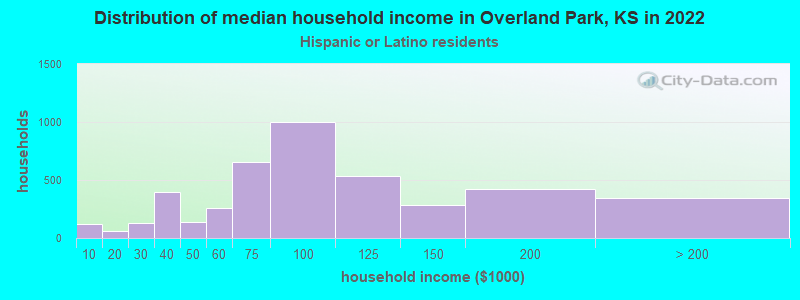
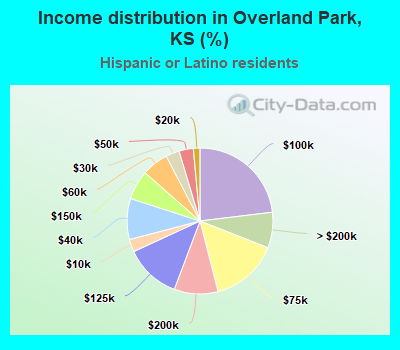
Income statistics for Hispanic or Latino residents
Median household income in Overland Park, KS in 2022:
Overland Park:
$97,287
Kansas:
$59,276
Change in median household income between 2000 and 2022:
Overland Park, Kansas:
+97.6%
State:
+81.7%
Number of households with income < $10k:
Overland Park:
2.8% (122)
Kansas:
4.7% (5,060)
Number of households with income $10k - 20k:
Overland Park:
1.4% (63)
Kansas:
8.7% (9,275)
Number of households with income $20k - 30k:
Overland Park:
3.0% (132)
Kansas:
7.7% (8,199)
Number of households with income $30k - 40k:
Overland Park:
9.1% (394)
State:
10.7% (11,486)
Number of households with income $40k - 50k:
Overland Park:
3.2% (137)
Kansas:
8.9% (9,564)
Number of households with income $50k - 60k:
Overland Park:
5.9% (255)
State:
10.0% (10,753)
Number of households with income $60k - 75k:
Overland Park:
15.0% (654)
State:
11.4% (12,249)
Number of households with income $75k - 100k:
Overland Park:
23.1% (1,004)
Kansas:
13.7% (14,610)
Number of households with income $100k - 125k:
Overland Park:
12.4% (538)
Kansas:
11.0% (11,812)
Number of households with income $125k - 150k:
Overland Park:
6.5% (283)
State:
5.0% (5,350)
Number of households with income $150k - 200k:
Overland Park:
9.7% (423)
Kansas:
4.5% (4,852)
Number of households with income > $200k:
Overland Park:
7.9% (342)
State:
3.6% (3,813)
Aggregate household income in Overland Park in 2022: $622,958,600
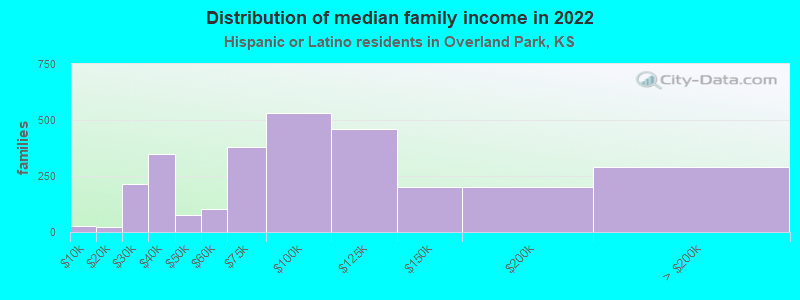
Median family income in Overland Park in 2022:
Overland Park:
$104,316
State:
$63,546
Number of families with income < $10k:
Overland Park:
0.9% (27)
State:
4.9% (3,896)
Number of families with income $10k - 20k:
Overland Park:
0.8% (24)
State:
5.7% (4,610)
Number of families with income $20k - 30k:
Overland Park:
7.5% (215)
State:
7.6% (6,102)
Number of families with income $30k - 40k:
Overland Park:
12.2% (347)
State:
10.7% (8,563)
Number of families with income $40k - 50k:
Overland Park:
2.7% (77)
Kansas:
8.7% (7,002)
Number of families with income $50k - 60k:
Overland Park:
3.6% (104)
State:
10.1% (8,102)
Number of families with income $60k - 75k:
Overland Park:
13.3% (379)
Kansas:
11.0% (8,837)
Number of families with income $75k - 100k:
Overland Park:
18.6% (531)
Kansas:
14.5% (11,646)
Number of families with income $100k - 125k:
Overland Park:
16.0% (458)
Kansas:
12.4% (9,914)
Number of families with income $125k - 150k:
Overland Park:
7.1% (203)
Kansas:
6.0% (4,809)
Number of families with income $150k - 200k:
Overland Park:
7.1% (202)
Kansas:
4.7% (3,744)
Number of families with income > $200k:
Overland Park:
10.1% (288)
Kansas:
3.7% (2,995)
Median non-family income in Overland Park in 2022:
Overland Park:
$67,021
State:
$40,213
Change in median non-family income between 2000 and 2022:
Overland Park, Kansas:
+88.7%
Kansas:
+83.3%
Median per capita income in Overland Park in 2022:
Overland Park:
$41,909
State:
$21,756
Change in median per capita income between 2000 and 2022:
Overland Park, Kansas:
+135.8%
State:
+94.6%
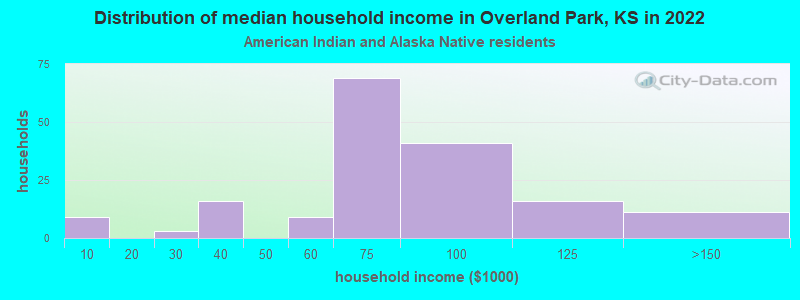
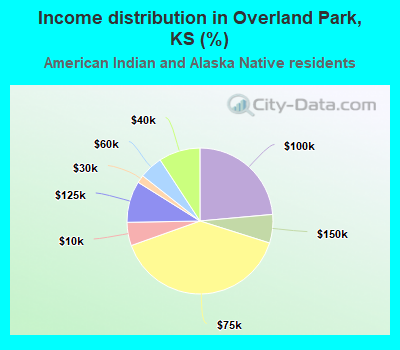
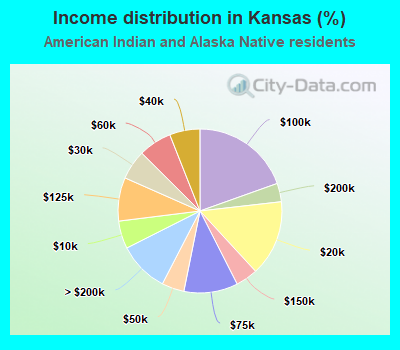
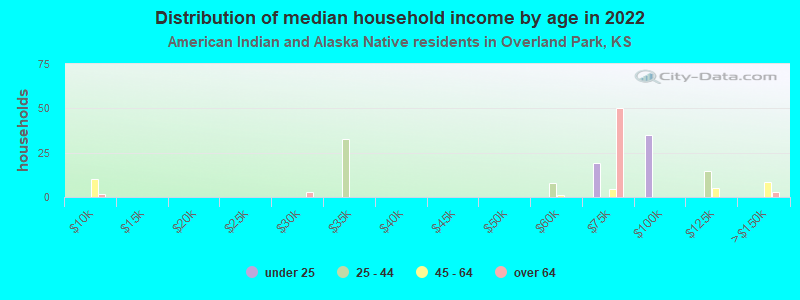
Income statistics for American Indian and Alaska Native residents
Number of households with income < $10k:
Overland Park:
5.2% (9)
State:
5.5% (434)
Number of households with income $10k - 20k:
Overland Park:
0.0% (0)
Kansas:
15.0% (1,187)
Number of households with income $20k - 30k:
Overland Park:
1.7% (3)
Kansas:
5.8% (464)
Number of households with income $30k - 40k:
Overland Park:
9.2% (16)
State:
6.0% (475)
Number of households with income $40k - 50k:
Overland Park:
0.0% (0)
State:
4.4% (351)
Number of households with income $50k - 60k:
Overland Park:
5.2% (9)
Kansas:
6.5% (519)
Number of households with income $60k - 75k:
Overland Park:
39.7% (69)
Kansas:
10.7% (846)
Number of households with income $75k - 100k:
Overland Park:
23.6% (41)
State:
19.6% (1,552)
Number of households with income $100k - 125k:
Overland Park:
9.2% (16)
State:
8.6% (682)
Number of households with income $125k - 150k:
Overland Park:
6.3% (11)
State:
4.4% (346)
Number of households with income $150k - 200k:
Overland Park:
0.0% (0)
Kansas:
3.6% (289)
Number of households with income > $200k:
Overland Park:
0.0% (0)
State:
10.0% (791)
Aggregate household income in Overland Park in 2022: $19,625,844
Median per capita income in Overland Park in 2022:
Overland Park:
$48,620
Kansas:
$23,821
Change in median per capita income between 2000 and 2022:
Overland Park, Kansas:
+117.4%
State:
+71.9%
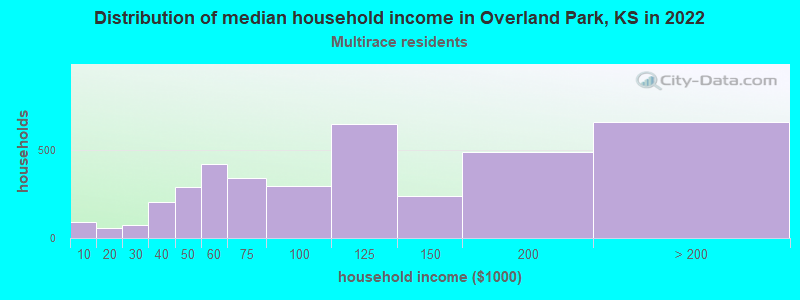
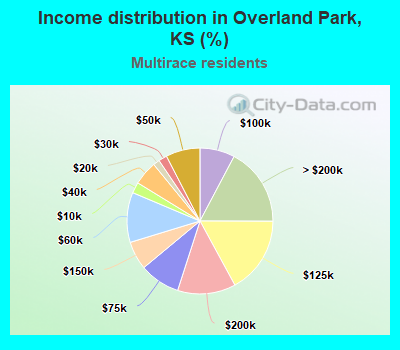
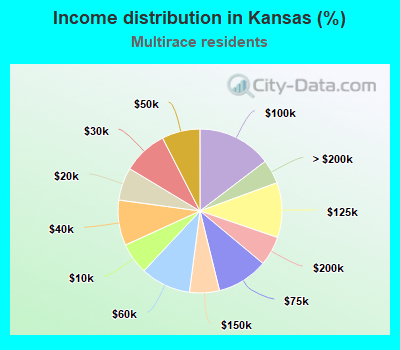
Income statistics for Multirace residents
Median household income in Overland Park, KS in 2022:
Overland Park:
$102,043
State:
$63,534
Change in median household income between 2000 and 2022:
Overland Park, Kansas:
+125.5%
State:
+96.7%
Number of households with income < $10k:
Overland Park:
2.4% (91)
State:
6.2% (5,239)
Number of households with income $10k - 20k:
Overland Park:
1.4% (55)
State:
6.5% (5,457)
Number of households with income $20k - 30k:
Overland Park:
1.9% (71)
State:
8.8% (7,445)
Number of households with income $30k - 40k:
Overland Park:
5.3% (203)
Kansas:
9.0% (7,554)
Number of households with income $40k - 50k:
Overland Park:
7.6% (288)
Kansas:
7.5% (6,357)
Number of households with income $50k - 60k:
Overland Park:
11.1% (421)
State:
9.9% (8,350)
Number of households with income $60k - 75k:
Overland Park:
9.0% (342)
State:
10.1% (8,543)
Number of households with income $75k - 100k:
Overland Park:
7.7% (294)
State:
14.7% (12,362)
Number of households with income $100k - 125k:
Overland Park:
17.0% (646)
State:
10.8% (9,137)
Number of households with income $125k - 150k:
Overland Park:
6.3% (239)
Kansas:
5.9% (4,966)
Number of households with income $150k - 200k:
Overland Park:
12.9% (490)
Kansas:
5.8% (4,887)
Number of households with income > $200k:
Overland Park:
17.3% (658)
Kansas:
4.8% (4,012)
Aggregate household income in Overland Park in 2022: $503,718,900
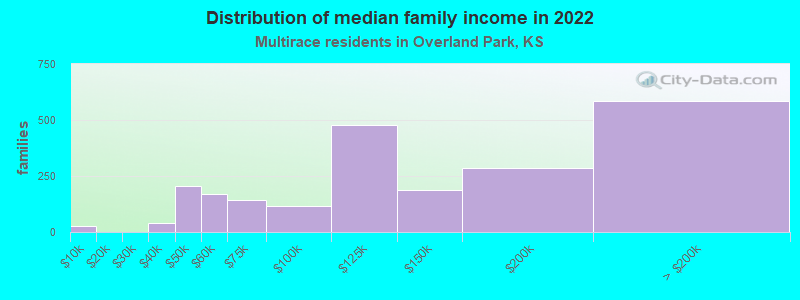
Median family income in Overland Park in 2022:
Overland Park:
$123,457
Kansas:
$76,183
Number of families with income < $10k:
Overland Park:
1.1% (25)
Kansas:
4.0% (2,199)
Number of families with income $20k - 30k:
Overland Park:
0.1% (2)
State:
6.4% (3,523)
Number of families with income $30k - 40k:
Overland Park:
1.7% (39)
State:
9.2% (5,069)
Number of families with income $40k - 50k:
Overland Park:
9.1% (204)
Kansas:
6.6% (3,650)
Number of families with income $50k - 60k:
Overland Park:
7.6% (171)
State:
11.0% (6,100)
Number of families with income $60k - 75k:
Overland Park:
6.5% (145)
State:
10.0% (5,555)
Number of families with income $75k - 100k:
Overland Park:
5.3% (118)
Kansas:
16.3% (9,043)
Number of families with income $100k - 125k:
Overland Park:
21.2% (476)
Kansas:
13.2% (7,307)
Number of families with income $125k - 150k:
Overland Park:
8.4% (187)
State:
8.6% (4,768)
Number of families with income $150k - 200k:
Overland Park:
12.7% (285)
Kansas:
6.5% (3,585)
Number of families with income > $200k:
Overland Park:
26.2% (587)
Kansas:
6.0% (3,339)
Median non-family income in Overland Park in 2022:
Overland Park:
$54,607
Kansas:
$37,429
Change in median non-family income between 2000 and 2022:
Overland Park, Kansas:
+77.0%
State:
+83.2%
Median per capita income in Overland Park in 2022:
Overland Park:
$39,143
Kansas:
$24,379
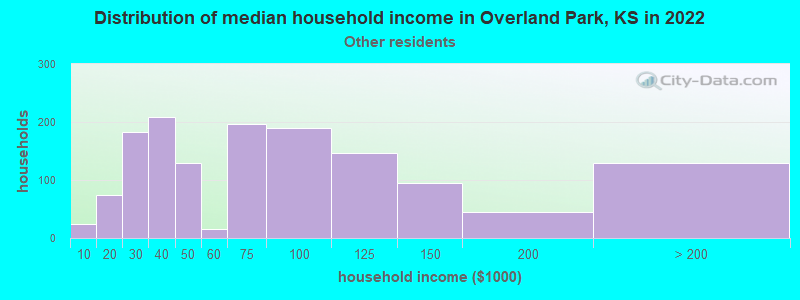
Income statistics for other residents
Median household income in Overland Park, KS in 2022:
Overland Park:
$76,103
Kansas:
$57,858
Number of households with income < $10k:
Overland Park:
1.7% (24)
State:
5.6% (2,143)
Number of households with income $10k - 20k:
Overland Park:
5.2% (75)
State:
8.4% (3,223)
Number of households with income $20k - 30k:
Overland Park:
12.7% (183)
State:
7.0% (2,680)
Number of households with income $30k - 40k:
Overland Park:
14.5% (209)
State:
11.7% (4,461)
Number of households with income $40k - 50k:
Overland Park:
9.0% (129)
State:
10.1% (3,860)
Number of households with income $50k - 60k:
Overland Park:
1.1% (16)
State:
9.1% (3,462)
Number of households with income $60k - 75k:
Overland Park:
13.6% (196)
State:
12.0% (4,578)
Number of households with income $75k - 100k:
Overland Park:
13.2% (190)
State:
13.6% (5,197)
Number of households with income $100k - 125k:
Overland Park:
10.2% (146)
Kansas:
11.4% (4,359)
Number of households with income $125k - 150k:
Overland Park:
6.5% (94)
State:
4.3% (1,632)
Number of households with income $150k - 200k:
Overland Park:
3.1% (45)
Kansas:
4.5% (1,702)
Number of households with income > $200k:
Overland Park:
9.0% (130)
State:
2.2% (858)
Aggregate household income in Overland Park in 2022: $141,680,600
Median family income in Overland Park in 2022:
Overland Park:
$103,950
State:
$64,342
Number of families with income $10k - 20k:
Overland Park:
6.7% (66)
State:
7.7% (2,312)
Number of families with income $20k - 30k:
Overland Park:
9.4% (91)
State:
7.0% (2,091)
Number of families with income $30k - 40k:
Overland Park:
10.8% (105)
State:
10.0% (2,987)
Number of families with income $40k - 50k:
Overland Park:
2.6% (25)
Kansas:
9.4% (2,818)
Number of families with income $60k - 75k:
Overland Park:
14.5% (141)
State:
11.6% (3,473)
Number of families with income $75k - 100k:
Overland Park:
13.1% (127)
State:
14.3% (4,280)
Number of families with income $100k - 125k:
Overland Park:
19.7% (192)
State:
14.0% (4,199)
Number of families with income $125k - 150k:
Overland Park:
6.7% (65)
Kansas:
5.0% (1,511)
Number of families with income $150k - 200k:
Overland Park:
2.1% (20)
Kansas:
5.4% (1,631)
Number of families with income > $200k:
Overland Park:
14.3% (139)
State:
2.4% (733)
Median non-family income in Overland Park in 2022:
Overland Park:
$46,684
State:
$45,177
Change in median non-family income between 2000 and 2022:
Overland Park, Kansas:
+28.6%
Kansas:
+107.8%
Median per capita income in Overland Park in 2022:
Overland Park:
$56,272
Kansas:
$22,862
Discuss Overland Park, Kansas (KS) on our hugely popular Kansas forum.