Housing density: 1,307 houses/condos per square mile
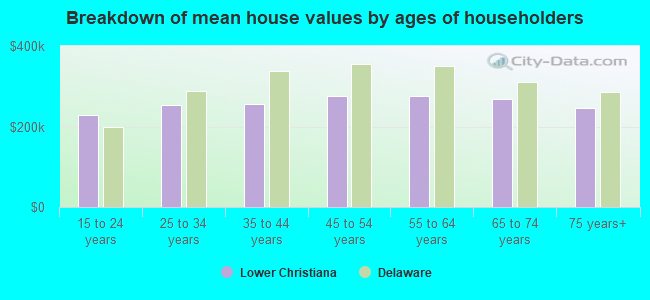
Median price asked for vacant for-sale houses and condos in 2022 in this county: $238,015.
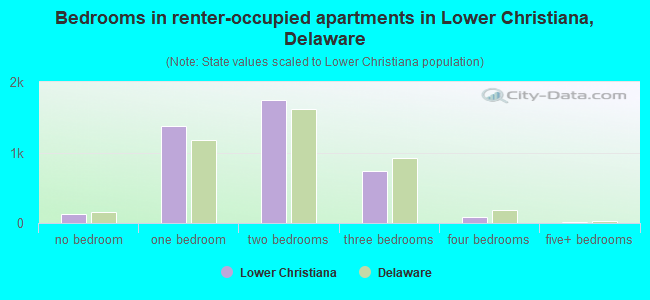
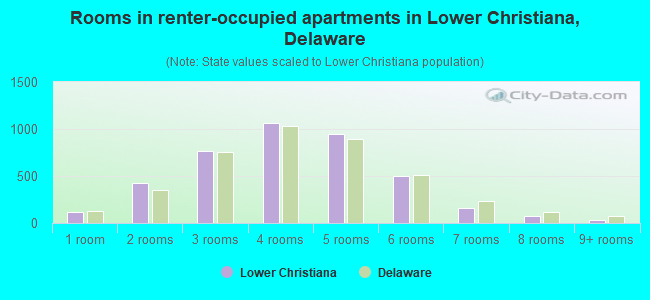
Median contract rent in 2022: $1,057 (lower quartile is $895, upper quartile is $1,295)
Median rent asked for vacant for-rent units in 2022: $1,102
Median gross rent in Lower Christiana, DE in 2022: $1,215
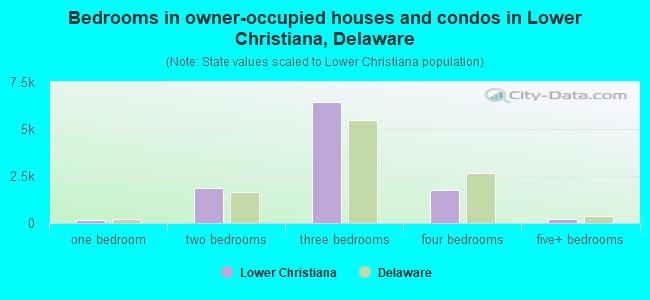
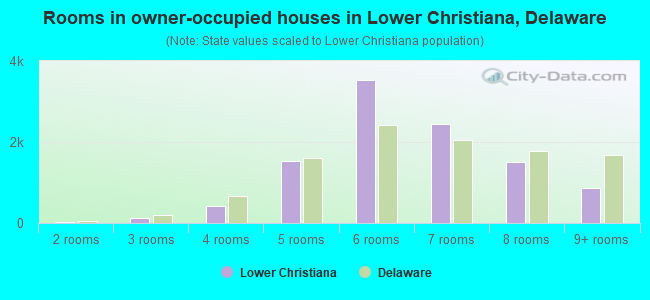
Housing units in Lower Christiana with a mortgage: 6,290 (749 second mortgage, 894 home equity loan, 13 both second mortgage and home equity loan) Houses without a mortgage: 3,584
Compare current foreclosures near Lower Christiana, DE:
In family households: 432,579 (87,243 male householders, 47,500 female householders)
94,343 spouses, 154,234 children (144,377 natural, 3,150 adopted, 6,707 stepchildren), 13,869 grandchildren, 5,731 brothers or sisters, 5,248 parents, foster children, 7,594 other relatives, 13,545 non-relatives
In nonfamily households: 88,746 (30,762 male householders (22,487 living alone)), 37,146 female householders (30,500 living alone)), 20,838 nonrelatives
In group quarters: 17,154 (7,943 institutionalized population)
79,448 married couples with children.
31,255 single-parent households (6,358 men, 24,897 women).
86.6% of residents of Lower Christiana speak English at home.
9.4% of residents speak Spanish at home (39% speak English very well, 21% speak English well, 27% speak English not well, 13% don't speak English at all).
3.3% of residents speak other Indo-European language at home (73% speak English very well, 22% speak English well, 4% speak English not well, 1% don't speak English at all).
0.6% of residents speak Asian or Pacific Island language at home (48% speak English very well, 34% speak English well, 19% speak English not well).
0.1% of residents speak other language at home (70% speak English very well, 30% speak English well).
Foreign born population: 4,975 (11.9%)
(50.0% of them are naturalized citizens)
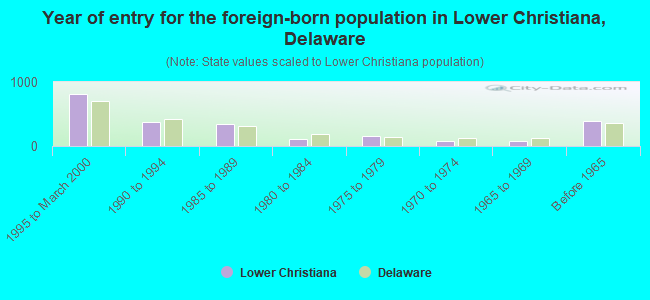
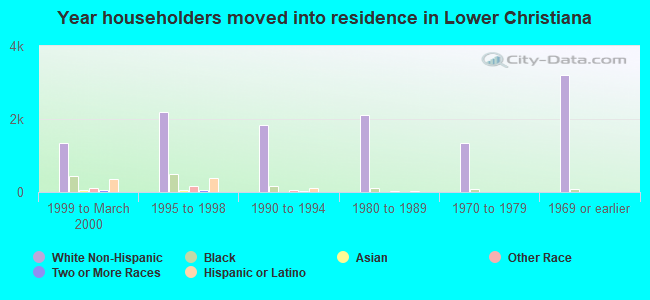
Year of entry for the foreign-born population in Lower Christiana, Delaware
8181995 to March 2000
3771990 to 1994
3511985 to 1989
1131980 to 1984
1561975 to 1979
711970 to 1974
851965 to 1969
397Before 1965
Most common places of birth for foreign-born residents (%):
Mexico
Lower Christiana:
47.4% (1,123)
Delaware:
17.5% (7,846)
India
Lower Christiana:
6.5% (153)
Delaware:
8.3% (3,736)
United Kingdom
Lower Christiana:
5.5% (130)
Delaware:
5.6% (2,521)
Jamaica
Lower Christiana:
3.8% (90)
Delaware:
3.7% (1,682)
Germany
Lower Christiana:
3.3% (79)
Delaware:
4.2% (1,901)
Italy
Lower Christiana:
2.6% (61)
Delaware:
2.3% (1,014)
China, excluding Hong Kong and Taiwan
Lower Christiana:
2.5% (59)
Delaware:
5.3% (2,392)
Poland
Lower Christiana:
2.4% (57)
Delaware:
1.3% (598)
Ireland
Lower Christiana:
2.3% (54)
Delaware:
0.8% (369)
Colombia
Lower Christiana:
2.2% (53)
Delaware:
1.6% (720)
Philippines
Lower Christiana:
1.6% (38)
Delaware:
3.4% (1,507)
Place of birth for U.S.-born residents:
This state: 23,482
Other state: 9,428
Northeast: 5,962
Midwest: 617
South: 2,510
West: 339
64% of Lower Christiana residents lived in the same house 5 years ago. Out of people who lived in different houses, 78% lived in this county. Out of people who lived in different counties, 9% lived in Delaware.
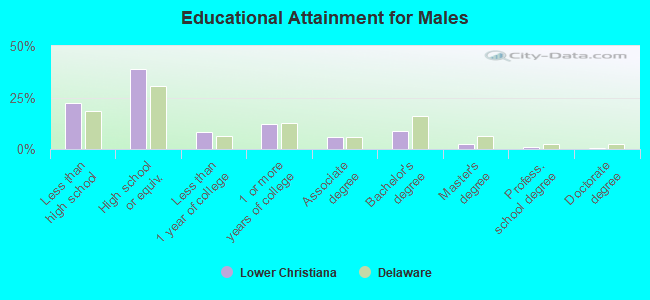
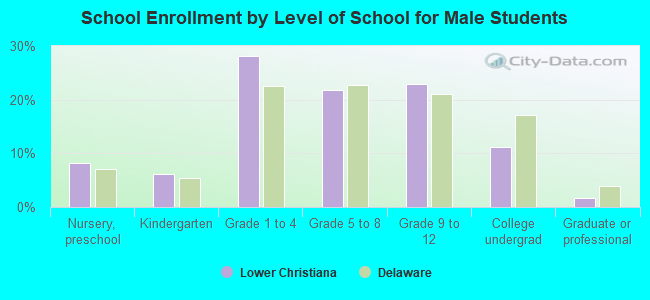
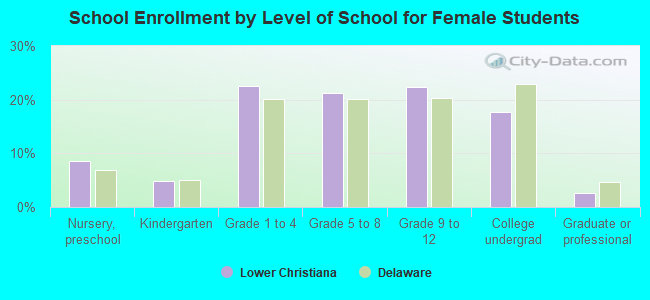
Education attainment for males 25 years and older:
No schooling: 98
Nursery to 4th grade: 74
5th and 6th grade: 196
7th and 8th grade: 392
9th grade: 435
10th grade: 457
11th grade: 399
12th grade, no diploma: 534
High school graduate (or equivalency): 4,436
Less than 1 year of college: 927
Some college more than 1 year, no degree: 1,373
Associate degree: 678
Bachelor's degree: 1,020
Master's degree: 298
Professional school degree: 90
Doctorate degree: 82
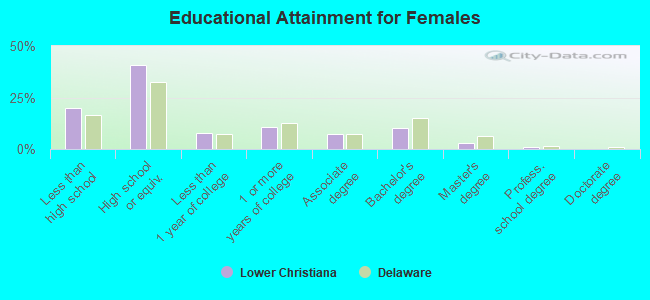
Education attainment for females 25 years and older:
No schooling: 81
Nursery to 4th grade: 54
5th and 6th grade: 178
7th and 8th grade: 488
9th grade: 353
10th grade: 604
11th grade: 464
12th grade, no diploma: 340
High school graduate (or equivalency): 5,278
Less than 1 year of college: 984
Some college more than 1 year, no degree: 1,370
Associate degree: 930
Bachelor's degree: 1,344
Master's degree: 380
Professional school degree: 130
Doctorate degree: 6
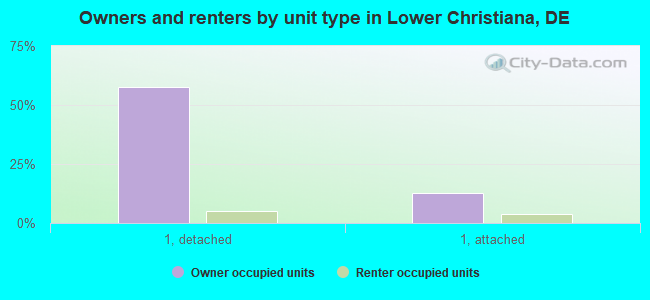
Housing units in structures:
One, detached: 9,346
One, attached: 2,490
Two: 596
3 or 4: 1,025
5 to 9: 632
10 to 19: 887
20 to 49: 77
50 or more: 46
Mobile homes: 95
Median worth of mobile homes: $30,883
Housing units lacking complete plumbing facilities: 0.4%
Housing units lacking complete kitchen facilities: 0.4%