Races in Lower Christiana, Delaware (DE) Detailed Stats
Ancestries, Foreign-born residents, place of birth
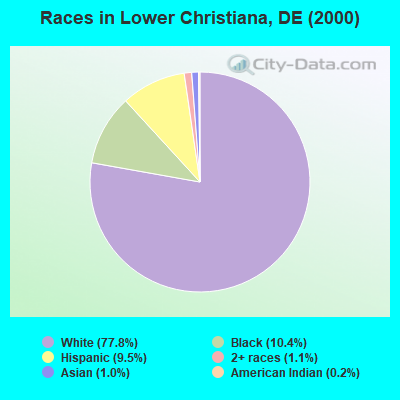
Race distribution in Lower Christiana

- 28,21377.8%White alone
- 3,76510.4%Black alone
- 3,4329.5%Hispanic
- 3911.1%Two or more races
- 3511.0%Asian alone
- 640.2%American Indian alone
- 260.07%Other race alone
- 80.02%Native Hawaiian and Other
Pacific Islander alone
2000
2022
-
- 567,97372.5%White alone
- 148,43518.9%Black alone
- 37,2774.8%Hispanic
- 16,1102.1%Asian alone
- 10,2221.3%Two or more races
- 2,3240.3%American Indian alone
- 1,0250.1%Other race alone
- 2340.03%Native Hawaiian and Other
Pacific Islander alone

-
- 599,34758.9%White alone
- 220,01021.6%Black alone
- 105,30010.3%Hispanic
- 46,0164.5%Two or more races
- 41,3504.1%Asian alone
- 5,0970.5%Other race alone
- 1,2760.1%American Indian alone

Income and house value in Lower Christiana
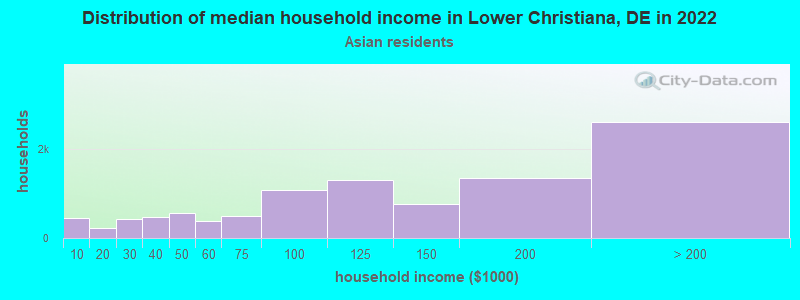
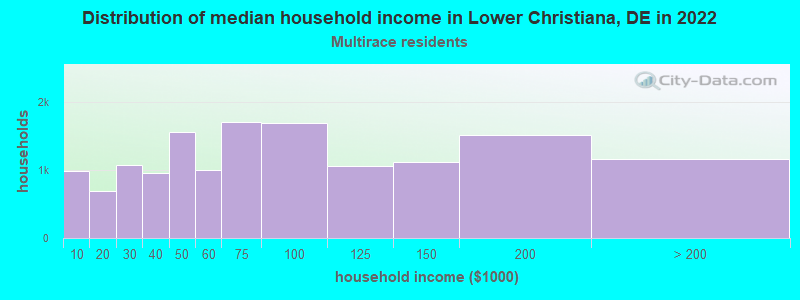
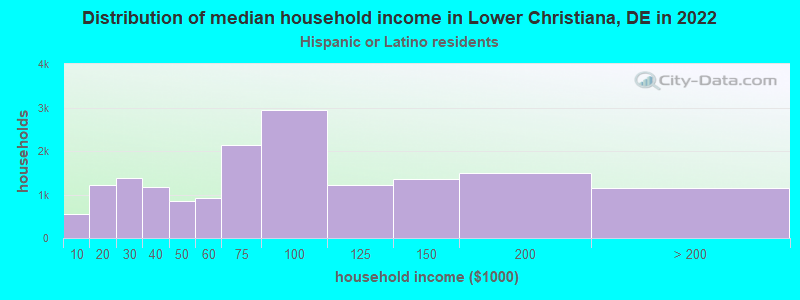
- Median household income in 2022
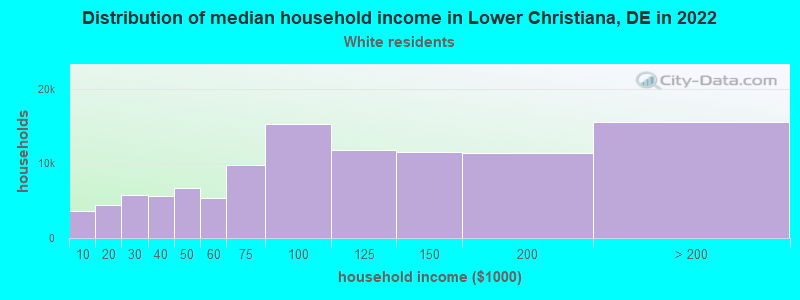
- $76,458White non-Hispanic householders
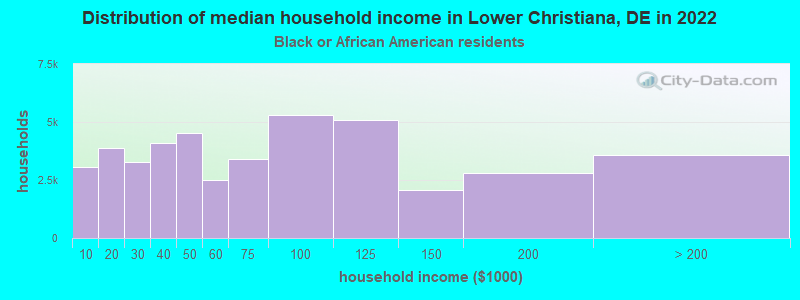
- $49,164Black householders
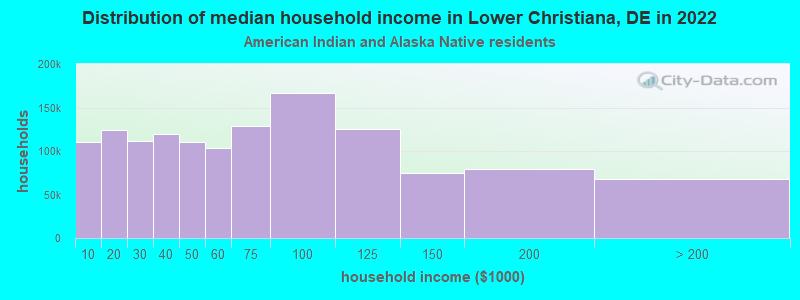
- $68,383American Indian and Alaska Native householders
- $90,253Asian householders
- $69,770Some other race householders
- $64,425Two or more races householders
- $65,825Hispanic or Latino race householders
- Median 2022 house value
- $269,898White Non-Hispanic householders
- $206,656Black or African American householders
- $301,768American Indian or Alaska Native householders
- $299,030Asian householders
- $230,061Some other race householders
- $220,351Two or more races householders
- $228,069Hispanic or Latino householders
Household income for White non-Hispanic householders
Household income for Black householders
Household income for American Indian and Alaska Native householders
Household income for Asian householders
Household income for Two or more races householders
Household income for Hispanic or Latino race householders
Zip code: 19804