Germantown, TN (Tennessee) Houses and Residents
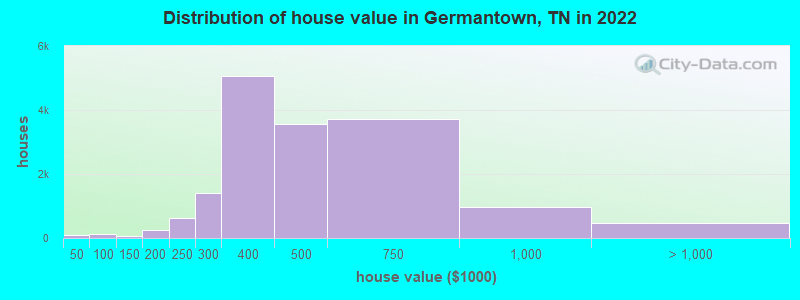
Estimated median house or condo value in 2022: $489,748 (it was $215,200 in 2000 )
Germantown:
$489,748Tennessee:
$284,800
Lower value quartile - upper value quartile: $406,782 - $640,437Total population: 39,267 (Urban population: 37,281, Rural population: 0)
Houses: 16,134 (15,439 occupied: 13,648 owner occupied, 1,933 renter occupied )
% of renters here:
12%State:
33%
Housing density: 918 houses/condos per square mile
Median price asked for vacant for-sale houses and condos in 2022: $846,943.
Median contract rent in 2022: $1,480 (lower quartile is $1,277, upper quartile is over $2,000)
Median rent asked for vacant for-rent units in 2022: $2,665
Median gross rent in Germantown, TN in 2022: $1,758
Housing units in Germantown with a mortgage: 8,835 (992 second mortgage, 45 home equity loan, 930 both second mortgage and home equity loan )Houses without a mortgage: 238
Median household income for houses/condos with a mortgage: $167,779
Median household income for apartments without a mortgage: $116,654
Median monthly housing costs: $1,932
Data:
Median house or condo value ($)
Median house or condo value ($ change since 2000)
Median house or condo value ($) - White
Median house or condo value ($) - Black or African American
Median house or condo value ($) - Asian
Median house or condo value ($) - Hispanic or Latino
Median house or condo value ($) - American Indian and Alaska Native
Median house or condo value ($) - Multirace
Median house or condo value ($) - Other Race
Median price asked for mobile homes ($)
Household density (households per square mile)
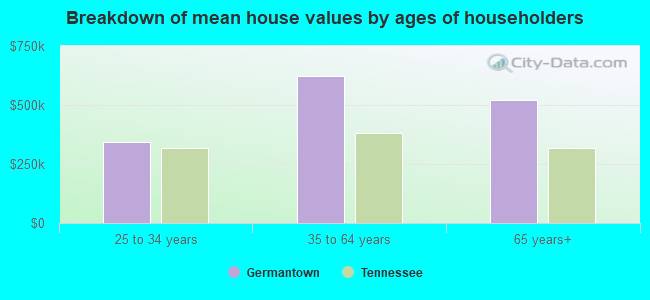
Mean house or condo value by units in structure - 1, detached ($)
Mean house or condo value by units in structure - 1, attached ($)
Mean house or condo value by units in structure - 2 ($)
Mean house or condo value by units in structure by units in structure - 3 or 4 ($)
Mean house or condo value by units in structure - 5 or more ($)
Mean house or condo value by units in structure - Boat, RV, van, etc. ($)
Mean house or condo value by units in structure - Mobile home ($)
Median contract rent ($)
Median contract rent - Lower quartile ($)
Median contract rent - Upper quartile ($)
Median gross rent ($)
Urban houses (%)
Rural houses (%)
Houses occupied (%)
Houses occupied (% change since 2000)
Houses owner occupied (%)
Houses owner occupied (% change since 2000)
Houses renter occupied (%)
Houses renter occupied (% change since 2000)
Vacant housing units - For rent (%)
Vacant housing units - For rent (% change since 2000)
Vacant housing units - For sale only (%)
Vacant housing units - For sale only (% change since 2000)
Vacant housing units - Rented or sold, not occupied (%)
Vacant housing units - Rented or sold, not occupied (% change since 2000)
Vacant housing units - For seasonal, recreational, or occasional use (%)
Vacant housing units - For seasonal, recreational, or occasional use (% change since 2000)
Vacant housing units - For migrant workers (%)
Vacant housing units - For migrant workers (% change since 2000)
Vacant housing units - Other vacant (%)
Vacant housing units - Other vacant (% change since 2000)
Median monthly housing costs ($)
Median household income for houses/condos with a mortgage ($)
Median household income for houses/condos without a mortgage ($)
Median household income ($)
Median household income ($) - White
Median household income ($) - Black or African American
Median household income ($) - Asian
Median household income ($) - Hispanic or Latino
Median household income ($) - American Indian and Alaska Native
Median household income ($) - Multirace
Median household income ($) - Other Race
Mortgage status - with mortgage (%)
Mortgage status - with second mortgage (%)
Mortgage status - with home equity loan (%)
Mortgage status - with both second mortgage and home equity loan (%)
Mortgage status - without a mortgage (%)
Median year house/condo built
Median year apartment built
Household type by relationship - Male householder living alone (%)
Household type by relationship - Male householder not living alone (%)
Household type by relationship - Female householder living alone (%)
Household type by relationship - Female householder not living alone (%)
Household type by relationship - Opposite-Sex spouse (%)
Household type by relationship - Same-Sex spouse (%)
Household type by relationship - Opposite-Sex unmarried partner (%)
Household type by relationship - Same-Sex unmarried partner (%)
Household type by relationship - In group quarters (%)
Size of family households - 2-person household (%)
Size of family households - 3-person household (%)
Size of family households - 4-person household (%)
Size of family households - 5-person household (%)
Size of family households - 6-person household (%)
Size of family households - 7-or-more-person household (%)
Size of nonfamily households - 1-person household (%)
Size of nonfamily households - 2-person household (%)
Size of nonfamily households - 3-person household (%)
Size of nonfamily households - 4-person household (%)
Size of nonfamily households - 5-person household (%)
Size of nonfamily households - 6-person household (%)
Size of nonfamily households - 7-or-moreperson household (%)
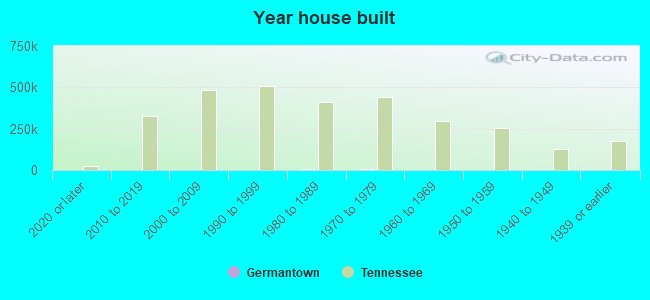
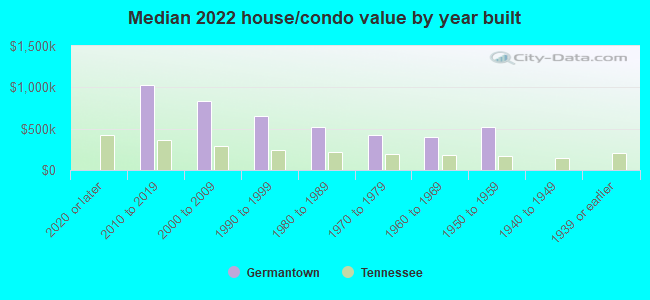
Year house built - Built 2010 or later (%)
Year house built - Built 2000 to 2009 (%)
Year house built - Built 1990 to 1999 (%)
Year house built - Built 1980 to 1989 (%)
Year house built - Built 1970 to 1979 (%)
Year house built - Built 1960 to 1969 (%)
Year house built - Built 1950 to 1959 (%)
Year house built - Built 1940 to 1949 (%)
Year house built - Built 1939 or earlier (%)
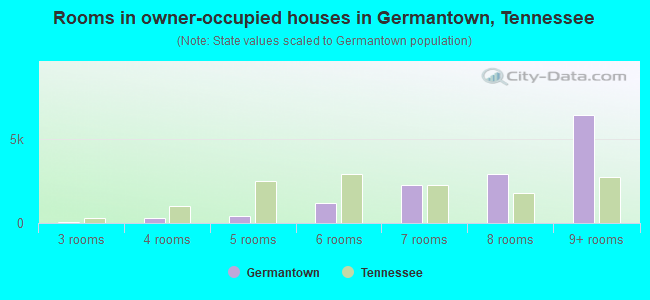
Median number of rooms in houses and condos
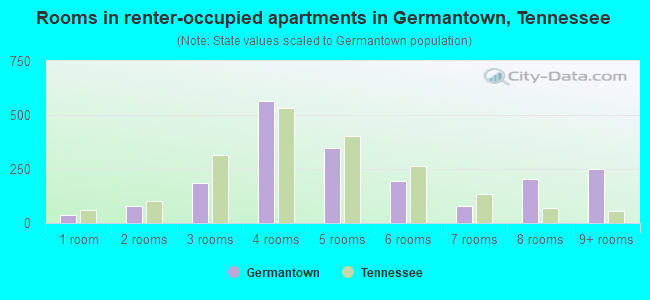
Median number of rooms in apartments
Median number of bedrooms in owner occupied houses
Mean number of bedrooms in owner occupied houses
Median number of bedrooms in renter occupied houses
Mean number of bedrooms in renter occupied houses
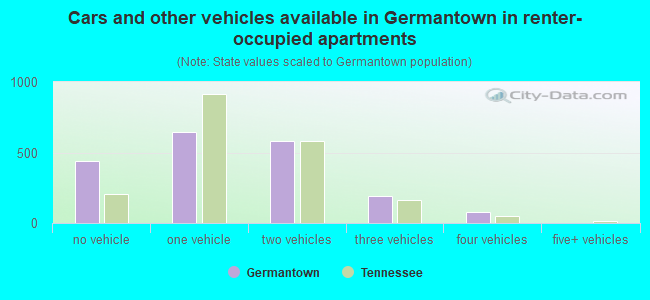
Median number of vehichles in owner occupied houses
Mean number of vehichles in owner occupied houses
Median number of vehichles in renter occupied houses
Mean number of vehichles in renter occupied houses
Rooms in owner-occupied houses - 1 room (%)
Rooms in owner-occupied houses - 2 rooms (%)
Rooms in owner-occupied houses - 3 rooms (%)
Rooms in owner-occupied houses - 4 rooms (%)
Rooms in owner-occupied houses - 5 rooms (%)
Rooms in owner-occupied houses - 6 rooms (%)
Rooms in owner-occupied houses - 7 rooms (%)
Rooms in owner-occupied houses - 8 rooms (%)
Rooms in owner-occupied houses - 9+ rooms (%)
Rooms in renter-occupied houses - 1 room (%)
Rooms in renter-occupied houses - 2 rooms (%)
Rooms in renter-occupied houses - 3 rooms (%)
Rooms in renter-occupied houses - 4 rooms (%)
Rooms in renter-occupied houses - 5 rooms (%)
Rooms in renter-occupied houses - 6 rooms (%)
Rooms in renter-occupied houses - 7 rooms (%)
Rooms in renter-occupied houses - 8 rooms (%)
Rooms in renter-occupied houses - 9+ rooms (%)
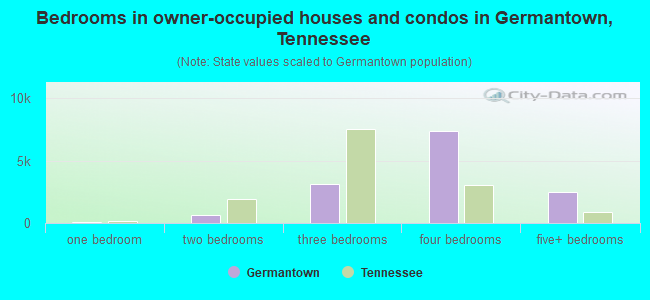
Bedrooms in owner-occupied houses - no bedrooms (%)
Bedrooms in owner-occupied houses - 1 bedroom (%)
Bedrooms in owner-occupied houses - 2 bedrooms (%)
Bedrooms in owner-occupied houses - 3 bedrooms (%)
Bedrooms in owner-occupied houses - 4 bedrooms (%)
Bedrooms in owner-occupied houses - 5+ bedrooms (%)
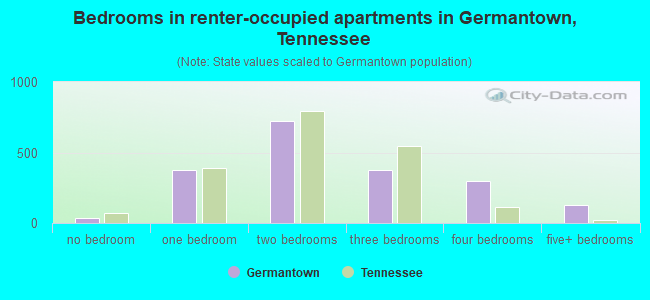
Bedrooms in renter-occupied houses - no bedrooms (%)
Bedrooms in renter-occupied houses - 1 bedroom (%)
Bedrooms in renter-occupied houses - 2 bedrooms (%)
Bedrooms in renter-occupied houses - 3 bedrooms (%)
Bedrooms in renter-occupied houses - 4 bedrooms (%)
Bedrooms in renter-occupied houses - 5+ bedrooms (%)
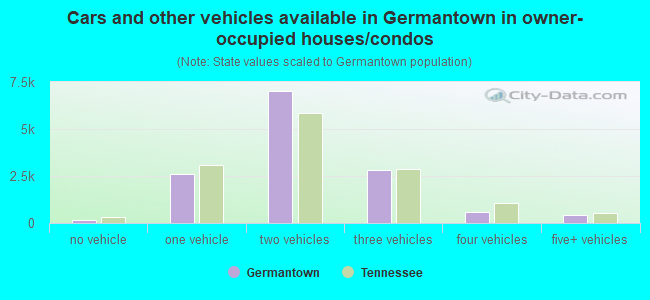
Vehicles available in owner-occupied houses - no vehicle available (%)
Vehicles available in owner-occupied houses - 1 vehicle available(%)
Vehicles available in owner-occupied houses - 2 Vehicles available (%)
Vehicles available in owner-occupied houses - 3 Vehicles available (%)
Vehicles available in owner-occupied houses - 4 Vehicles available (%)
Vehicles available in owner-occupied houses - 5+ Vehicles available (%)
Vehicles available in renter-occupied houses - no vehicle available (%)
Vehicles available in renter-occupied houses - 1 vehicle available (%)
Vehicles available in renter-occupied houses - 2 Vehicles available (%)
Vehicles available in renter-occupied houses - 3 Vehicles available (%)
Vehicles available in renter-occupied houses - 4 Vehicles available (%)
Vehicles available in renter-occupied houses - 5+ Vehicles available (%)
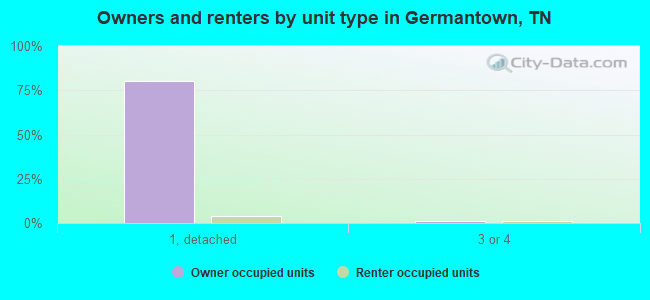
Housing units in structures - 1, detached (%)
Housing units in structures - 1, attached (%)
Housing units in structures - 2 (%)
Housing units in structures - 3 or 4 (%)
Housing units in structures - 5 to 9 (%)
Housing units in structures - 10 to 19 (%)
Housing units in structures - 20 to 49 (%)
Housing units in structures - 50 or more (%)
Housing units in structures - Mobile home (%)
Housing units in structures - Boat, RV, van, etc. (%)
Housing units in structures - Owners - 1, detached (%)
Housing units in structures - Owners - 1, attached (%)
Housing units in structures - Owners - 2 (%)
Housing units in structures - Owners - 3 or 4 (%)
Housing units in structures - Owners - 5 to 9 (%)
Housing units in structures - Owners - 10 to 19 (%)
Housing units in structures - Owners - 20 to 49 (%)
Housing units in structures - Owners - 50 or more (%)
Housing units in structures - Owners - Mobile home (%)
Housing units in structures - Owners - Boat, RV, van, etc. (%)
Housing units in structures - Renters - 1, detached (%)
Housing units in structures - Renters - 1, attached (%)
Housing units in structures - Renters - 2 (%)
Housing units in structures - Renters - 3 or 4 (%)
Housing units in structures - Renters - 5 to 9 (%)
Housing units in structures - Renters - 10 to 19 (%)
Housing units in structures - Renters - 20 to 49 (%)
Housing units in structures - Renters - 50 or more (%)
Housing units in structures - Renters - Mobile home (%)
Housing units in structures - Renters - Boat, RV, van, etc. (%)
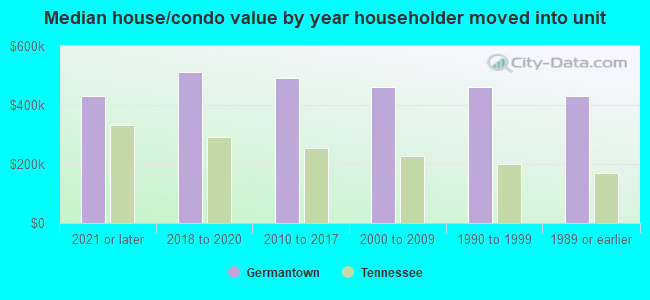
House/condo owner moved in on average (years ago)
Renter moved in on average (years ago)
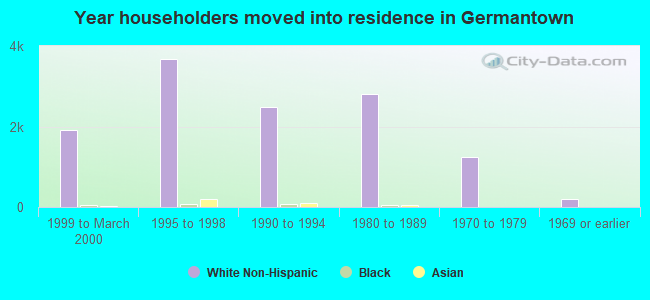
Year householder moved into unit - Moved in 1999 to March 2000 (%)
Year householder moved into unit - Moved in 1999 to March 2000 (%) - White
Year householder moved into unit - Moved in 1999 to March 2000 (%) - Black or African American
Year householder moved into unit - Moved in 1999 to March 2000 (%) - Asian
Year householder moved into unit - Moved in 1999 to March 2000 (%) - Hispanic or Latino
Year householder moved into unit - Moved in 1999 to March 2000 (%) - American Indian and Alaska Native
Year householder moved into unit - Moved in 1999 to March 2000 (%) - Multirace
Year householder moved into unit - Moved in 1999 to March 2000 (%) - Other Race
Year householder moved into unit - Moved in 1995 to 1998 (%)
Year householder moved into unit - Moved in 1995 to 1998 (%) - White
Year householder moved into unit - Moved in 1995 to 1998 (%) - Black or African American
Year householder moved into unit - Moved in 1995 to 1998 (%) - Asian
Year householder moved into unit - Moved in 1995 to 1998 (%) - Hispanic or Latino
Year householder moved into unit - Moved in 1995 to 1998 (%) - American Indian and Alaska Native
Year householder moved into unit - Moved in 1995 to 1998 (%) - Multirace
Year householder moved into unit - Moved in 1995 to 1998 (%) - Other Race
Year householder moved into unit - Moved in 1990 to 1994 (%)
Year householder moved into unit - Moved in 1990 to 1994 (%) - White
Year householder moved into unit - Moved in 1990 to 1994 (%) - Black or African American
Year householder moved into unit - Moved in 1990 to 1994 (%) - Asian
Year householder moved into unit - Moved in 1990 to 1994 (%) - Hispanic or Latino
Year householder moved into unit - Moved in 1990 to 1994 (%) - American Indian and Alaska Native
Year householder moved into unit - Moved in 1990 to 1994 (%) - Multirace
Year householder moved into unit - Moved in 1990 to 1994 (%) - Other Race
Year householder moved into unit - Moved in 1980 to 1989 (%)
Year householder moved into unit - Moved in 1980 to 1989 (%) - White
Year householder moved into unit - Moved in 1980 to 1989 (%) - Black or African American
Year householder moved into unit - Moved in 1980 to 1989 (%) - Asian
Year householder moved into unit - Moved in 1980 to 1989 (%) - Hispanic or Latino
Year householder moved into unit - Moved in 1980 to 1989 (%) - American Indian and Alaska Native
Year householder moved into unit - Moved in 1980 to 1989 (%) - Multirace
Year householder moved into unit - Moved in 1980 to 1989 (%) - Other Race
Year householder moved into unit - Moved in 1970 to 1979 (%)
Year householder moved into unit - Moved in 1970 to 1979 (%) - White
Year householder moved into unit - Moved in 1970 to 1979 (%) - Black or African American
Year householder moved into unit - Moved in 1970 to 1979 (%) - Asian
Year householder moved into unit - Moved in 1970 to 1979 (%) - Hispanic or Latino
Year householder moved into unit - Moved in 1970 to 1979 (%) - American Indian and Alaska Native
Year householder moved into unit - Moved in 1970 to 1979 (%) - Multirace
Year householder moved into unit - Moved in 1970 to 1979 (%) - Other Race
Year householder moved into unit - Moved in 1969 or earlier (%)
Year householder moved into unit - Moved in 1969 or earlier (%) - White
Year householder moved into unit - Moved in 1969 or earlier (%) - Black or African American
Year householder moved into unit - Moved in 1969 or earlier (%) - Asian
Year householder moved into unit - Moved in 1969 or earlier (%) - Hispanic or Latino
Year householder moved into unit - Moved in 1969 or earlier (%) - American Indian and Alaska Native
Year householder moved into unit - Moved in 1969 or earlier (%) - Multirace
Year householder moved into unit - Moved in 1969 or earlier (%) - Other Race
Housing units lacking complete plumbing facilities (%)
Housing units lacking complete kitchen facilities (%)
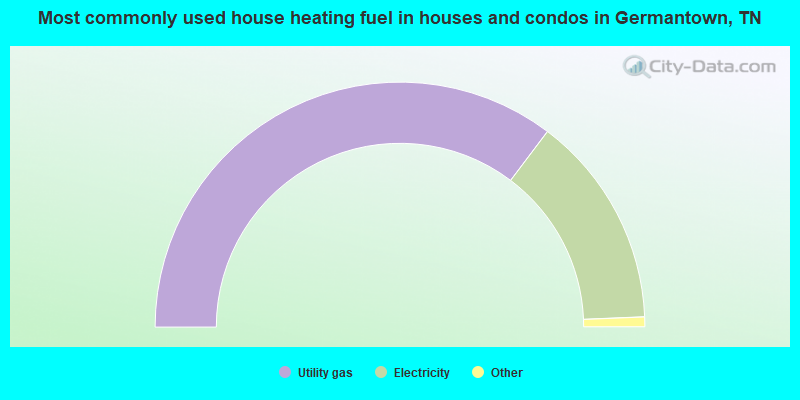
House heating fuel used in houses and condos - Utility gas (%)
House heating fuel used in houses and condos - Bottled, tank, or LP gas (%)
House heating fuel used in houses and condos - Electricity (%)
House heating fuel used in houses and condos - Fuel oil, kerosene, etc. (%)
House heating fuel used in houses and condos - Coal or coke (%)
House heating fuel used in houses and condos - Wood (%)
House heating fuel used in houses and condos - Solar energy (%)
House heating fuel used in houses and condos - Other fuel (%)
House heating fuel used in houses and condos - No fuel used (%)
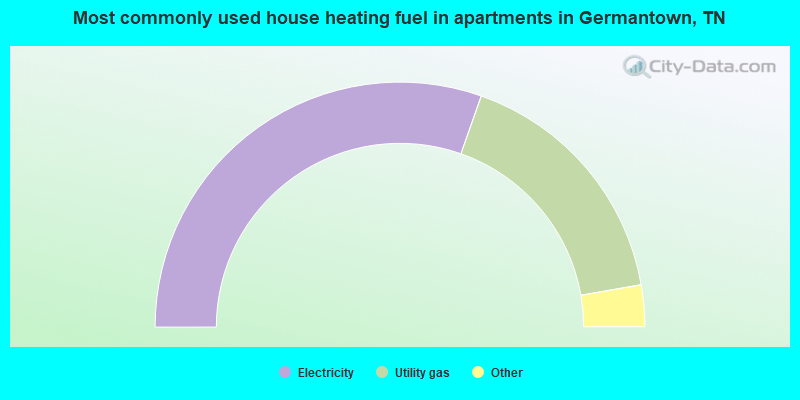
House heating fuel used in apartments - Utility gas (%)
House heating fuel used in apartments - Bottled, tank, or LP gas (%)
House heating fuel used in apartments - Electricity (%)
House heating fuel used in apartments - Fuel oil, kerosene, etc. (%)
House heating fuel used in apartments - Coal or coke (%)
House heating fuel used in apartments - Wood (%)
House heating fuel used in apartments - Solar energy (%)
House heating fuel used in apartments - Other fuel (%)
House heating fuel used in apartments - No fuel used (%)
Latest news about housing in Germantown, TN collected exclusively by city-data.com from local newspapers, TV, and radio stations
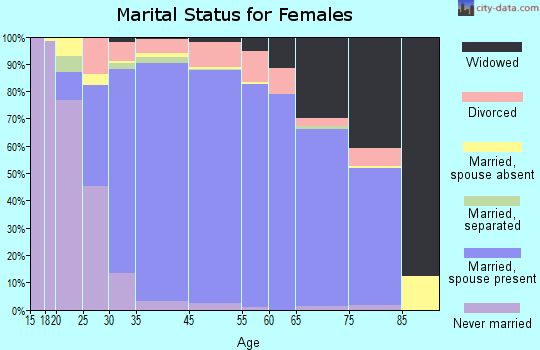
Median year house/condo built: 1980Median year apartment built: 1989Household type by relationship:
Households: 40,647
Male householders: 8,117 (1,263 living alone ), Female householders: 7,091 (2,154 living alone )10,462 spouses (10,390 opposite-sex spouses ), 120 unmarried partners , (120 opposite-sex unmarried partners ), 13,234 children (12,210 natural , 461 adopted , 561 stepchildren ), 485 grandchildren , 133 brothers or sisters , 384 parents , 0 foster children , 128 other relatives , 355 non-relatives In group quarters: 133
Size of family households: 5,461 2-persons , 2,451 3-persons , 2,560 4-persons , 871 5-persons , 383 6-persons , 171 7-or-more-persons .
Size of nonfamily households: 3,394 1-person , 201 2-persons , 13 3-persons , 17 4-persons .
9,309 married couples with children. single-parent households (339 men , 594 women ).
91.7% of residents of Germantown speak English at home. of residents speak Spanish at home (81% speak English very well , 9% speak English well , 10% speak English not well ).of residents speak other Indo-European language at home (98% speak English very well , 2% speak English well ).of residents speak Asian or Pacific Island language at home (72% speak English very well , 17% speak English well , 3% speak English not well , 8% don't speak English at all ).of residents speak other language at home (94% speak English very well , 6% speak English well ).
Foreign born population: 3,446 (8.5%)of them are naturalized citizens )
Median number of rooms in houses and condos:
Median number of rooms in apartments
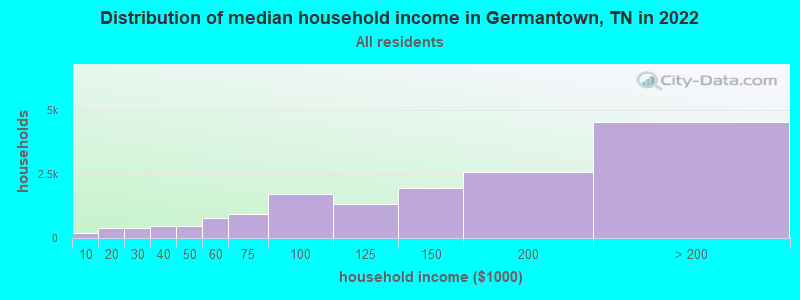
Germantown, TN household income distribution 209 Less than $10,000408 $10,000 to $19,999406 $20,000 to $29,999480 $30,000 to $39,999473 $40,000 to $49,999763 $50,000 to $59,999922 $60,000 to $74,9991,718 $75,000 to $99,9991,339 $100,000 to $124,9991,943 $125,000 to $149,9992,574 $150,000 to $199,9994,531 $200,000 or more
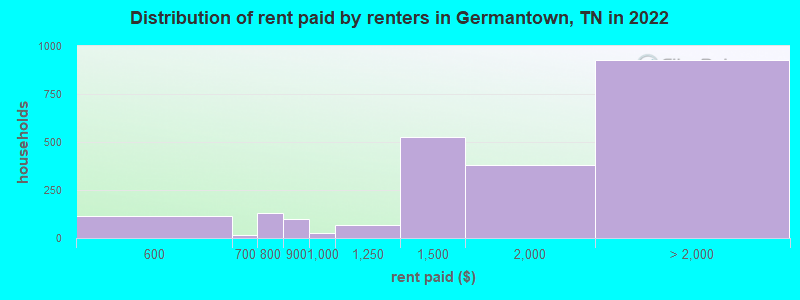
Home value of owner - occupied houses in 2022 in Germantown, TN 46 Less than $10,00010 $15,000 to $19,99910 $25,000 to $29,99910 $30,000 to $34,99913 $35,000 to $39,99913 $40,000 to $49,99911 $50,000 to $59,99951 $80,000 to $89,99941 $90,000 to $99,99946 $100,000 to $124,99927 $125,000 to $149,99948 $150,000 to $174,999215 $175,000 to $199,999622 $200,000 to $249,9991,413 $250,000 to $299,9995,052 $300,000 to $399,9993,549 $400,000 to $499,9993,714 $500,000 to $749,999976 $750,000 to $999,999353 $1,000,000 to $1,499,99927 $1,500,000 to $1,999,99997 $2,000,000 or moreRent paid by renters in 2022 in Germantown, TN 111 $500 to $54915 $650 to $699129 $700 to $749100 $800 to $89927 $900 to $99969 $1,000 to $1,249528 $1,250 to $1,499380 $1,500 to $1,999257 $2,000 to $2,499218 $2,500 to $2,999162 $3,000 to $3,499122 $3,500 or more165 No cash rent
Percentage of workers working in this county: 97.2%Number of people working at home: 4,341 (22.8% of all workers )
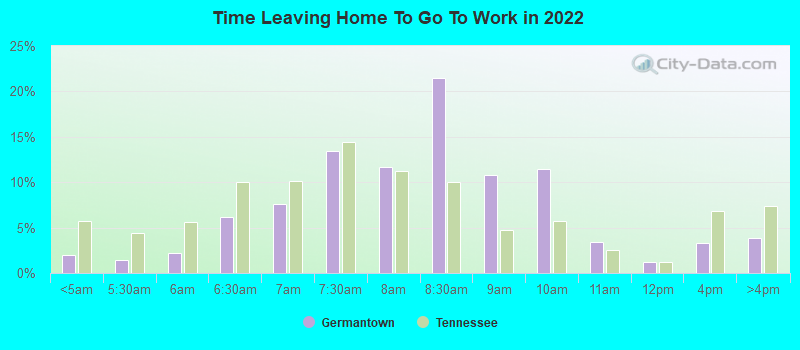
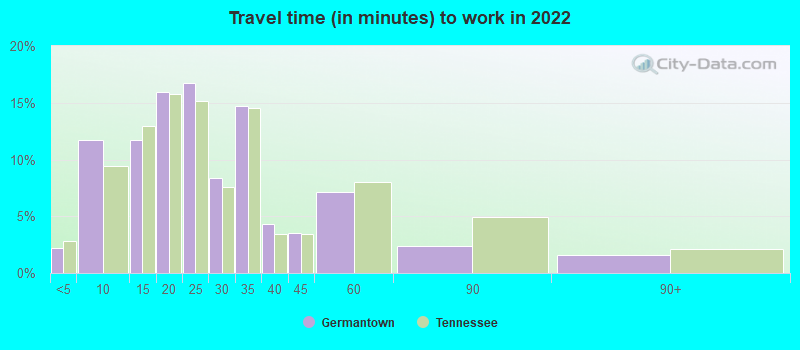
Travel time to work (commute)
Less than 5 minutes: 2665 to 9 minutes: 2,12310 to 14 minutes: 2,38115 to 19 minutes: 2,69220 to 24 minutes: 2,63525 to 29 minutes: 1,38530 to 34 minutes: 2,46335 to 39 minutes: 52440 to 44 minutes: 43145 to 59 minutes: 51060 to 89 minutes: 9690 or more minutes: 67
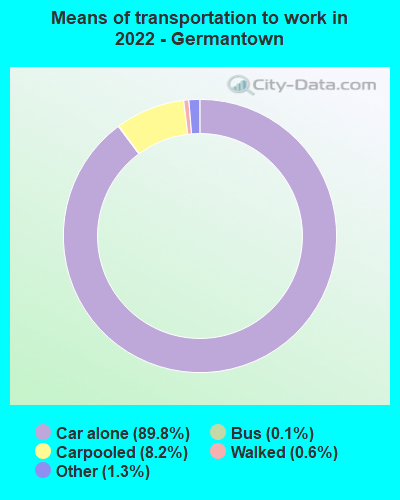
Means of transportation to work:
Drove a car alone: 15,424 (73.6%)Carpooled: 1,549 (7.4%)Bus : 16 (0.1%)Taxi: 262 (1.3%)Bicycle: 9 (0.0%)Walked: 147 (0.7%)Worked at home: 4,341 (20.7%)
Unemployment by race in 2022
Unemployment rate for White non-Hispanic residents 1.5% Males3.4% FemalesUnemployment rate for two or more race residents 9.7% MalesUnemployment rate for Hispanic or Latino residents 3.9% Males
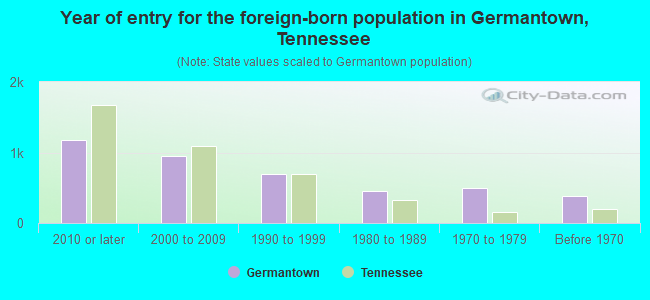
Year of entry for the foreign-born population in Germantown, Tennessee
1,173 2010 or later 946 2000 to 2009 692 1990 to 1999 452 1980 to 1989 501 1970 to 1979 377 Before 1970
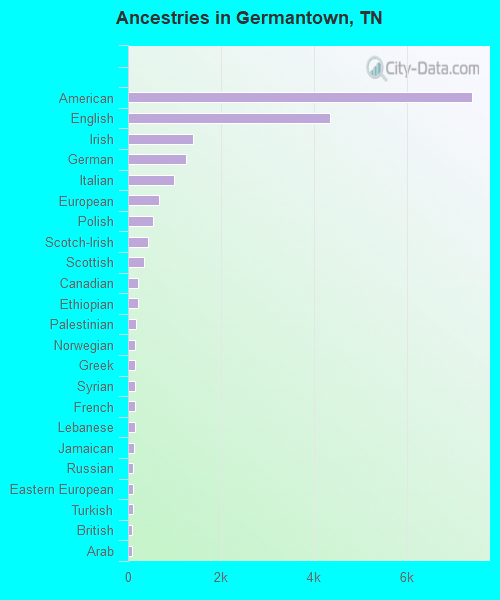
First ancestries reported:
American: 7,397 (30.0%)
English: 4,345 (17.6%)
Irish: 1,398 (5.7%)
German: 1,253 (5.1%)
Italian: 980 (4.0%)
European: 667 (2.7%)
Polish: 542 (2.2%)
Scotch-Irish: 430 (1.7%)
Scottish: 338 (1.4%)
Canadian: 219 (0.9%)
Ethiopian: 212 (0.9%)
Palestinian: 175 (0.7%)
Norwegian: 157 (0.6%)
Greek: 152 (0.6%)
Syrian: 152 (0.6%)
French: 148 (0.6%)
Lebanese: 143 (0.6%)
Jamaican: 119 (0.5%)
Russian: 109 (0.4%)
Eastern European: 102 (0.4%)
Turkish: 100 (0.4%)
British: 91 (0.4%)
Arab: 87 (0.4%)
Somali: 60 (0.2%)
Ukrainian: 58 (0.2%)
Czech: 54 (0.2%)
Hungarian: 49 (0.2%)
Scandinavian: 49 (0.2%)
Northern European: 45 (0.2%)
Swedish: 44 (0.2%)
Belgian: 38 (0.2%)
Iranian: 32 (0.1%)
Dutch: 32 (0.1%)
Finnish: 29 (0.1%)
Romanian: 25 (0.1%)
Egyptian: 22 (0.09%)
French Canadian: 21 (0.09%)
Nigerian: 20 (0.08%)
Albanian: 17 (0.07%)
Danish: 17 (0.07%)
Jordanian: 15 (0.06%)
Lithuanian: 15 (0.06%)
Welsh: 14 (0.06%)
Armenian: 13 (0.05%)
Slovene: 12 (0.05%)
Croatian: 11 (0.04%)
Most common places of birth for foreign-born residents (%): China, excluding Hong Kong and Taiwan Germantown:
16.6% (573)Tennessee:
3.3% (12,582)
India Germantown:
16.3% (563)Tennessee:
6.1% (23,079)
Canada Germantown:
8.5% (295)Tennessee:
2.7% (10,295)
Korea Germantown:
4.6% (158)Tennessee:
2.3% (8,490)
Other Northern Africa Germantown:
3.7% (129)Tennessee:
0.1% (276)
Mexico Germantown:
3.2% (110)Tennessee:
23.0% (86,435)
Jamaica Germantown:
3.2% (110)Tennessee:
0.6% (2,405)
England Germantown:
3.1% (106)Tennessee:
1.2% (4,587)
Colombia Germantown:
2.8% (96)Tennessee:
1.0% (3,879)
Vietnam Germantown:
2.6% (89)Tennessee:
2.4% (8,894)
Ethiopia Germantown:
2.2% (77)Tennessee:
1.4% (5,265)
Venezuela Germantown:
2.2% (77)Tennessee:
1.6% (5,936)
Syria Germantown:
2.0% (70)Tennessee:
0.1% (476)
Jordan Germantown:
1.8% (62)Tennessee:
0.3% (980)
Germany Germantown:
1.8% (61)Tennessee:
2.2% (8,261)
Lebanon Germantown:
1.7% (60)Tennessee:
0.3% (1,042)
Russia Germantown:
1.6% (56)Tennessee:
0.7% (2,448)
Asia, n.e.c. Germantown:
1.6% (54)Tennessee:
0.2% (787)
Malaysia Germantown:
1.5% (52)Tennessee:
0.3% (1,136)
Place of birth for U.S.-born residents:
This state: 18,998Other state: 17,926Northeast: 1,780Midwest: 4,470South: 9,577West: 2,042 90.9% of Germantown residents lived in the same house 1 years ago.
Out of people who lived in different houses, 36.5% lived in this county.
Out of people who lived in different counties, 25.1% lived in Tennessee.
Germantown:
90.9%State average:
87.0%
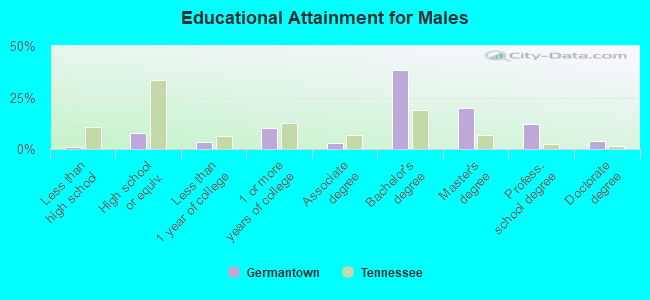
Education attainment for males 25 years and older:
No schooling: 2Nursery to 4th grade: 05th and 6th grade: 07th and 8th grade: 139th grade: 010th grade: 011th grade: 012th grade, no diploma: 117High school graduate (or equivalency): 1,056Less than 1 year of college: 446Some college more than 1 year, no degree: 1,432Associate degree: 435Bachelor's degree: 5,305Master's degree: 2,773Professional school degree: 1,708Doctorate degree: 520
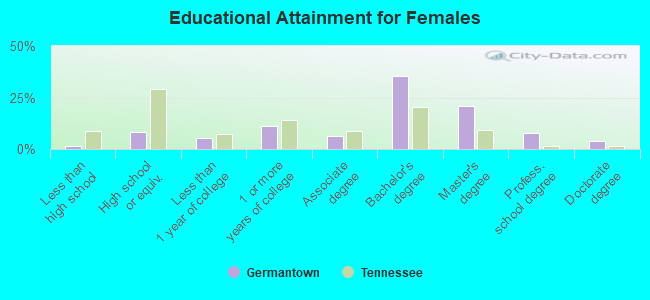
Education attainment for females 25 years and older:
No schooling: 43Nursery to 4th grade: 05th and 6th grade: 87th and 8th grade: 209th grade: 410th grade: 10011th grade: 012th grade, no diploma: 41High school graduate (or equivalency): 1,224Less than 1 year of college: 783Some college more than 1 year, no degree: 1,686Associate degree: 974Bachelor's degree: 5,275Master's degree: 3,117Professional school degree: 1,136Doctorate degree: 573
Housing units in structures:
One, detached: 13,333One, attached: 728Two: 163 or 4: 3865 to 9: 44610 to 19: 7920 to 49: 8150 or more: 1,012Mobile homes: 39Boats, RVs, vans, etc.: 11Housing units lacking complete plumbing facilities in 2022: 0.2%Housing units lacking complete kitchen facilities in 2022: 0.7%House/condo owner moved in on average 10 years ago
Renter moved in on average 3 years ago
Private vs. public school enrollment:
Students in private schools in grades 1 to 8 (elementary and middle school): 1,187 Here:
23.1%Tennessee:
15.0%
Students in private schools in grades 9 to 12 (high school): 706 Here:
25.2%Tennessee:
16.2%
Students in private undergraduate colleges: 129 Here:
18.8%Tennessee:
23.5%