Races in Germantown, Tennessee (TN) Detailed Stats
Data:
Races - White alone (%)
Races - White alone (% change since 2000)
Races - Black alone (%)
Races - Black alone (% change since 2000)
Races - American Indian alone (%)
Races - American Indian alone (% change since 2000)
Races - Asian alone (%)
Races - Asian alone (% change since 2000)
Races - Hispanic (%)
Races - Hispanic (% change since 2000)
Races - Native Hawaiian and Other Pacific Islander alone (%)
Races - Native Hawaiian and Other Pacific Islander alone (% change since 2000)
Races - Two or more races(%)
Races - Two or more races(% change since 2000)
Races - Other race alone (%)
Races - Other race alone (% change since 2000)
Racial diversity
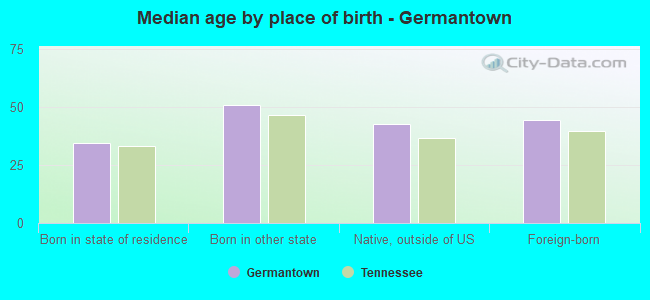
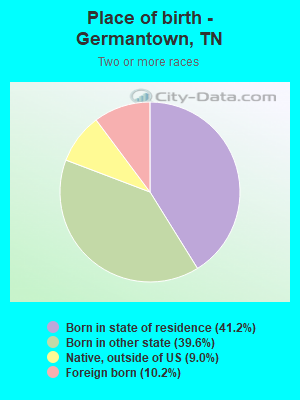
Place of birth - Born in state of residence (%)
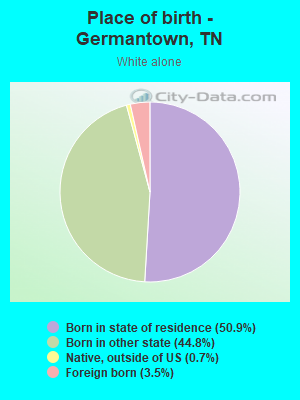
Place of birth - Born in state of residence (%) - White
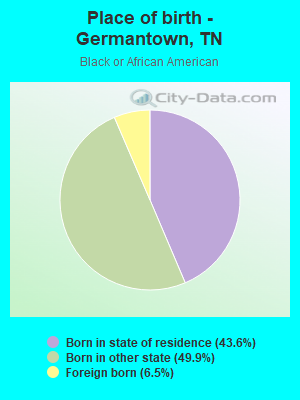
Place of birth - Born in state of residence (%) - Black or African American
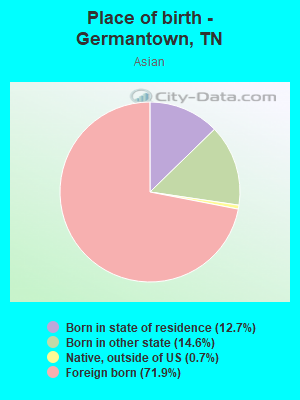
Place of birth - Born in state of residence (%) - Asian
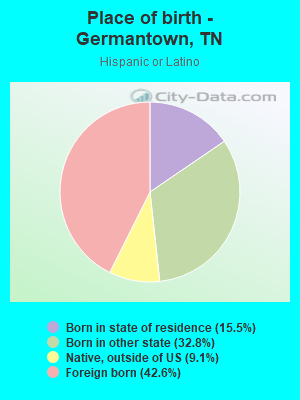
Place of birth - Born in state of residence (%) - Hispanic or Latino
Place of birth - Born in state of residence (%) - American Indian and Alaska Native
Place of birth - Born in state of residence (%) - Multirace
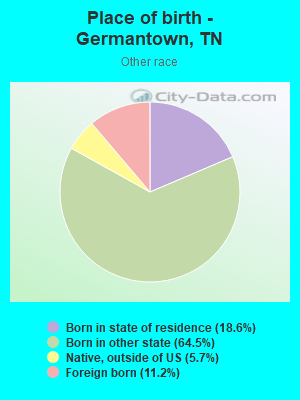
Place of birth - Born in state of residence (%) - Other Race
Place of birth - Born in other state (%)
Place of birth - Born in other state (%) - White
Place of birth - Born in other state (%) - Black or African American
Place of birth - Born in other state (%) - Asian
Place of birth - Born in other state (%) - Hispanic or Latino
Place of birth - Born in other state (%) - American Indian and Alaska Native
Place of birth - Born in other state (%) - Multirace
Place of birth - Born in other state (%) - Other Race
Place of birth - Native, outside of US (%)
Place of birth - Native, outside of US (%) - White
Place of birth - Native, outside of US (%) - Black or African American
Place of birth - Native, outside of US (%) - Asian
Place of birth - Native, outside of US (%) - Hispanic or Latino
Place of birth - Native, outside of US (%) - American Indian and Alaska Native
Place of birth - Native, outside of US (%) - Multirace
Place of birth - Native, outside of US (%) - Other Race
Place of birth - Foreign born (%)
Place of birth - Foreign born (%) - White
Place of birth - Foreign born (%) - Black or African American
Place of birth - Foreign born (%) - Asian
Place of birth - Foreign born (%) - Hispanic or Latino
Place of birth - Foreign born (%) - American Indian and Alaska Native
Place of birth - Foreign born (%) - Multirace
Place of birth - Foreign born (%) - Other Race
Residents speaking English at home (%)
Residents speaking English at home - Born in the United States (%)
Residents speaking English at home - Native, born elsewhere (%)
Residents speaking English at home - Foreign born (%)
Residents speaking Spanish at home (%)
Residents speaking Spanish at home - Born in the United States (%)
Residents speaking Spanish at home - Native, born elsewhere (%)
Residents speaking Spanish at home - Foreign born (%)
Residents speaking other language at home (%)
Residents speaking other language at home - Born in the United States (%)
Residents speaking other language at home - Native, born elsewhere (%)
Residents speaking other language at home - Foreign born (%)
Marital status - Never married (%)
Marital status - Now married (%)
Marital status - Separated (%)
Marital status - Widowed (%)
Marital status - Divorced (%)
Ancestries Reported - Arab (%)
Ancestries Reported - Czech (%)
Ancestries Reported - Danish (%)
Ancestries Reported - Dutch (%)
Ancestries Reported - English (%)
Ancestries Reported - French (%)
Ancestries Reported - French Canadian (%)
Ancestries Reported - German (%)
Ancestries Reported - Greek (%)
Ancestries Reported - Hungarian (%)
Ancestries Reported - Irish (%)
Ancestries Reported - Italian (%)
Ancestries Reported - Lithuanian (%)
Ancestries Reported - Norwegian (%)
Ancestries Reported - Polish (%)
Ancestries Reported - Portuguese (%)
Ancestries Reported - Russian (%)
Ancestries Reported - Scotch-Irish (%)
Ancestries Reported - Scottish (%)
Ancestries Reported - Slovak (%)
Ancestries Reported - Subsaharan African (%)
Ancestries Reported - Swedish (%)
Ancestries Reported - Swiss (%)
Ancestries Reported - Ukrainian (%)
Ancestries Reported - United States (%)
Ancestries Reported - Welsh (%)
Ancestries Reported - West Indian (%)
Ancestries Reported - Other (%)
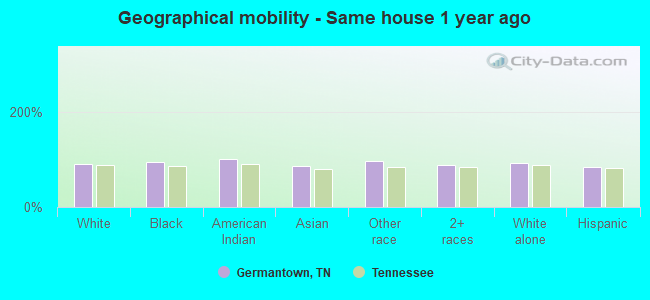
Geographical mobility - Same house 1 year ago (%)
Geographical mobility - Same house 1 year ago (%) - White
Geographical mobility - Same house 1 year ago (%) - Black or African American
Geographical mobility - Same house 1 year ago (%) - Asian
Geographical mobility - Same house 1 year ago (%) - Hispanic or Latino
Geographical mobility - Same house 1 year ago (%) - American Indian and Alaska Native
Geographical mobility - Same house 1 year ago (%) - Multirace
Geographical mobility - Same house 1 year ago (%) - Other Race
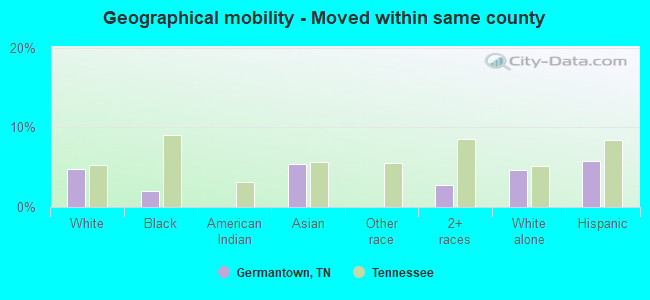
Geographical mobility - Moved within same county (%)
Geographical mobility - Moved within same county (%) - White
Geographical mobility - Moved within same county (%) - Black or African American
Geographical mobility - Moved within same county (%) - Asian
Geographical mobility - Moved within same county (%) - Hispanic or Latino
Geographical mobility - Moved within same county (%) - American Indian and Alaska Native
Geographical mobility - Moved within same county (%) - Multirace
Geographical mobility - Moved within same county (%) - Other Race
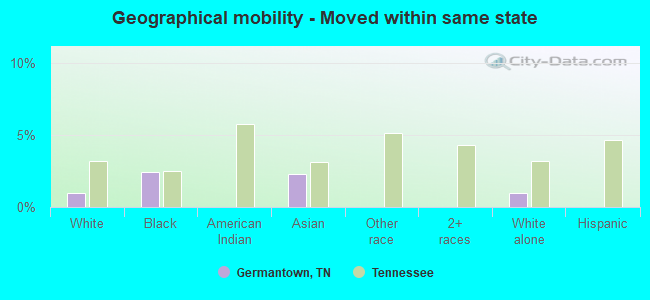
Geographical mobility - Moved from different county within same state (%)
Geographical mobility - Moved from different county within same state (%) - White
Geographical mobility - Moved from different county within same state (%) - Black or African American
Geographical mobility - Moved from different county within same state (%) - Asian
Geographical mobility - Moved from different county within same state (%) - Hispanic or Latino
Geographical mobility - Moved from different county within same state (%) - American Indian and Alaska Native
Geographical mobility - Moved from different county within same state (%) - Multirace
Geographical mobility - Moved from different county within same state (%) - Other Race
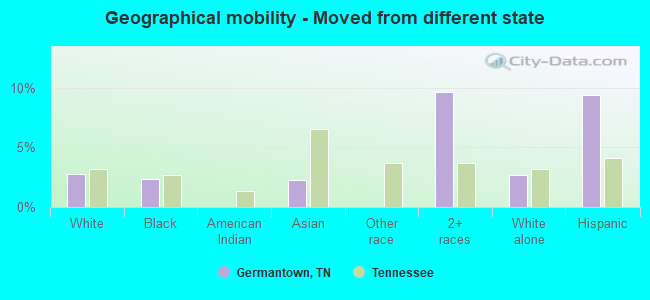
Geographical mobility - Moved from different state (%)
Geographical mobility - Moved from different state (%) - White
Geographical mobility - Moved from different state (%) - Black or African American
Geographical mobility - Moved from different state (%) - Asian
Geographical mobility - Moved from different state (%) - Hispanic or Latino
Geographical mobility - Moved from different state (%) - American Indian and Alaska Native
Geographical mobility - Moved from different state (%) - Multirace
Geographical mobility - Moved from different state (%) - Other Race
Geographical mobility - Moved from abroad (%)
Geographical mobility - Moved from abroad (%) - White
Geographical mobility - Moved from abroad (%) - Black or African American
Geographical mobility - Moved from abroad (%) - Asian
Geographical mobility - Moved from abroad (%) - Hispanic or Latino
Geographical mobility - Moved from abroad (%) - American Indian and Alaska Native
Geographical mobility - Moved from abroad (%) - Multirace
Geographical mobility - Moved from abroad (%) - Other Race
Place of birth for the foreign-born population - Ireland (%)
Place of birth for the foreign-born population - Denmark (%)
Place of birth for the foreign-born population - Norway (%)
Place of birth for the foreign-born population - Sweden (%)
Place of birth for the foreign-born population - United Kingdom (%)
Place of birth for the foreign-born population - England (%)
Place of birth for the foreign-born population - Scotland (%)
Place of birth for the foreign-born population - Other Northern Europe (%)
Place of birth for the foreign-born population - Austria (%)
Place of birth for the foreign-born population - Belgium (%)
Place of birth for the foreign-born population - France (%)
Place of birth for the foreign-born population - Germany (%)
Place of birth for the foreign-born population - Netherlands (%)
Place of birth for the foreign-born population - Switzerland (%)
Place of birth for the foreign-born population - Other Western Europe (%)
Place of birth for the foreign-born population - Greece (%)
Place of birth for the foreign-born population - Italy (%)
Place of birth for the foreign-born population - Portugal (%)
Place of birth for the foreign-born population - Spain (%)
Place of birth for the foreign-born population - Other Southern Europe (%)
Place of birth for the foreign-born population - Albania (%)
Place of birth for the foreign-born population - Belarus (%)
Place of birth for the foreign-born population - Bosnia and Herzegovina (%)
Place of birth for the foreign-born population - Bulgaria (%)
Place of birth for the foreign-born population - Croatia (%)
Place of birth for the foreign-born population - Czechoslovakia (%)
Place of birth for the foreign-born population - Hungary (%)
Place of birth for the foreign-born population - Latvia (%)
Place of birth for the foreign-born population - Lithuania (%)
Place of birth for the foreign-born population - North Macedonia (Macedonia) (%)
Place of birth for the foreign-born population - Moldova (%)
Place of birth for the foreign-born population - Poland (%)
Place of birth for the foreign-born population - Romania (%)
Place of birth for the foreign-born population - Russia (%)
Place of birth for the foreign-born population - Serbia (%)
Place of birth for the foreign-born population - Ukraine (%)
Place of birth for the foreign-born population - Other Eastern Europe (%)
Place of birth for the foreign-born population - China (%)
Place of birth for the foreign-born population - Hong Kong (%)
Place of birth for the foreign-born population - Taiwan (%)
Place of birth for the foreign-born population - Japan (%)
Place of birth for the foreign-born population - Korea (%)
Place of birth for the foreign-born population - Other Eastern Asia (%)
Place of birth for the foreign-born population - Afghanistan (%)
Place of birth for the foreign-born population - Bangladesh (%)
Place of birth for the foreign-born population - India (%)
Place of birth for the foreign-born population - Iran (%)
Place of birth for the foreign-born population - Kazakhstan (%)
Place of birth for the foreign-born population - Nepal (%)
Place of birth for the foreign-born population - Pakistan (%)
Place of birth for the foreign-born population - Sri Lanka (%)
Place of birth for the foreign-born population - Uzbekistan (%)
Place of birth for the foreign-born population - Other South Central Asia (%)
Place of birth for the foreign-born population - Burma (%)
Place of birth for the foreign-born population - Cambodia (%)
Place of birth for the foreign-born population - Indonesia (%)
Place of birth for the foreign-born population - Laos (%)
Place of birth for the foreign-born population - Malaysia (%)
Place of birth for the foreign-born population - Philippines (%)
Place of birth for the foreign-born population - Singapore (%)
Place of birth for the foreign-born population - Thailand (%)
Place of birth for the foreign-born population - Vietnam (%)
Place of birth for the foreign-born population - Other South Eastern Asia (%)
Place of birth for the foreign-born population - Armenia (%)
Place of birth for the foreign-born population - Iraq (%)
Place of birth for the foreign-born population - Israel (%)
Place of birth for the foreign-born population - Jordan (%)
Place of birth for the foreign-born population - Kuwait (%)
Place of birth for the foreign-born population - Lebanon (%)
Place of birth for the foreign-born population - Saudi Arabia (%)
Place of birth for the foreign-born population - Syria (%)
Place of birth for the foreign-born population - Turkey (%)
Place of birth for the foreign-born population - Yemen (%)
Place of birth for the foreign-born population - Other Western Asia (%)
Place of birth for the foreign-born population - Eritrea (%)
Place of birth for the foreign-born population - Ethiopia (%)
Place of birth for the foreign-born population - Kenya (%)
Place of birth for the foreign-born population - Somalia (%)
Place of birth for the foreign-born population - Uganda (%)
Place of birth for the foreign-born population - Zimbabwe (%)
Place of birth for the foreign-born population - Other Eastern Africa (%)
Place of birth for the foreign-born population - Cameroon (%)
Place of birth for the foreign-born population - Congo (%)
Place of birth for the foreign-born population - Democratic Republic of Congo (Zaire) (%)
Place of birth for the foreign-born population - Other Middle Africa (%)
Place of birth for the foreign-born population - Egypt (%)
Place of birth for the foreign-born population - Morocco (%)
Place of birth for the foreign-born population - Sudan (%)
Place of birth for the foreign-born population - Other Northern Africa (%)
Place of birth for the foreign-born population - South Africa (%)
Place of birth for the foreign-born population - Other Southern Africa (%)
Place of birth for the foreign-born population - Cabo Verde (%)
Place of birth for the foreign-born population - Ghana (%)
Place of birth for the foreign-born population - Liberia (%)
Place of birth for the foreign-born population - Nigeria (%)
Place of birth for the foreign-born population - Senegal (%)
Place of birth for the foreign-born population - Sierra Leone (%)
Place of birth for the foreign-born population - Other Western Africa (%)
Place of birth for the foreign-born population - Australia (%)
Place of birth for the foreign-born population - New Zealand (%)
Place of birth for the foreign-born population - Fiji (%)
Place of birth for the foreign-born population - Micronesia (%)
Place of birth for the foreign-born population - Bahamas (%)
Place of birth for the foreign-born population - Barbados (%)
Place of birth for the foreign-born population - Cuba (%)
Place of birth for the foreign-born population - Dominica (%)
Place of birth for the foreign-born population - Dominican Republic (%)
Place of birth for the foreign-born population - Grenada (%)
Place of birth for the foreign-born population - Haiti (%)
Place of birth for the foreign-born population - Jamaica (%)
Place of birth for the foreign-born population - St. Vincent and the Grenadines (%)
Place of birth for the foreign-born population - Trinidad and Tobago (%)
Place of birth for the foreign-born population - West Indies (%)
Place of birth for the foreign-born population - Other Caribbean (%)
Place of birth for the foreign-born population - Belize (%)
Place of birth for the foreign-born population - Costa Rica (%)
Place of birth for the foreign-born population - El Salvador (%)
Place of birth for the foreign-born population - Guatemala (%)
Place of birth for the foreign-born population - Honduras (%)
Place of birth for the foreign-born population - Mexico (%)
Place of birth for the foreign-born population - Nicaragua (%)
Place of birth for the foreign-born population - Panama (%)
Place of birth for the foreign-born population - Other Central America (%)
Place of birth for the foreign-born population - Argentina (%)
Place of birth for the foreign-born population - Bolivia (%)
Place of birth for the foreign-born population - Brazil (%)
Place of birth for the foreign-born population - Chile (%)
Place of birth for the foreign-born population - Colombia (%)
Place of birth for the foreign-born population - Ecuador (%)
Place of birth for the foreign-born population - Guyana (%)
Place of birth for the foreign-born population - Peru (%)
Place of birth for the foreign-born population - Uruguay (%)
Place of birth for the foreign-born population - Venezuela (%)
Place of birth for the foreign-born population - Other South America (%)
Place of birth for the foreign-born population - Canada (%)
Place of birth for the foreign-born population - Other Northern America (%)
Place of birth for the foreign-born population - Other (%)
Latest news about races in Germantown, TN collected exclusively by city-data.com from local newspapers, TV, and radio stations
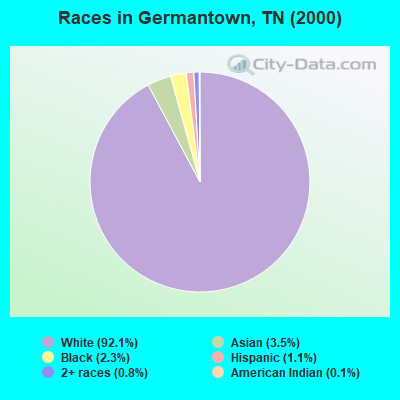
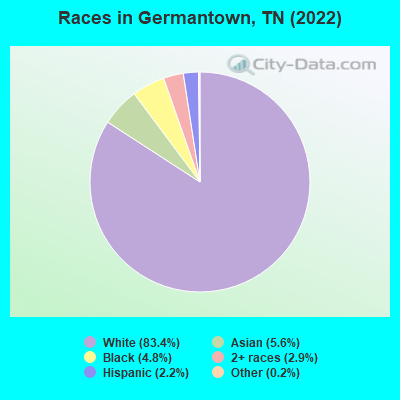
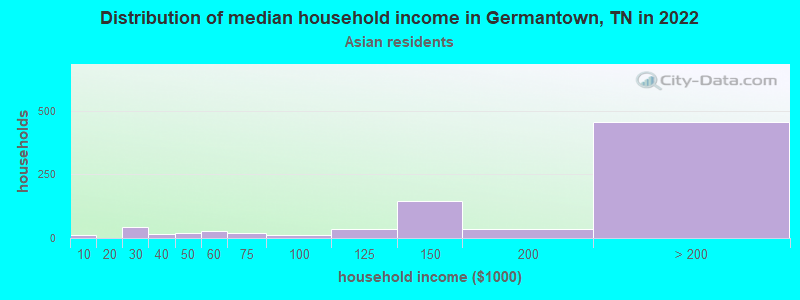
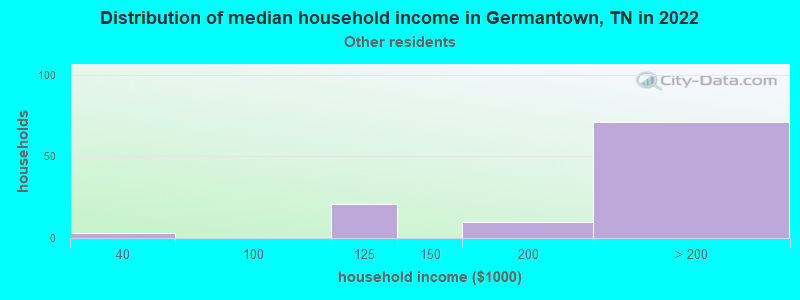
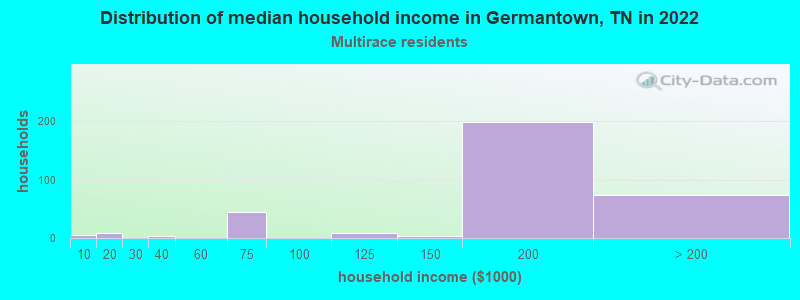
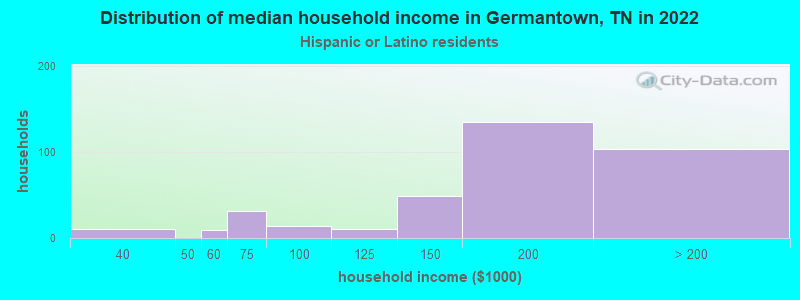
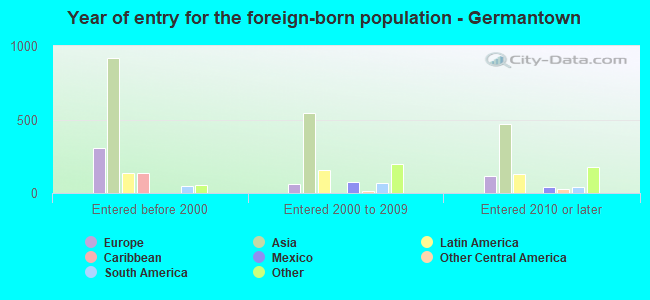
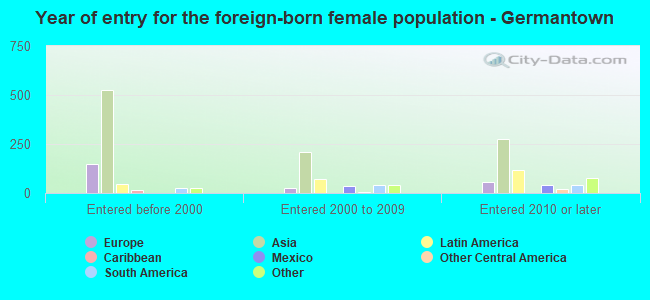
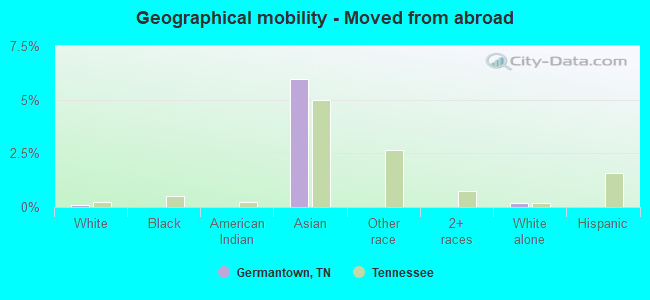
According to 2022 data, the most numerous races in Germantown, TN are White alone (33,912 residents), Black alone (1,957 residents), and Hispanic (902 residents). 91.1% of Germantown residents speak English at home. 8.5% of Germantown, TN residents are foreign-born (4.9% born in Asia, 1.1% born in Latin America, 1.0% born in Europe), which is 41.1% greater than the foreign-born rate of 5.0% across the entire state of Tennessee.
Race distribution in Germantown
2000 2022
4,505,930 79.2% White alone 928,204 16.3% Black alone 123,838 2.2% Hispanic 54,824 1.0% Two or more races 56,077 1.0% Asian alone 13,820 0.2% American Indian alone 4,780 0.08% Other race alone 1,810 0.03% Native Hawaiian and Other
5,070,026 71.9% White alone 1,089,738 15.5% Black alone 442,629 6.3% Hispanic 279,381 4.0% Two or more races 131,817 1.9% Asian alone 26,972 0.4% Other race alone 6,387 0.09% American Indian alone 4,389 0.06% Native Hawaiian and Other
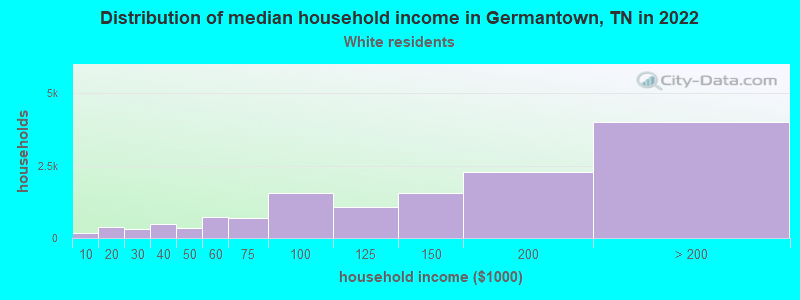
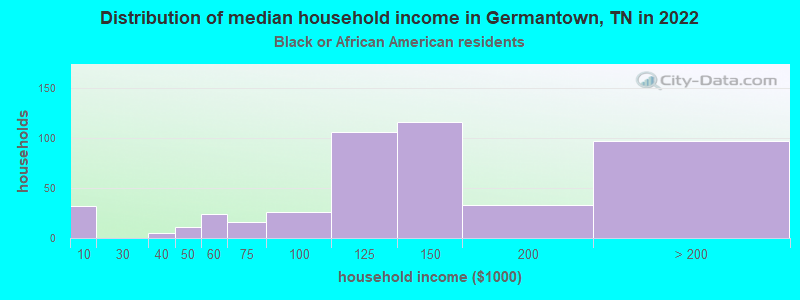
Income and house value in Germantown Median household income in 2022 $137,567 White non-Hispanic householders$134,437 Black householdersover $200,000 Asian householdersover $200,000 Some other race householders$184,544 Two or more races householders$193,279 Hispanic or Latino race householdersMedian 2022 house value $492,478 White Non-Hispanic householders$455,156 Black or African American householders$193,441 American Indian or Alaska Native householders $583,737 Asian householders$421,929 Some other race householders$364,124 Two or more races householders$301,996 Hispanic or Latino householders
Median age by race in Germantown
45.1 Median age for White residents44.8 45.1 23.8 Median age for Black or African American residents23.5 33.0 -1,525,641,024.1 Median age for American Indian / Alaska Native residents-1,325,757,574.4 -801,477,376.9 44.2 Median age for Asian residents35.5 45.2 -480,757,844.4 Median age for Native Hawaiian / Pacific Islander residents-951,707,890.7 -671,105,192.4 44.9 Median age for Other race residents42.0 23.9 18.1 Median age for Two or more races residents21.6 20.9 44.6 Median age for White alone residents44.6 44.1 42.8 Median age for Hispanic or Latino residents43.1 40.9
Owner/renter occupied households by race in Germantown
House owners and renters - White residents 11,818 87.8% Owner occupied1,636 12.2% Renter occupiedHouse owners and renters - Black or African American residents 388 82.2% Owner occupied84 17.8% Renter occupiedHouse owners and renters - Asian residents 800 92.6% Owner occupied64 7.4% Renter occupiedHouse owners and renters - Other race residents 117 100.0% Owner occupiedHouse owners and renters - Two or more races residents 227 82.5% Owner occupied48 17.5% Renter occupiedHouse owners and renters - White alone residents 11,882 87.5% Owner occupied1,700 12.5% Renter occupiedHouse owners and renters - Hispanic or Latino residents 198 83.0% Owner occupied41 17.0% Renter occupied
Language usage in Germantown
English speakers - Total 91.1% of residents of Germantown speak English at home.
1.8% of residents speak Spanish at home 542 80.8% Speak English very well129 19.2% Speak English less than very well7.0% of residents speak other language at home 2,296 86.2% Speak English very well367 13.8% Speak English less than very well
English speakers - Born in the United States 98.0% of residents of Germantown speak English at home.
1.2% of residents speak Spanish at home 192 90.1% Speak English very well21 9.9% Speak English less than very well0.9% of residents speak other language at home 148 91.9% Speak English very well13 8.1% Speak English less than very well
English speakers - Native, born elsewhere 74.5% of residents of Germantown speak English at home.
10.6% of residents speak Spanish at home 44 100.0% Speak English very well19.5% of residents speak other language at home 81 100.0% Speak English very well
English speakers - Foreign-born 25.8% of residents of Germantown speak English at home.
12.0% of residents speak Spanish at home 301 74.3% Speak English very well104 25.7% Speak English less than very well60.6% of residents speak other language at home 1,724 84.5% Speak English very well316 15.5% Speak English less than very well
White (Caucasian) - Speak only English Native:
99.5% (30,250)Foreign-born:
31.6% (350)
White (Caucasian) - Speak another language Native:
1.2% (352)Foreign-born:
67.8% (751)
Black or African American - Speak only English Native:
96.2% (1,637)Foreign-born:
46.4% (59)
Black or African American - Speak another language Native:
3.9% (66)Foreign-born:
55.6% (71)
Asian - Speak only English Native:
72.4% (457)Foreign-born:
23.2% (369)
Asian - Speak another language Native:
30.5% (193)Foreign-born:
78.9% (1,253)
Other race - Speak only English Native:
80.8% (218)Foreign-born:
36.7% (13)
Other race - Speak another language Native:
18.5% (50)Foreign-born:
56.6% (20)
Two or more races - Speak only English Native:
84.9% (871)Foreign-born:
61.2% (84)
Two or more races - Speak another language Native:
15.0% (154)Foreign-born:
62.1% (85)
White alone - Speak only English Native:
98.4% (30,288)Foreign-born:
31.0% (344)
White alone - Speak another language Native:
1.5% (476)Foreign-born:
69.7% (774)
Hispanic or Latino - Speak only English Native:
77.2% (335)Foreign-born:
15.3% (60)
Hispanic or Latino - Speak another language Native:
27.3% (118)Foreign-born:
85.4% (336)
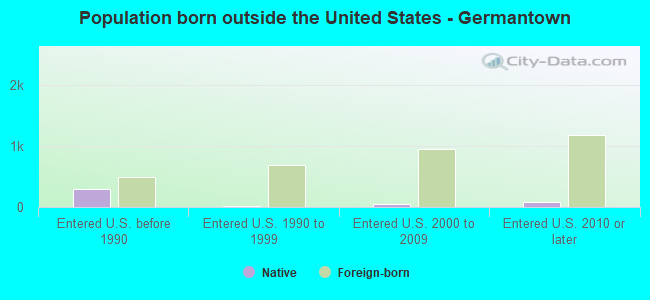
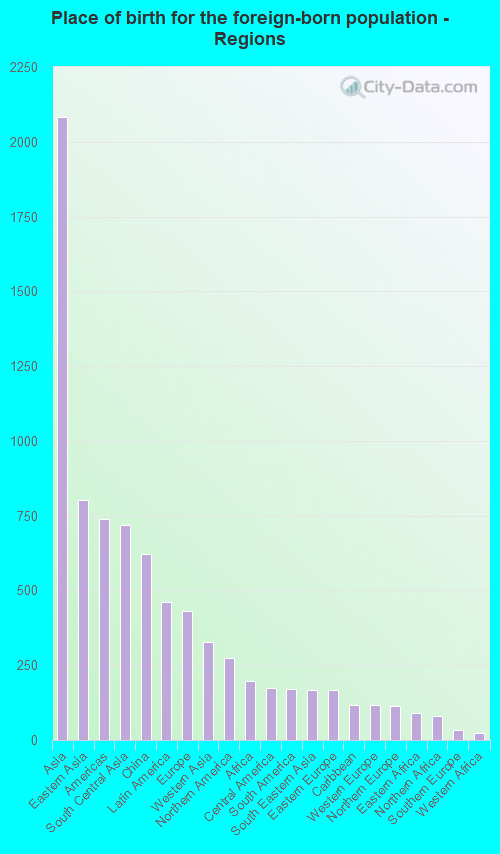
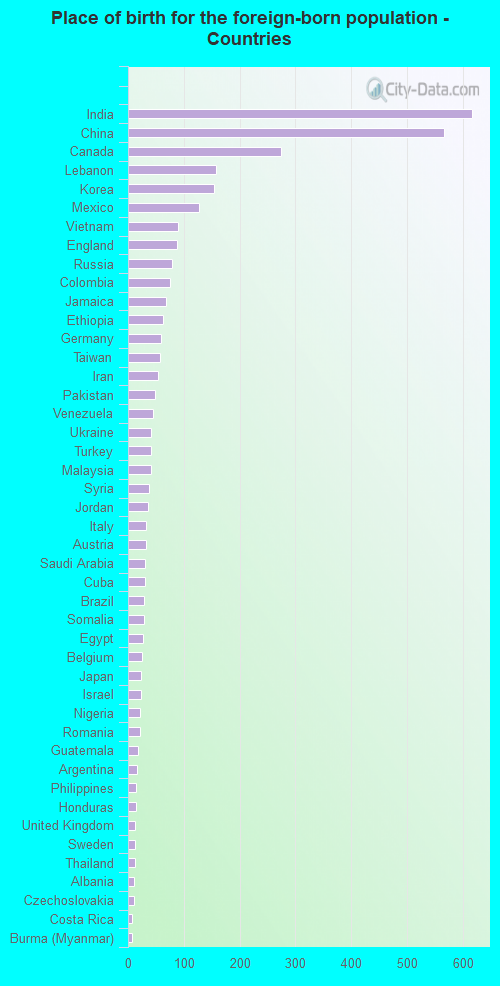
Foreign-born residents in Germantown 3,451 residents are foreign born (4.9% Asia , 1.1% Latin America , 1.0% Europe ).
This city:
8.5%Tennessee:
5.4%
Marital status for residents in Germantown Marital status - White (Caucasian) population 15 years and over
Males 18.2% Never married70.5% Now married0.5% Separated3.4% Widowed7.4% DivorcedFemales 13.9% Never married66.4% Now married1.6% Separated10.9% Widowed7.2% DivorcedWomen who gave birth in the past 12 months Now married:
100.0% (257)Unmarried:
0.0% (0)
Women who did not give birth in the past 12 months Now married:
66.2% (3,949)Unmarried:
33.8% (2,018)
Marital status - Black or African American population 15 years and over
Males 47.3% Never married49.2% Now married0.0% Separated3.4% Widowed0.0% DivorcedFemales 15.0% Never married67.6% Now married0.0% Separated7.8% Widowed9.6% DivorcedWomen who gave birth in the past 12 months Now married:
100.0% (34)Unmarried:
0.0% (0)
Women who did not give birth in the past 12 months Now married:
73.4% (255)Unmarried:
26.6% (92)
Marital status - Asian population 15 years and over
Males 9.2% Never married85.6% Now married3.9% Separated0.0% Widowed1.2% DivorcedFemales 15.4% Never married73.8% Now married0.0% Separated5.2% Widowed5.5% DivorcedWomen who did not give birth in the past 12 months Now married:
69.0% (448)Unmarried:
31.0% (202)
Marital status - Other race population 15 years and over
Males 0.0% Never married100.0% Now married0.0% Separated0.0% Widowed0.0% DivorcedFemales 50.7% Never married42.0% Now married0.0% Separated0.0% Widowed7.2% DivorcedWomen who did not give birth in the past 12 months Now married:
25.5% (17)Unmarried:
74.5% (48)
Marital status - Two or more races population 15 years and over
Males 51.3% Never married39.0% Now married0.0% Separated0.0% Widowed9.7% DivorcedFemales 36.9% Never married63.1% Now married0.0% Separated0.0% Widowed0.0% DivorcedWomen who gave birth in the past 12 months Now married:
100.0% (20)Unmarried:
0.0% (0)
Women who did not give birth in the past 12 months Now married:
46.7% (146)Unmarried:
53.3% (167)
Marital status - White alone, not Hispanic / Latino population 15 years and over
Males 18.3% Never married70.5% Now married0.5% Separated3.3% Widowed7.4% DivorcedFemales 13.8% Never married66.4% Now married1.6% Separated11.1% Widowed7.1% DivorcedWomen who gave birth in the past 12 months Now married:
100.0% (267)Unmarried:
0.0% (0)
Women who did not give birth in the past 12 months Now married:
66.4% (4,073)Unmarried:
33.6% (2,058)
Marital status - Hispanic or Latino population 15 years and over
Males 11.2% Never married82.0% Now married0.0% Separated3.4% Widowed3.4% DivorcedFemales 22.0% Never married67.2% Now married0.0% Separated0.0% Widowed10.8% DivorcedWomen who did not give birth in the past 12 months Now married:
53.7% (85)Unmarried:
46.3% (73)
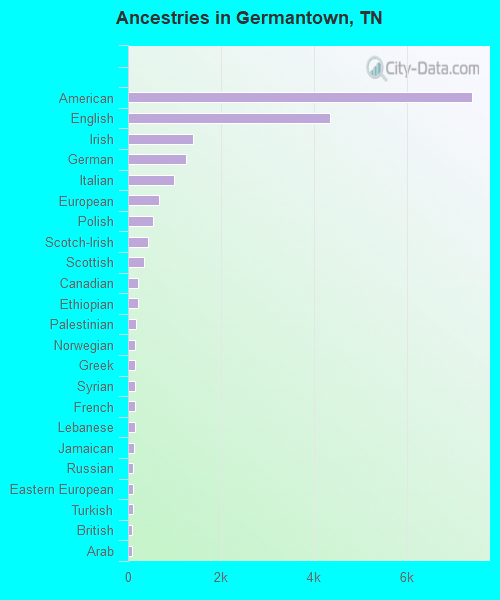
Ancestries in Germantown
7,397 30.0% American4,345 17.6% English1,398 5.7% Irish1,253 5.1% German980 4.0% Italian667 2.7% European542 2.2% Polish430 1.7% Scotch-Irish338 1.4% Scottish219 0.9% Canadian212 0.9% Ethiopian175 0.7% Palestinian157 0.6% Norwegian152 0.6% Greek152 0.6% Syrian148 0.6% French143 0.6% Lebanese119 0.5% Jamaican109 0.4% Russian102 0.4% Eastern European100 0.4% Turkish91 0.4% British87 0.4% Arab60 0.2% Somali58 0.2% Ukrainian54 0.2% Czech49 0.2% Hungarian49 0.2% Scandinavian45 0.2% Northern European44 0.2% Swedish38 0.2% Belgian32 0.1% Iranian32 0.1% Dutch29 0.1% Finnish25 0.1% Romanian22 0.09% Egyptian21 0.09% French Canadian20 0.08% Nigerian17 0.07% Albanian17 0.07% Danish15 0.06% Jordanian15 0.06% Lithuanian14 0.06% Welsh13 0.05% Armenian12 0.05% Slovene11 0.04% Croatian
Geographical mobility in Germantown Same house 1 year ago 30,333 91.4% White (Caucasian)1,798 93.6% Black or African American12 100.0% American Indian / Alaska Native1,951 86.1% Asian307 96.3% Other race1,245 88.1% Two or more races30,841 91.5% White alone, not Hispanic / Latino723 84.4% Hispanic or LatinoMoved within same county 1,570 4.7% White / Caucasian38 2.0% Black or African American121 5.3% Asian40 2.8% Two or more races1,577 4.7% White alone, not Hispanic / Latino50 5.8% Hispanic or LatinoMoved within same state 317 1.0% White / Caucasian47 2.4% Black or African American52 2.3% Asian323 1.0% White alone, not Hispanic / LatinoMoved from different state 927 2.8% White / Caucasian45 2.3% Black or African American52 2.3% Asian136 9.6% Two or more races908 2.7% White alone, not Hispanic / Latino81 9.4% Hispanic or LatinoMoved from abroad 37 0.1% White135 6.0% Asian57 0.2% White alone, not Hispanic / Latino
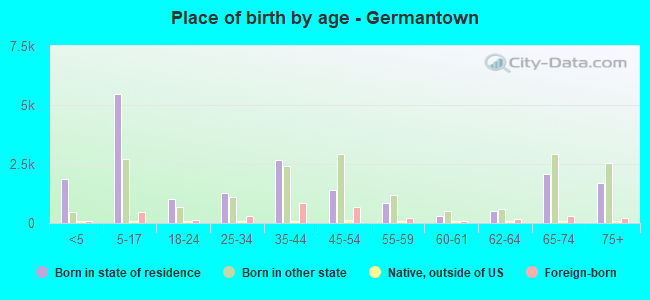
Children Nativity (place of birth) in Germantown
Children under 6 years - Living with two parents Both parents native 2,315 100.0% NativeBoth parents foreign-born 44 18.2% Native197 81.8% Foreign-bornOne native, one foreign-born parent 425 100.0% NativeChildren under 6 years - Living with one parent Native parent 140 100.0% NativeChildren 6 to 17 years - Living with two parents Both parents native 5,037 97.3% Native141 2.7% Foreign-bornBoth parents foreign-born 429 62.6% Native256 37.4% Foreign-bornOne native, one foreign-born parent 410 100.0% NativeChildren 6 to 17 years - Living with one parent Native parent 792 99.8% Native2 0.2% Foreign-bornForeign-born parent 142 55.3% Native115 44.7% Foreign-born
Grandparents responsible for own grandchildren in Germantown
Grandparents (30 to 59 years) White / Caucasian 48 44.0% Responsible for grandchildren61 56.0% Not responsible for grandchildrenWhite alone, not Hispanic / Latino 44 47.3% Responsible for grandchildren50 52.7% Not responsible for grandchildrenGrandparents (60 years and over) White / Caucasian 149 64.3% Responsible for grandchildren83 35.7% Not responsible for grandchildrenWhite alone, not Hispanic / Latino 152 64.4% Responsible for grandchildren84 35.6% Not responsible for grandchildren