Work and Jobs in Germantown, Tennessee (TN) Detailed Stats
Occupations, Industries, Unemployment, Workers, Commute
Settings
X


Recent posts about work in Germantown, Tennessee on our local forum with over 2,400,000 registered users:
 | Oracle moving its world HQ (8500 jobs) to Nashville (5 replies) |
| Active couple with job in Germantown, where to live? (14 replies) |
| Germantown vs. 12 South (18 replies) |
| Moving California to Germantown/Collierville (6 replies) |
| Olive Branch or Germantown? (12 replies) |
| Unemployment statistics in Tennessee (November pre.) (1 reply) |
Latest news about work in Germantown, TN collected exclusively by city-data.com from local newspapers, TV, and radio stations
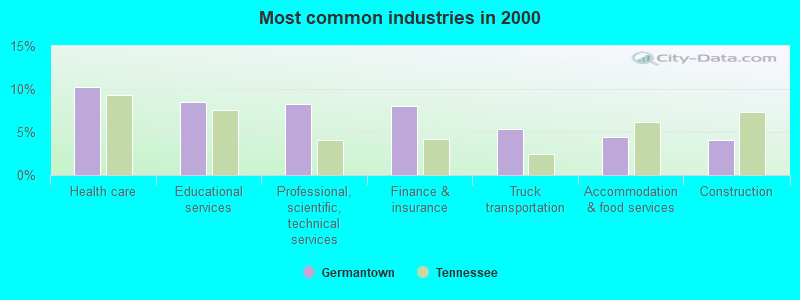
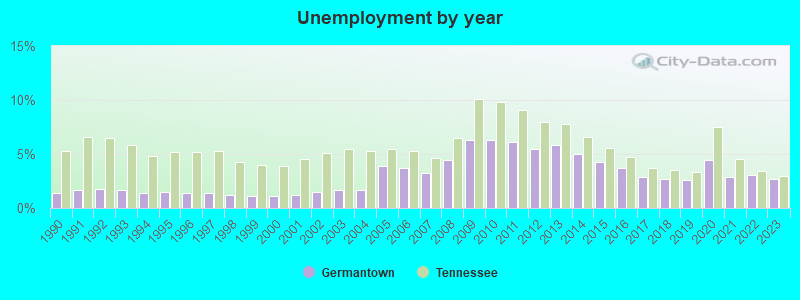
The unemployment rate in 2023 in Germantown, TN was 2.7%, which was 11.1% less than the unemployment rate of 3.0% across the entire state of Tennessee. Compared to the unemployment rate of 5.8% in 2013, this represents a decrease of 114.8%. The most common industries in Germantown are: Health care (10.3% of civilian employees), Educational services (8.5% of civilian employees), Professional, scientific, technical services (8.2% of civilian employees). 96.7% of workers work in Shelby County and 14.3% of all workers work at home. 67.4% of workers are employees of private companies, which is 3.1% less than the rate of 69.4% across the entire state of Tennessee.
Whole page based on the data from 2000 / 2022 when the population of Germantown, Tennessee was 37,348 / 40,647
Whole page based on the data from 2000 / 2022 when the population of Germantown, Tennessee was 37,348 / 40,647
Most common industries
Most common industries | |||
|---|---|---|---|
Industry | All | Males | Females |
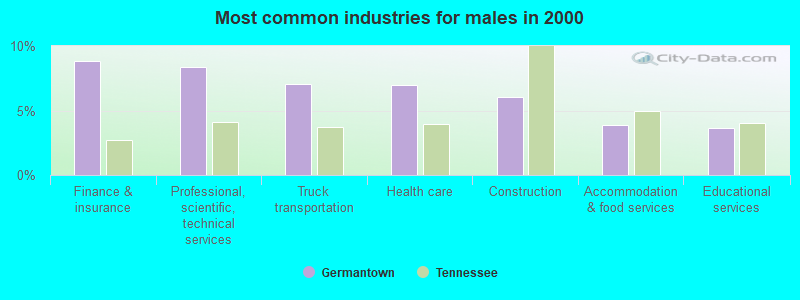
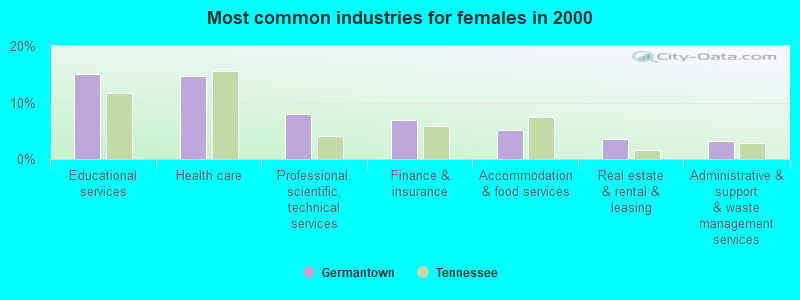
| Health care | 10.3% (1,949) | 7.0% (760) | 14.7% (1,189) |
| Educational services | 8.5% (1,610) | 3.7% (399) | 15.0% (1,211) |
| Professional, scientific, and technical services | 8.2% (1,559) | 8.4% (910) | 8.0% (649) |
| Finance and insurance | 8.0% (1,525) | 8.9% (963) | 7.0% (562) |
| Truck transportation | 5.4% (1,019) | 7.0% (765) | 3.1% (254) |
| Accommodation and food services | 4.4% (833) | 3.9% (423) | 5.1% (410) |
| Construction | 4.0% (762) | 6.0% (657) | 1.3% (105) |
| Real estate and rental and leasing | 3.1% (590) | 2.8% (305) | 3.5% (285) |
| Administrative and support and waste management services | 2.9% (545) | 2.6% (284) | 3.2% (261) |
| Air transportation | 2.6% (499) | 3.4% (367) | 1.6% (132) |
| Public administration | 2.6% (494) | 2.5% (269) | 2.8% (225) |
| Paper | 2.2% (409) | 2.1% (232) | 2.2% (177) |
| Religious, grantmaking, civic, professional, and similar organizations | 2.1% (397) | 1.7% (185) | 2.6% (212) |
| Other transportation, and support activities, and couriers | 2.0% (385) | 3.0% (324) | 0.8% (61) |
| Chemicals | 1.7% (323) | 2.2% (239) | 1.0% (84) |
| Arts, entertainment, and recreation | 1.6% (297) | 1.4% (150) | 1.8% (147) |
| Clothing and accessories, including shoe, stores | 1.5% (287) | 0.3% (34) | 3.1% (253) |
| Personal and laundry services | 1.4% (257) | 0.8% (87) | 2.1% (170) |
| Miscellaneous manufacturing | 1.3% (241) | 1.8% (201) | 0.5% (40) |
| Department and other general merchandise stores | 1.2% (234) | 0.7% (81) | 1.9% (153) |
| Publishing, and motion picture and sound recording industries | 1.2% (222) | 1.3% (144) | 1.0% (78) |
| Food and beverage stores | 1.0% (181) | 1.1% (117) | 0.8% (64) |
| Food | 0.9% (179) | 1.4% (148) | 0.4% (31) |
| Motor vehicle and parts dealers | 0.9% (178) | 1.5% (160) | 0.2% (18) |
| Broadcasting and telecommunications | 0.9% (178) | 1.1% (125) | 0.7% (53) |
| Radio, TV, and computer stores | 0.9% (178) | 1.3% (146) | 0.4% (32) |
| Social assistance | 0.9% (173) | 0.1% (10) | 2.0% (163) |
| Repair and maintenance | 0.8% (158) | 1.1% (121) | 0.5% (37) |
| Pharmacies and drug stores | 0.8% (150) | 0.6% (64) | 1.1% (86) |
| Groceries and related products merchant wholesalers | 0.8% (144) | 0.9% (102) | 0.5% (42) |
| Professional and commercial equipment and supplies merchant wholesalers | 0.7% (136) | 1.1% (122) | 0.2% (14) |
| Computer and electronic products | 0.7% (133) | 1.0% (107) | 0.3% (26) |
| Used merchandise, gift, novelty, and souvenir, and other miscellaneous stores | 0.7% (132) | 0.4% (41) | 1.1% (91) |
| Miscellaneous nondurable goods merchant wholesalers | 0.7% (125) | 0.7% (81) | 0.5% (44) |
| Drugs, sundries, and chemical and allied products merchant wholesalers | 0.6% (123) | 1.0% (113) | 0.1% (10) |
| Building material and garden equipment and supplies dealers | 0.6% (123) | 0.8% (92) | 0.4% (31) |
| Metal and metal products | 0.6% (117) | 0.7% (78) | 0.5% (39) |
| Electrical and electronic goods merchant wholesalers | 0.6% (111) | 0.8% (89) | 0.3% (22) |
| Furniture and home furnishings, and household appliance stores | 0.5% (102) | 0.3% (35) | 0.8% (67) |
| Electrical equipment, appliances, and components | 0.5% (95) | 0.6% (67) | 0.3% (28) |
| Other direct selling establishments | 0.5% (86) | 0.4% (47) | 0.5% (39) |
| Sporting goods, camera, and hobby and toy stores | 0.4% (82) | 0.7% (72) | 0.1% (10) |
| Farm product raw materials merchant wholesalers | 0.4% (82) | 0.6% (63) | 0.2% (19) |
| Data processing, libraries, and other information services | 0.4% (79) | 0.2% (22) | 0.7% (57) |
| Plastics and rubber products | 0.4% (73) | 0.5% (54) | 0.2% (19) |
| Utilities | 0.4% (71) | 0.5% (51) | 0.2% (20) |
| Warehousing and storage | 0.4% (71) | 0.6% (65) | 0.1% (6) |
| Machinery, equipment, and supplies merchant wholesalers | 0.4% (68) | 0.6% (61) | 0.1% (7) |
| Printing and related support activities | 0.4% (67) | 0.6% (62) | 0.1% (5) |
| Machinery | 0.4% (67) | 0.5% (52) | 0.2% (15) |
| Motor vehicles, parts and supplies merchant wholesalers | 0.3% (60) | 0.4% (44) | 0.2% (16) |
| Office supplies and stationery stores | 0.3% (58) | 0.5% (58) | 0.0% (0) |
| U. S. Postal service | 0.3% (57) | 0.5% (49) | 0.1% (8) |
| Beverage and tobacco products | 0.3% (54) | 0.4% (41) | 0.2% (13) |
| Lumber and other construction materials merchant wholesalers | 0.3% (52) | 0.3% (31) | 0.3% (21) |
| Transportation equipment | 0.3% (51) | 0.4% (46) | 0.1% (5) |
| Management of companies and enterprises | 0.3% (48) | 0.3% (32) | 0.2% (16) |
| Miscellaneous durable goods merchant wholesalers | 0.2% (44) | 0.3% (38) | 0.1% (6) |
| Electronic shopping and mail-order houses | 0.2% (43) | 0.3% (37) | 0.1% (6) |
| Health and personal care, except drug, stores | 0.2% (41) | 0.0% (0) | 0.5% (41) |
| Private households | 0.2% (40) | 0.0% (0) | 0.5% (40) |
| Textile mills and textile products | 0.2% (39) | 0.3% (34) | 0.1% (5) |
| Petroleum and petroleum products merchant wholesalers | 0.2% (36) | 0.3% (29) | 0.1% (7) |
| Rail transportation | 0.2% (32) | 0.3% (32) | 0.0% (0) |
| Agriculture, forestry, fishing and hunting | 0.2% (30) | 0.2% (22) | 0.1% (8) |
| Retail florists | 0.2% (29) | 0.1% (10) | 0.2% (19) |
| Paper and paper products merchant wholesalers | 0.2% (29) | 0.3% (29) | 0.0% (0) |
| Hardware, plumbing and heating equipment, and supplies merchant wholesalers | 0.2% (29) | 0.0% (5) | 0.3% (24) |
| Furniture and home furnishing merchant wholesalers | 0.1% (26) | 0.2% (17) | 0.1% (9) |
| Music stores | 0.1% (22) | 0.2% (22) | 0.0% (0) |
| Wood products | 0.1% (22) | 0.1% (16) | 0.1% (6) |
| Apparel, fabrics, and notions merchant wholesalers | 0.1% (22) | 0.1% (6) | 0.2% (16) |
| Jewelry, luggage, and leather goods stores | 0.1% (21) | 0.1% (9) | 0.1% (12) |
| Alcoholic beverages merchant wholesalers | 0.1% (21) | 0.2% (21) | 0.0% (0) |
| Gasoline stations | 0.1% (20) | 0.2% (20) | 0.0% (0) |
| Furniture and related product manufacturing | 0.1% (20) | 0.1% (14) | 0.1% (6) |
| Sewing, needlework, and piece goods stores | 0.1% (19) | 0.0% (0) | 0.2% (19) |
| Book stores and news dealers | 0.1% (19) | 0.1% (12) | 0.1% (7) |
| Nonmetallic mineral products | 0.1% (15) | 0.1% (15) | 0.0% (0) |
| Apparel | 0.1% (13) | 0.1% (13) | 0.0% (0) |
Unemployment in Germantown
- Unemployment by race in 2022
- Unemployment rate for White non-Hispanic residents
- 1.5%Males
- 3.4%Females
- Unemployment rate for two or more race residents
- 9.7%Males
- Unemployment rate for Hispanic or Latino residents
- 3.9%Males
- Unemployment by race in 2000
- Unemployment rate for White non-Hispanic residents
- 1.5%Males
- 2.0%Females
- Unemployment rate for Black residents
- 3.3%Males
- 5.7%Females
- Unemployment rate for Asian residents
- 10.9%Males
Unemployment in 2023:
| Germantown: | 2.7% |
| Tennessee: | 3.0% |
Unemployment in 2022:
| Germantown: | 3.1% |
| Tennessee: | 3.4% |
Unemployment in 2021:
| Germantown: | 2.9% |
| Tennessee: | 4.5% |
Unemployment in 2020:
| Germantown: | 4.4% |
| Tennessee: | 7.5% |
Unemployment in 2019:
| Germantown: | 2.6% |
| Tennessee: | 3.3% |
Unemployment in 2018:
| Germantown: | 2.7% |
| Tennessee: | 3.5% |
Unemployment in 2017:
| Germantown: | 2.9% |
| Tennessee: | 3.7% |
Unemployment in 2016:
| Germantown: | 3.7% |
| Tennessee: | 4.7% |
Unemployment in 2015:
| Germantown: | 4.3% |
| Tennessee: | 5.6% |
Unemployment in 2014:
| Germantown: | 5.0% |
| Tennessee: | 6.6% |
Unemployment in 2013:
| Germantown: | 5.8% |
| Tennessee: | 7.8% |
Unemployment in 2012:
| Germantown: | 5.5% |
| Tennessee: | 8.0% |
Unemployment in 2011:
| Germantown: | 6.1% |
| Tennessee: | 9.1% |
Unemployment in 2010:
| Germantown: | 6.3% |
| Tennessee: | 9.8% |
Unemployment in 2009:
| Germantown: | 6.3% |
| Tennessee: | 10.1% |
Unemployment in 2008:
| Germantown: | 4.4% |
| Tennessee: | 6.5% |
Unemployment in 2007:
| Germantown: | 3.2% |
| Tennessee: | 4.6% |
Unemployment in 2006:
| Germantown: | 3.7% |
| Tennessee: | 5.3% |
Unemployment in 2005:
| Germantown: | 3.9% |
| Tennessee: | 5.5% |
Unemployment in 2004:
| Germantown: | 1.7% |
| Tennessee: | 5.3% |
Unemployment in 2003:
| Germantown: | 1.7% |
| Tennessee: | 5.5% |
Unemployment in 2002:
| Germantown: | 1.5% |
| Tennessee: | 5.1% |
Unemployment in 2001:
| Germantown: | 1.2% |
| Tennessee: | 4.5% |
Unemployment in 2000:
| Germantown: | 1.1% |
| Tennessee: | 3.9% |
Unemployment in 1999:
| Germantown: | 1.1% |
| Tennessee: | 4.0% |
Unemployment in 1998:
| Germantown: | 1.2% |
| Tennessee: | 4.3% |
Unemployment in 1997:
| Germantown: | 1.4% |
| Tennessee: | 5.3% |
Unemployment in 1996:
| Germantown: | 1.4% |
| Tennessee: | 5.2% |
Unemployment in 1995:
| Germantown: | 1.5% |
| Tennessee: | 5.2% |
Unemployment in 1994:
| Germantown: | 1.4% |
| Tennessee: | 4.8% |
Unemployment in 1993:
| Germantown: | 1.7% |
| Tennessee: | 5.8% |
Unemployment in 1992:
| Germantown: | 1.8% |
| Tennessee: | 6.5% |
Unemployment in 1991:
| Germantown: | 1.7% |
| Tennessee: | 6.6% |
Unemployment in 1990:
| Germantown: | 1.4% |
| Tennessee: | 5.3% |
Time leaving home to go to work
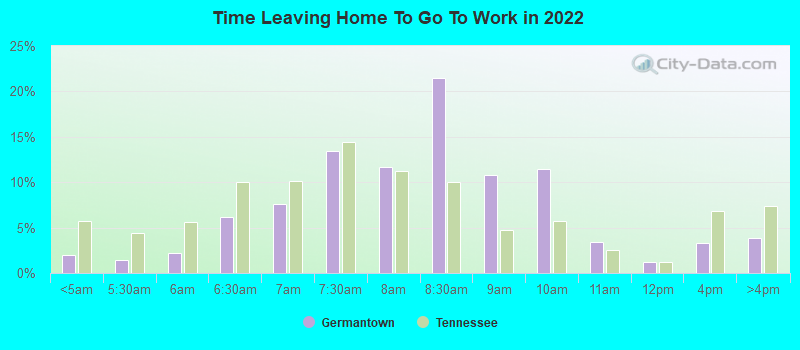
12:00 a.m. to 4:59 a.m.:
| Germantown: | 2.0% (305) |
| Tennessee: | 5.8% (168,022) |
5:00 a.m. to 5:29 a.m.:
| Germantown: | 1.4% (223) |
| Tennessee: | 4.5% (129,739) |
5:30 a.m. to 5:59 a.m.:
| Germantown: | 2.2% (344) |
| Tennessee: | 5.6% (162,304) |
6:00 a.m. to 6:29 a.m.:
| Germantown: | 6.2% (965) |
| Tennessee: | 10.0% (290,467) |
6:30 a.m. to 6:59 a.m.:
| Germantown: | 7.6% (1,174) |
| Tennessee: | 10.1% (295,472) |
7:00 a.m. to 7:29 a.m.:
| Germantown: | 13.5% (2,094) |
| Tennessee: | 14.4% (419,614) |
7:30 a.m. to 7:59 a.m.:
| Germantown: | 11.6% (1,810) |
| Tennessee: | 11.3% (327,876) |
8:00 a.m. to 8:29 a.m.:
| Germantown: | 21.5% (3,333) |
| Tennessee: | 10.1% (293,227) |
8:30 a.m. to 8:59 a.m.:
| Germantown: | 10.8% (1,674) |
| Tennessee: | 4.8% (138,580) |
9:00 a.m. to 9:59 a.m.:
| Germantown: | 11.5% (1,784) |
| Tennessee: | 5.7% (165,600) |
10:00 a.m. to 10:59 a.m.:
| Germantown: | 3.4% (527) |
| Tennessee: | 2.5% (73,770) |
11:00 a.m. to 11:59 a.m.:
| Germantown: | 1.2% (180) |
| Tennessee: | 1.2% (36,103) |
12:00 p.m. to 3:59 p.m.:
| Germantown: | 3.3% (505) |
| Tennessee: | 6.8% (197,821) |
4:00 p.m. to 11:59 p.m.:
| Germantown: | 3.8% (595) |
| Tennessee: | 7.4% (215,456) |

<5am:
| Germantown: | 1.5% (290) |
| Tennessee: | 3.6% (95,201) |
5:30am:
| Germantown: | 1.0% (187) |
| Tennessee: | 3.2% (85,054) |
6am:
| Germantown: | 1.8% (330) |
| Tennessee: | 5.0% (130,170) |
6:30am:
| Germantown: | 6.1% (1,142) |
| Tennessee: | 9.9% (258,202) |
7am:
| Germantown: | 9.5% (1,783) |
| Tennessee: | 12.1% (315,993) |
7:30am:
| Germantown: | 19.8% (3,702) |
| Tennessee: | 15.3% (400,482) |
8am:
| Germantown: | 18.0% (3,362) |
| Tennessee: | 14.7% (385,430) |
8:30am:
| Germantown: | 13.1% (2,447) |
| Tennessee: | 8.3% (217,000) |
9am:
| Germantown: | 5.6% (1,040) |
| Tennessee: | 3.6% (95,491) |
10am:
| Germantown: | 6.9% (1,291) |
| Tennessee: | 4.2% (109,641) |
11am:
| Germantown: | 2.6% (479) |
| Tennessee: | 1.7% (45,353) |
12pm:
| Germantown: | 0.6% (112) |
| Tennessee: | 0.8% (21,640) |
4pm:
| Germantown: | 3.8% (719) |
| Tennessee: | 7.3% (192,279) |
>4pm:
| Germantown: | 4.5% (834) |
| Tennessee: | 7.6% (198,970) |

12:00 a.m. to 4:59 a.m. - Males:
| Germantown: | 2.8% (238) |
| Tennessee: | 6.9% (108,520) |
5:00 a.m. to 5:29 a.m. - Males:
| Germantown: | 2.4% (209) |
| Tennessee: | 5.6% (87,671) |
5:30 a.m. to 5:59 a.m. - Males:
| Germantown: | 2.3% (203) |
| Tennessee: | 6.4% (100,890) |
6:00 a.m. to 6:29 a.m. - Males:
| Germantown: | 6.7% (576) |
| Tennessee: | 11.4% (179,873) |
6:30 a.m. to 6:59 a.m. - Males:
| Germantown: | 11.9% (1,031) |
| Tennessee: | 10.3% (161,655) |
7:00 a.m. to 7:29 a.m. - Males:
| Germantown: | 13.3% (1,151) |
| Tennessee: | 13.0% (204,436) |
7:30 a.m. to 7:59 a.m. - Males:
| Germantown: | 10.1% (872) |
| Tennessee: | 9.8% (153,357) |
8:00 a.m. to 8:29 a.m. - Males:
| Germantown: | 17.4% (1,504) |
| Tennessee: | 8.9% (140,283) |
8:30 a.m. to 8:59 a.m. - Males:
| Germantown: | 6.9% (594) |
| Tennessee: | 4.1% (65,033) |
9:00 a.m. to 9:59 a.m. - Males:
| Germantown: | 12.5% (1,082) |
| Tennessee: | 5.3% (82,870) |
10:00 a.m. to 10:59 a.m. - Males:
| Germantown: | 4.1% (357) |
| Tennessee: | 2.1% (33,374) |
11:00 a.m. to 11:59 a.m. - Males:
| Germantown: | 1.0% (82) |
| Tennessee: | 1.2% (18,699) |
12:00 p.m. to 3:59 p.m. - Males:
| Germantown: | 3.2% (280) |
| Tennessee: | 7.0% (109,280) |
4:00 p.m. to 11:59 p.m. - Males:
| Germantown: | 3.7% (321) |
| Tennessee: | 8.0% (125,064) |

12:00 a.m. to 4:59 a.m. - Females:
| Germantown: | 1.0% (72) |
| Tennessee: | 4.4% (59,502) |
5:00 a.m. to 5:29 a.m. - Females:
| Germantown: | 0.4% (30) |
| Tennessee: | 3.1% (42,068) |
5:30 a.m. to 5:59 a.m. - Females:
| Germantown: | 2.0% (141) |
| Tennessee: | 4.6% (61,414) |
6:00 a.m. to 6:29 a.m. - Females:
| Germantown: | 5.5% (382) |
| Tennessee: | 8.2% (110,594) |
6:30 a.m. to 6:59 a.m. - Females:
| Germantown: | 2.7% (186) |
| Tennessee: | 10.0% (133,817) |
7:00 a.m. to 7:29 a.m. - Females:
| Germantown: | 13.7% (943) |
| Tennessee: | 16.0% (215,178) |
7:30 a.m. to 7:59 a.m. - Females:
| Germantown: | 13.5% (929) |
| Tennessee: | 13.0% (174,519) |
8:00 a.m. to 8:29 a.m. - Females:
| Germantown: | 25.7% (1,767) |
| Tennessee: | 11.4% (152,944) |
8:30 a.m. to 8:59 a.m. - Females:
| Germantown: | 16.1% (1,108) |
| Tennessee: | 5.5% (73,547) |
9:00 a.m. to 9:59 a.m. - Females:
| Germantown: | 10.5% (724) |
| Tennessee: | 6.2% (82,730) |
10:00 a.m. to 10:59 a.m. - Females:
| Germantown: | 2.8% (193) |
| Tennessee: | 3.0% (40,396) |
11:00 a.m. to 11:59 a.m. - Females:
| Germantown: | 1.4% (98) |
| Tennessee: | 1.3% (17,404) |
12:00 p.m. to 3:59 p.m. - Females:
| Germantown: | 2.9% (203) |
| Tennessee: | 6.6% (88,541) |
4:00 p.m. to 11:59 p.m. - Females:
| Germantown: | 4.0% (274) |
| Tennessee: | 6.7% (90,392) |
Travel time to work
Percentage of workers working in this county: 96.7%
Number of people working at home: 2,730 (14.3% of all workers)
Daytime population change due to commuting: -6,246 (-16.7%)
Workers who live and work in this city: 3,569 (19.1%)
Number of people working at home: 2,730 (14.3% of all workers)
Daytime population change due to commuting: -6,246 (-16.7%)
Workers who live and work in this city: 3,569 (19.1%)

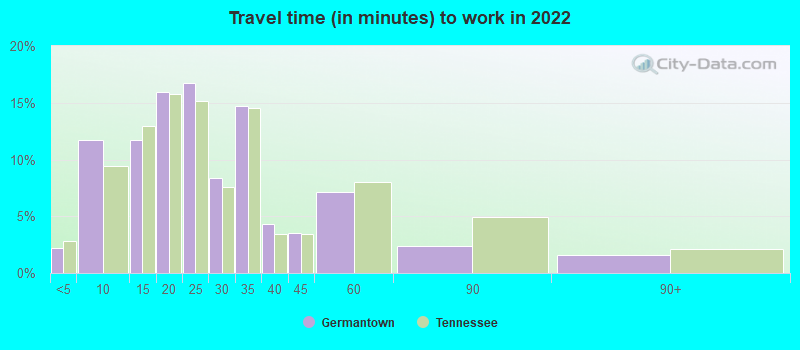

Less than 5 minutes:
| Germantown: | 2.2% (393) |
| Tennessee: | 2.8% (82,584) |
5 to 9 minutes:
| Germantown: | 11.7% (2,045) |
| Tennessee: | 9.4% (278,912) |
10 to 14 minutes:
| Germantown: | 11.8% (2,055) |
| Tennessee: | 13.0% (384,769) |
15 to 19 minutes:
| Germantown: | 16.0% (2,794) |
| Tennessee: | 15.7% (466,908) |
20 to 24 minutes:
| Germantown: | 16.8% (2,932) |
| Tennessee: | 15.2% (450,558) |
25 to 29 minutes:
| Germantown: | 8.4% (1,466) |
| Tennessee: | 7.6% (224,112) |
30 to 34 minutes:
| Germantown: | 14.7% (2,576) |
| Tennessee: | 14.5% (430,603) |
35 to 39 minutes:
| Germantown: | 4.3% (758) |
| Tennessee: | 3.4% (100,676) |
40 to 44 minutes:
| Germantown: | 3.5% (610) |
| Tennessee: | 3.4% (102,029) |
45 to 59 minutes:
| Germantown: | 7.1% (1,249) |
| Tennessee: | 8.0% (237,317) |
60 to 89 minutes:
| Germantown: | 2.4% (413) |
| Tennessee: | 4.9% (146,710) |
90 or more minutes:
| Germantown: | 1.6% (274) |
| Tennessee: | 2.1% (61,570) |


Less than 5 minutes:
| Germantown: | 2.0% (381) |
| Tennessee: | 2.8% (73,643) |
5 to 9 minutes:
| Germantown: | 8.0% (1,495) |
| Tennessee: | 9.9% (258,796) |
10 to 14 minutes:
| Germantown: | 14.7% (2,756) |
| Tennessee: | 14.6% (382,474) |
15 to 19 minutes:
| Germantown: | 15.0% (2,800) |
| Tennessee: | 16.9% (441,464) |
20 to 24 minutes:
| Germantown: | 20.5% (3,835) |
| Tennessee: | 15.6% (409,099) |
25 to 29 minutes:
| Germantown: | 7.7% (1,446) |
| Tennessee: | 6.0% (158,281) |
30 to 34 minutes:
| Germantown: | 16.0% (2,994) |
| Tennessee: | 14.1% (370,428) |
35 to 39 minutes:
| Germantown: | 2.4% (457) |
| Tennessee: | 2.4% (63,838) |
40 to 44 minutes:
| Germantown: | 2.3% (433) |
| Tennessee: | 2.7% (70,195) |
45 to 59 minutes:
| Germantown: | 3.1% (571) |
| Tennessee: | 6.7% (174,982) |
60 to 89 minutes:
| Germantown: | 1.6% (293) |
| Tennessee: | 3.5% (92,042) |
90 or more minutes:
| Germantown: | 1.4% (257) |
| Tennessee: | 2.1% (55,664) |

Less than 5 minutes - Males:
| Germantown: | 4.7% (319) |
| Tennessee: | 2.7% (43,057) |
5 to 9 minutes - Males:
| Germantown: | 13.4% (919) |
| Tennessee: | 8.5% (135,629) |
10 to 14 minutes - Males:
| Germantown: | 13.3% (906) |
| Tennessee: | 12.1% (193,951) |
15 to 19 minutes - Males:
| Germantown: | 14.2% (969) |
| Tennessee: | 15.0% (240,259) |
20 to 24 minutes - Males:
| Germantown: | 15.2% (1,037) |
| Tennessee: | 14.9% (237,548) |
25 to 29 minutes - Males:
| Germantown: | 10.9% (747) |
| Tennessee: | 7.6% (121,347) |
30 to 34 minutes - Males:
| Germantown: | 13.1% (899) |
| Tennessee: | 15.0% (239,352) |
35 to 39 minutes - Males:
| Germantown: | 3.6% (249) |
| Tennessee: | 3.5% (55,964) |
40 to 44 minutes - Males:
| Germantown: | 3.5% (240) |
| Tennessee: | 3.8% (61,478) |
45 to 59 minutes - Males:
| Germantown: | 6.7% (460) |
| Tennessee: | 8.6% (137,988) |
60 to 89 minutes - Males:
| Germantown: | 2.1% (143) |
| Tennessee: | 5.7% (91,540) |
90 or more minutes - Males:
| Germantown: | 1.5% (103) |
| Tennessee: | 2.5% (40,675) |

Less than 5 minutes - Females:
| Germantown: | 0.9% (96) |
| Tennessee: | 2.9% (39,527) |
5 to 9 minutes - Females:
| Germantown: | 10.6% (1,128) |
| Tennessee: | 10.5% (143,283) |
10 to 14 minutes - Females:
| Germantown: | 10.5% (1,116) |
| Tennessee: | 13.9% (190,818) |
15 to 19 minutes - Females:
| Germantown: | 17.5% (1,862) |
| Tennessee: | 16.6% (226,649) |
20 to 24 minutes - Females:
| Germantown: | 18.4% (1,959) |
| Tennessee: | 15.6% (213,010) |
25 to 29 minutes - Females:
| Germantown: | 6.5% (698) |
| Tennessee: | 7.5% (102,765) |
30 to 34 minutes - Females:
| Germantown: | 15.5% (1,654) |
| Tennessee: | 14.0% (191,251) |
35 to 39 minutes - Females:
| Germantown: | 4.5% (481) |
| Tennessee: | 3.3% (44,712) |
40 to 44 minutes - Females:
| Germantown: | 3.6% (385) |
| Tennessee: | 3.0% (40,551) |
45 to 59 minutes - Females:
| Germantown: | 7.8% (829) |
| Tennessee: | 7.3% (99,329) |
60 to 89 minutes - Females:
| Germantown: | 2.3% (250) |
| Tennessee: | 4.0% (55,170) |
90 or more minutes - Females:
| Germantown: | 1.7% (182) |
| Tennessee: | 1.5% (20,895) |
Means of transportation to work
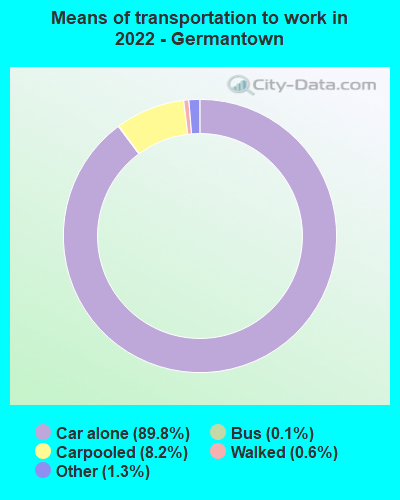
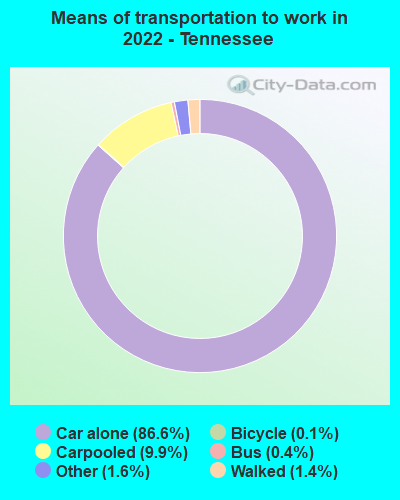
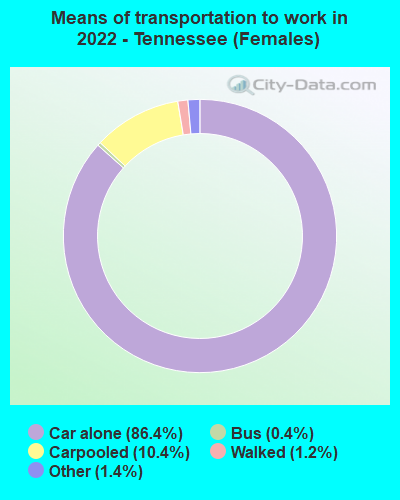
Drove car alone:
| Germantown: | 89.8% (16,361) |
| Tennessee: | 86.6% (1,182,254) |
Carpooled:
| Germantown: | 8.2% (1,502) |
| Tennessee: | 9.9% (142,525) |
Bus:
| Germantown: | 0.1% (25) |
| Tennessee: | 0.4% (6,120) |
Bicycle:
| Germantown: | 0.0% (7) |
| Tennessee: | 0.1% (1,148) |
Walked:
| Germantown: | 0.6% (101) |
| Tennessee: | 1.4% (16,729) |
Other means:
| Germantown: | 1.3% (228) |
| Tennessee: | 1.6% (18,549) |

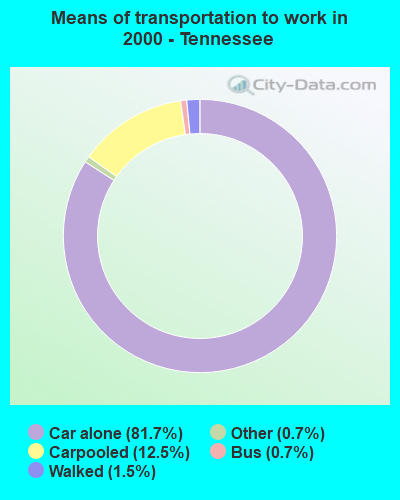
Drove car alone:
| Germantown: | 87.9% (16,458) |
| Tennessee: | 81.7% (2,140,377) |
Carpooled:
| Germantown: | 5.5% (1,022) |
| Tennessee: | 12.5% (328,321) |
Subway or elevated:
| Germantown: | 0.0% (6) |
| Tennessee: | 0.0% (205) |
Motorcycle:
| Germantown: | 0.1% (15) |
| Tennessee: | 0.1% (1,713) |
Walked:
| Germantown: | 0.4% (74) |
| Tennessee: | 1.5% (39,689) |
Other means:
| Germantown: | 0.8% (143) |
| Tennessee: | 0.7% (17,308) |


Drove car alone - Males:
| Germantown: | 90.2% (6,373) |
| Tennessee: | 86.8% (1,182,254) |
Carpooled - Males:
| Germantown: | 8.0% (562) |
| Tennessee: | 9.4% (142,525) |
Bicycle - Males:
| Germantown: | 0.1% (7) |
| Tennessee: | 0.2% (1,148) |
Walked - Males:
| Germantown: | 1.0% (74) |
| Tennessee: | 1.5% (16,729) |
Other means - Males:
| Germantown: | 0.7% (49) |
| Tennessee: | 1.7% (18,549) |

Drove car alone - Females:
| Germantown: | 89.5% (10,048) |
| Tennessee: | 86.4% (1,182,254) |
Carpooled - Females:
| Germantown: | 8.4% (946) |
| Tennessee: | 10.4% (142,525) |
Bus - Females:
| Germantown: | 0.2% (26) |
| Tennessee: | 0.4% (6,120) |
Walked - Females:
| Germantown: | 0.2% (27) |
| Tennessee: | 1.2% (16,729) |
Other means - Females:
| Germantown: | 1.6% (181) |
| Tennessee: | 1.4% (18,549) |
Private vehicle occupancy

Drove alone:
| Germantown: | 91.4% (13,892) |
| Tennessee: | 89.7% (2,520,406) |
In 2 person carpool:
| Germantown: | 6.3% (964) |
| Tennessee: | 7.8% (220,446) |
In 3 person carpool:
| Germantown: | 1.8% (274) |
| Tennessee: | 1.7% (48,323) |
In 4 person carpool:
| Germantown: | 0.2% (34) |
| Tennessee: | 0.5% (12,986) |

Drove alone:
| Germantown: | 94.2% (16,458) |
| Tennessee: | 86.7% (2,140,377) |
In 2 person carpool:
| Germantown: | 5.1% (885) |
| Tennessee: | 10.4% (257,957) |
In 3 person carpool:
| Germantown: | 0.7% (127) |
| Tennessee: | 1.8% (44,143) |
In 4 person carpool:
| Germantown: | 0.1% (10) |
| Tennessee: | 0.6% (14,756) |
Class of workers
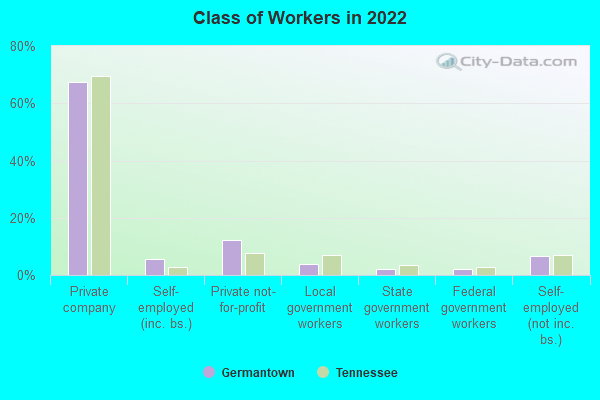
Employee of private company:
| Germantown: | 67.4% (12,965) |
| Tennessee: | 69.4% (2,369,609) |
Self-employed in own incorporated business:
| Germantown: | 5.5% (1,063) |
| Tennessee: | 2.7% (91,783) |
Private not-for-profit wage and salary workers:
| Germantown: | 12.2% (2,354) |
| Tennessee: | 7.7% (261,180) |
Local government workers:
| Germantown: | 3.9% (749) |
| Tennessee: | 6.9% (234,837) |
State government workers:
| Germantown: | 2.1% (402) |
| Tennessee: | 3.5% (118,092) |
Federal government workers:
| Germantown: | 2.3% (438) |
| Tennessee: | 2.7% (93,298) |
Self-employed workers in own not incorporated business:
| Germantown: | 6.5% (1,248) |
| Tennessee: | 7.0% (239,148) |
Unpaid family workers:
| Germantown: | 0.1% (27) |
| Tennessee: | 0.2% (5,513) |

Employee of private company:
| Germantown: | 67.4% (12,768) |
| Tennessee: | 70.0% (1,855,123) |
Self-employed in own incorporated business:
| Germantown: | 6.6% (1,249) |
| Tennessee: | 2.3% (60,116) |
Private not-for-profit wage and salary workers:
| Germantown: | 8.0% (1,520) |
| Tennessee: | 6.2% (164,441) |
Local government workers:
| Germantown: | 5.5% (1,038) |
| Tennessee: | 7.1% (189,357) |
State government workers:
| Germantown: | 2.5% (477) |
| Tennessee: | 4.0% (107,075) |
Federal government workers:
| Germantown: | 2.1% (406) |
| Tennessee: | 2.7% (72,605) |
Self-employed workers in own not incorporated business:
| Germantown: | 7.6% (1,444) |
| Tennessee: | 7.3% (194,497) |
Unpaid family workers:
| Germantown: | 0.3% (52) |
| Tennessee: | 0.3% (8,424) |

Employee of private company - Males:
| Germantown: | 70.4% (7,663) |
| Tennessee: | 72.1% (1,295,850) |
Self-employed in own incorporated business - Males:
| Germantown: | 9.1% (985) |
| Tennessee: | 3.6% (64,468) |
Private not-for-profit wage and salary workers - Males:
| Germantown: | 6.8% (741) |
| Tennessee: | 4.9% (88,366) |
Local government workers - Males:
| Germantown: | 2.4% (261) |
| Tennessee: | 5.0% (90,602) |
State government workers - Males:
| Germantown: | 1.7% (182) |
| Tennessee: | 2.8% (50,575) |
Federal government workers - Males:
| Germantown: | 1.8% (198) |
| Tennessee: | 3.0% (54,450) |
Self-employed workers in own not incorporated business - Males:
| Germantown: | 7.8% (853) |
| Tennessee: | 8.3% (149,461) |

Employee of private company - Females:
| Germantown: | 63.4% (5,302) |
| Tennessee: | 66.4% (1,073,759) |
Self-employed in own incorporated business - Females:
| Germantown: | 0.9% (78) |
| Tennessee: | 1.7% (27,315) |
Private not-for-profit wage and salary workers - Females:
| Germantown: | 19.3% (1,613) |
| Tennessee: | 10.7% (172,814) |
Local government workers - Females:
| Germantown: | 5.8% (488) |
| Tennessee: | 8.9% (144,235) |
State government workers - Females:
| Germantown: | 2.6% (220) |
| Tennessee: | 4.2% (67,517) |
Federal government workers - Females:
| Germantown: | 2.9% (240) |
| Tennessee: | 2.4% (38,848) |
Self-employed workers in own not incorporated business - Females:
| Germantown: | 4.7% (395) |
| Tennessee: | 5.5% (89,687) |
Unpaid family workers - Females:
| Germantown: | 0.3% (27) |
| Tennessee: | 0.2% (3,066) |