Wind Lake: Fire Incidents, Wisconsin (WI)
Where are fire incidents reported in Wind Lake, WI
Something went wrong! Please refresh the page.
|
| |||||||||||||||||||||||||||||||||||||||||||||||||||||||||||||||||||||||||||||||||||||||||||||||||||||||||||||
2004 - 2018 National Fire Incident Reporting System (NFIRS) incidents
- Incident types reported to NFIRS in Wind Lake, WI
- 20941.4%Fire
- 9318.4%Rescue & EMS
- 9218.2%Hazardous Condition
- 5210.3%Good Intent Call
- 5110.1%False Alarm
- 71.4%Service Call
- 10.2%Special Incident
- Fire incident types reported to NFIRS in Wind Lake, WI
- 12358.9%Structure Fires
- 5526.3%Outside Fires
- 188.6%Mobile Property/Vehicle Fires
- 136.2%Other
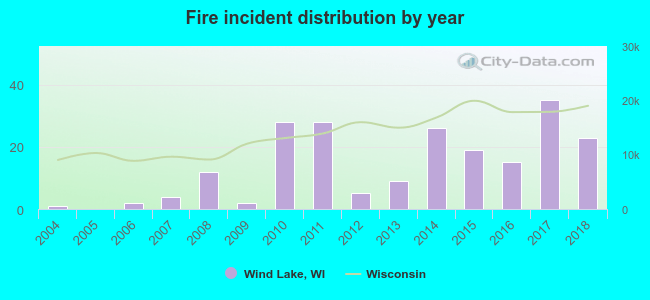 Based on the data from the years 2004 - 2018 the average number of fires per year is 14. The highest number of fire incidents - 35 took place in 2017, and the least - 0 in 2005. The data has a rising trend.
The average number of yearly fire incidents per 10k residents in Wind Lake, WI compared to nearest cities:
(Note: Based on data for the last 3 years, including only cities with population 5,000 and above)
| Wind Lake: | 45.6 |
| Tichigan: | 6.8 |
| Waterford: | 79.1 |
| Muskego: | 17.2 |
| Vernon: | 42.1 |
| Mukwonago: | 61.4 |
| Franklin: | 22.7 |
| Hales Corners: | 25.4 |
| New Berlin: | 28.9 |

 According to the data from the years 2004 - 2018 the average number of fire-related yearly casualties is 1. The highest number of reported casualties - 6 took place in 2011, and the lowest - 0 in 2004. The data has a rising trend.
 27.3% incidents where reported in the morning and 72.7% in the evening. The most fires (30.6%) took place on Sunday, and the least (9.6%) on Tuesday.
 According to the 209 fires from years 2004 - 2018 most fires (14.4%) took place during February, and the least (5.3%) in May.
 Out of all 505 cases reported during the years 2004 - 2018, the most belonged to the categories: Fire (41.4%), Overpressure Rupture (18.4%), and Rescue & EMS (18.2%).
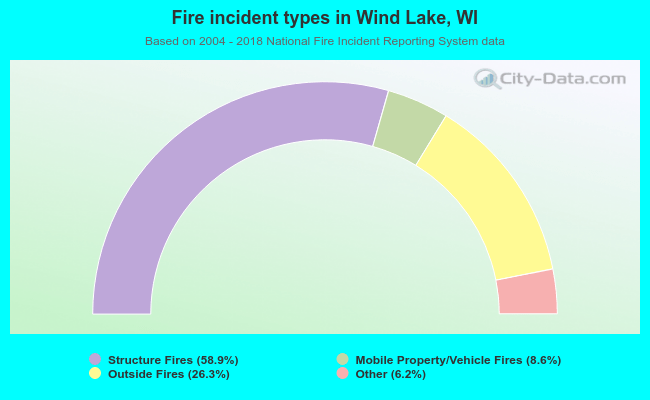 When looking into fire subcategories, the most incidents belonged to: Structure Fires (58.9%), and Outside Fires (26.3%).