Waterford: Fire Incidents, Wisconsin (WI)
Where are fire incidents reported in Waterford, WI
Something went wrong! Please refresh the page.
|
| |||||||||||||||||||||||||||||||||||||||||||||||||||||||||||||||||||||||||||||||||||||||||||||||||||||||||||||
2005 - 2018 National Fire Incident Reporting System (NFIRS) incidents
- Incident types reported to NFIRS in Waterford, WI
- 66339.7%Rescue & EMS
- 44826.8%Fire
- 17710.6%False Alarm
- 16910.1%Good Intent Call
- 1659.9%Hazardous Condition
- 432.6%Service Call
- 30.2%Special Incident
- 20.1%Overpressure Rupture
- 20.1%Severe Weather
- Fire incident types reported to NFIRS in Waterford, WI
- 27661.6%Structure Fires
- 11124.8%Outside Fires
- 316.9%Mobile Property/Vehicle Fires
- 306.7%Other
 Based on the data from the years 2005 - 2018 the average number of fire incidents per year is 32. The highest number of reported fires - 82 took place in 2015, and the least - 2 in 2005. The data has a rising trend.
The average number of yearly fire incidents per 10k residents in Waterford, WI compared to nearest cities:
(Note: Based on data for the last 3 years, including only cities with population 5,000 and above)
| Waterford: | 79.1 |
| Tichigan: | 6.8 |
| Wind Lake: | 45.6 |
| Burlington: | 117.3 |
| Vernon: | 42.1 |
| Mukwonago: | 61.4 |
| Muskego: | 17.2 |
| Franklin: | 22.7 |
| Hales Corners: | 25.4 |

 38.8% incidents where reported in the morning and 61.2% in the evening. The most fires (19.2%) took place on Sunday, and the least (9.6%) on Tuesday.
 Based on the 448 fire incidents from years 2005 - 2018 most fires (14.7%) took place during January, and the least (5.1%) in August.
 Out of all 1,672 cases reported during the years 2005 - 2018, the most belonged to the categories: Rescue & EMS (39.7%), Fire (26.8%), and False Alarm (10.6%).
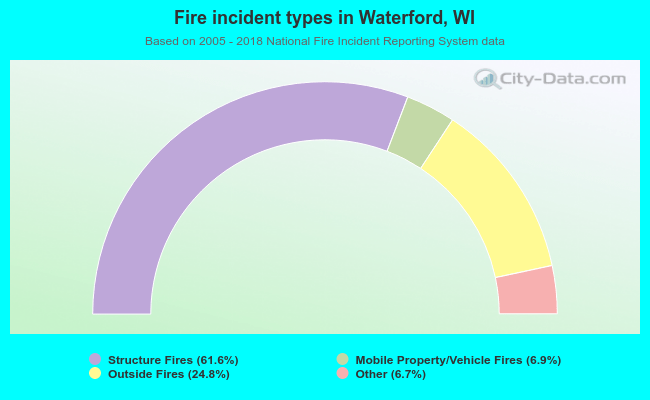 When looking into fire subcategories, the most incidents belonged to: Structure Fires (61.6%), and Outside Fires (24.8%).