Vernon: Fire Incidents, Wisconsin (WI)
Where are fire incidents reported in Vernon, WI
Something went wrong! Please refresh the page.
|
| |||||||||||||||||||||||||||||||||||||||||||||||||||||||||||||||||||||||||||||||||||||||||||||||||||||||||||||
2004 - 2018 National Fire Incident Reporting System (NFIRS) incidents
- Incident types reported to NFIRS in Vernon, WI
- 50047.3%Rescue & EMS
- 22621.4%Fire
- 11010.4%Service Call
- 918.6%Hazardous Condition
- 747.0%Good Intent Call
- 484.5%False Alarm
- 40.4%Severe Weather
- 20.2%Special Incident
- Fire incident types reported to NFIRS in Vernon, WI
- 12053.1%Structure Fires
- 7031.0%Outside Fires
- 2711.9%Mobile Property/Vehicle Fires
- 94.0%Other
 Based on the data from the years 2004 - 2018 the average number of fire incidents per year is 15. The highest number of reported fire incidents - 40 took place in 2013, and the least - 1 in 2005. The data has an increasing trend.
The average number of yearly fire incidents per 10k residents in Vernon, WI compared to nearest cities:
(Note: Based on data for the last 3 years, including only cities with population 5,000 and above)
| Vernon: | 42.1 |
| Mukwonago: | 61.4 |
| Tichigan: | 6.8 |
| Muskego: | 17.2 |
| Wind Lake: | 45.6 |
| Waukesha: | 23.6 |
| Genesee: | 1.8 |
| Waterford: | 79.1 |
| New Berlin: | 28.9 |

 28.8% incidents where reported in the morning and 71.2% in the evening. The most fires (22.6%) took place on Saturday, and the least (11.5%) on Monday.
 Based on the 226 fires from years 2004 - 2018 most fires (13.3%) took place during June, and the least (4.4%) in January.
 Out of all 1,056 cases reported during the years 2004 - 2018, the most belonged to the categories: Rescue & EMS (47.3%), Fire (21.4%), and Service Call (10.4%).
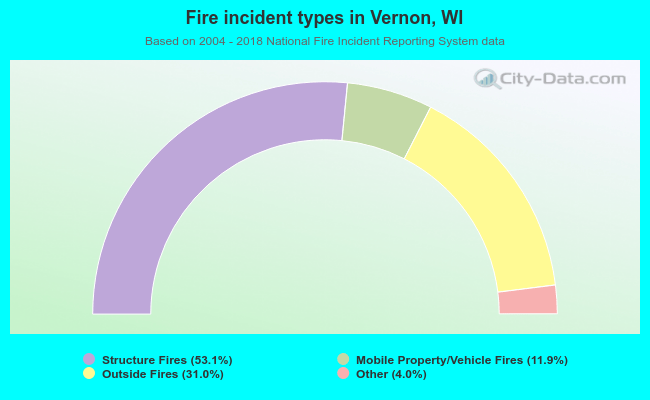 When looking into fire subcategories, the most incidents belonged to: Structure Fires (53.1%), and Outside Fires (31.0%).