South Weber: Fire Incidents, Utah (UT)
Where are fire incidents reported in South Weber, UT
Something went wrong! Please refresh the page.
|
| |||||||||||||||||||||||||||||||||||||||||||||||||||||||||||||||||||||||||||||||||||||||||||||||||||||||||||||
2002 - 2018 National Fire Incident Reporting System (NFIRS) incidents
- Incident types reported to NFIRS in South Weber, UT
- 75961.3%Rescue & EMS
- 17714.3%Fire
- 1108.9%Good Intent Call
- 1108.9%False Alarm
- 504.0%Hazardous Condition
- 292.3%Service Call
- 20.2%Severe Weather
- Fire incident types reported to NFIRS in South Weber, UT
- 10760.5%Outside Fires
- 5430.5%Structure Fires
- 158.5%Mobile Property/Vehicle Fires
- 10.6%Other
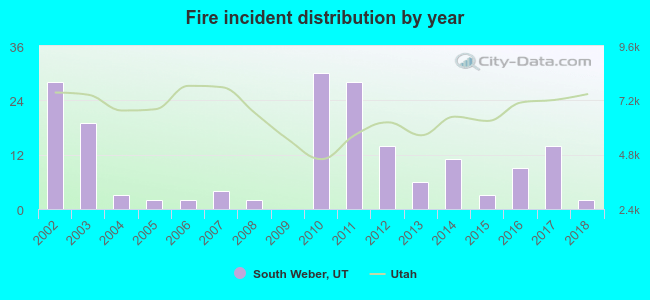 Based on the data from the years 2002 - 2018 the average number of fires per year is 10. The highest number of reported fire incidents - 30 took place in 2010, and the least - 0 in 2009. The data has a decreasing trend.
The average number of yearly fire incidents per 10k residents in South Weber, UT compared to nearest cities:
(Note: Based on data for the last 3 years, including only cities with population 5,000 and above)
| South Weber: | 12.4 |
| South Ogden: | 21.4 |
| Washington Terrace: | 1.1 |
| Layton: | 18.6 |
| Riverdale: | 33.0 |
| Clearfield: | 29.2 |
| Sunset: | 30.4 |
| Clinton: | 20.5 |
| Roy: | 20.1 |
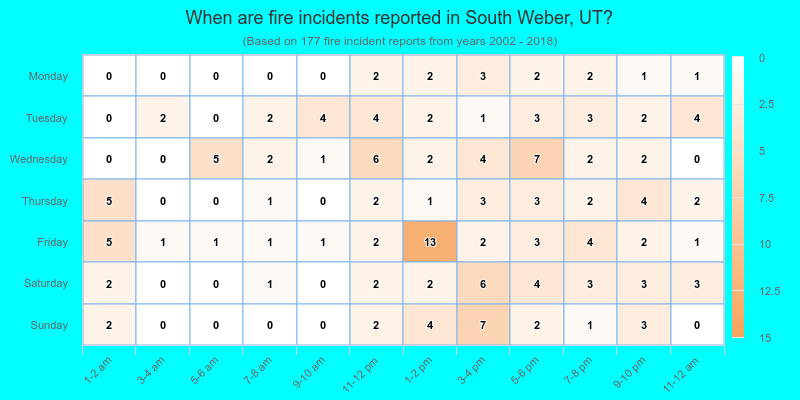
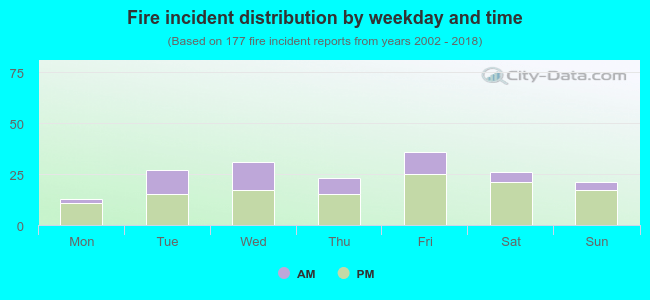 31.6% incidents where reported in the morning and 68.4% in the evening. The most fires (20.3%) took place on Friday, and the least (7.3%) on Monday.
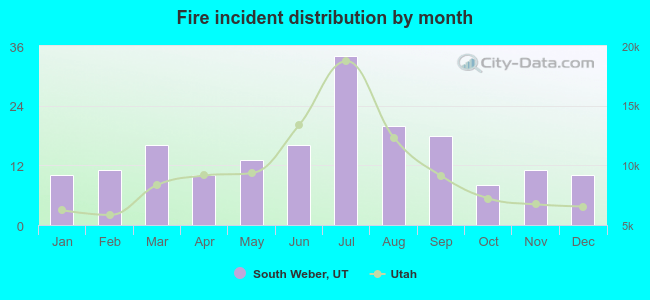 Based on the 177 incident reports from years 2002 - 2018 most fires (19.2%) took place during July, and the least (4.5%) in October.
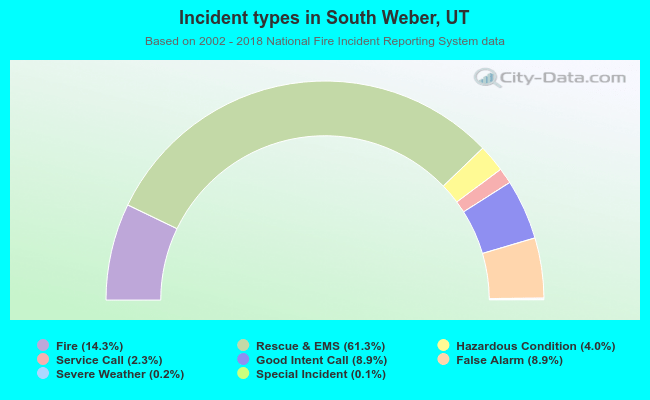 Out of all 1,238 cases reported during the years 2002 - 2018, the most belonged to the categories: Overpressure Rupture (61.3%), Fire (14.3%), and Service Call (8.9%).
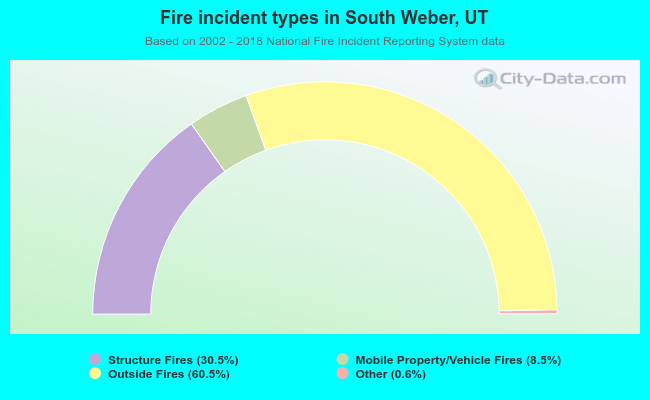 When looking into fire subcategories, the most reports belonged to: Outside Fires (60.5%), and Structure Fires (30.5%).