Clinton: Fire Incidents, Utah (UT)
Where are fire incidents reported in Clinton, UT
Something went wrong! Please refresh the page.
|
| |||||||||||||||||||||||||||||||||||||||||||||||||||||||||||||||||||||||||||||||||||||||||||||||||||||||||||||
2003 - 2018 National Fire Incident Reporting System (NFIRS) incidents
- Incident types reported to NFIRS in Clinton, UT
- 2,81258.8%Rescue & EMS
- 58412.2%Good Intent Call
- 3988.3%Fire
- 3938.2%Service Call
- 3367.0%False Alarm
- 2595.4%Hazardous Condition
- Fire incident types reported to NFIRS in Clinton, UT
- 24160.6%Structure Fires
- 8822.1%Outside Fires
- 379.3%Mobile Property/Vehicle Fires
- 328.0%Other
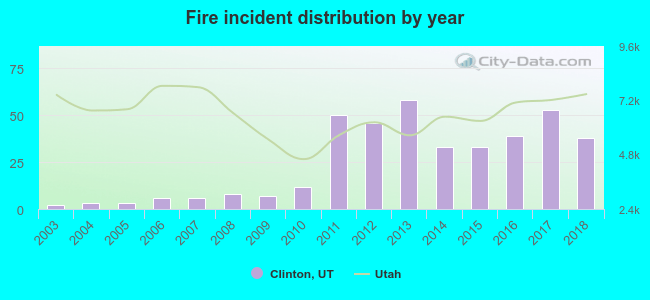 According to the data from the years 2003 - 2018 the average number of fires per year is 25. The highest number of fires - 58 took place in 2013, and the least - 2 in 2003. The data has an increasing trend.
The average number of yearly fire incidents per 10k residents in Clinton, UT compared to nearest cities:
(Note: Based on data for the last 3 years, including only cities with population 5,000 and above)
| Clinton: | 20.5 |
| Sunset: | 30.4 |
| Roy: | 20.1 |
| West Point: | 23.8 |
| Clearfield: | 29.2 |
| Riverdale: | 33.0 |
| Syracuse: | 10.4 |
| Hooper: | 23.0 |
| West Haven: | 40.6 |
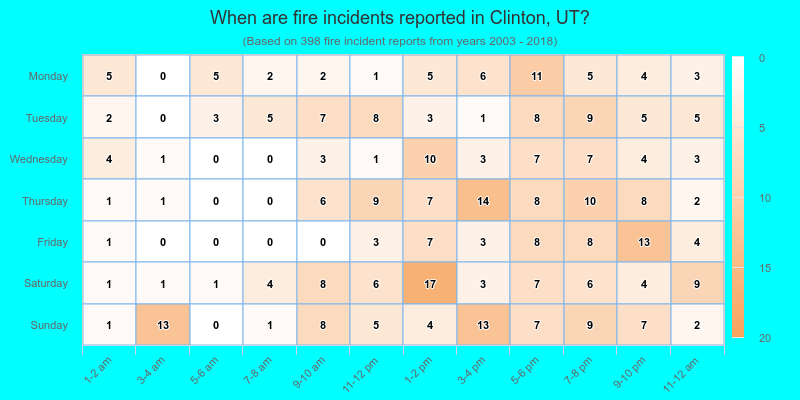
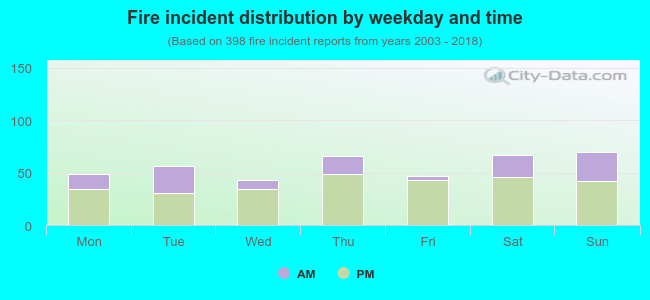 29.9% incidents where reported in the morning and 70.1% in the evening. The most fires (17.6%) took place on Sunday, and the least (10.8%) on Wednesday.
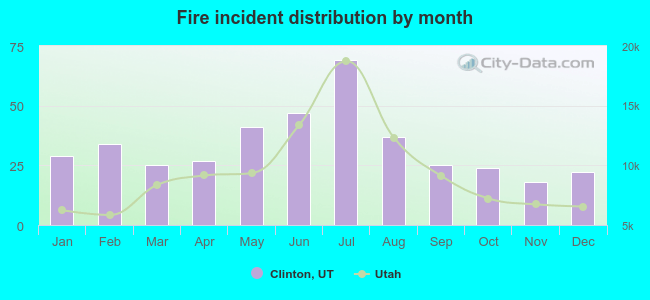 Based on the 398 incident reports from years 2003 - 2018 most fires (17.3%) took place during July, and the least (4.5%) in November.
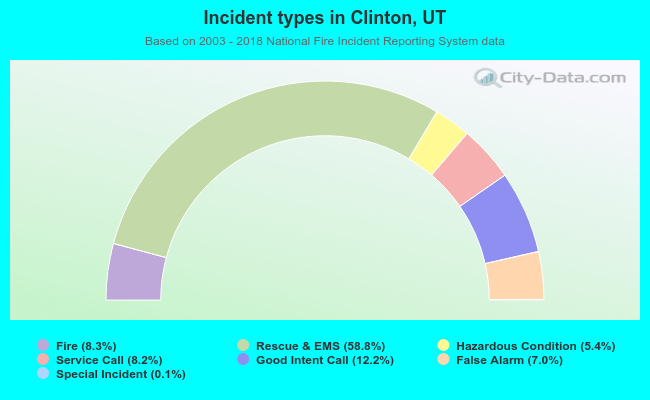 Out of all 4,785 cases reported during the years 2003 - 2018, the most belonged to the categories: Overpressure Rupture (58.8%), Service Call (12.2%), and Fire (8.3%).
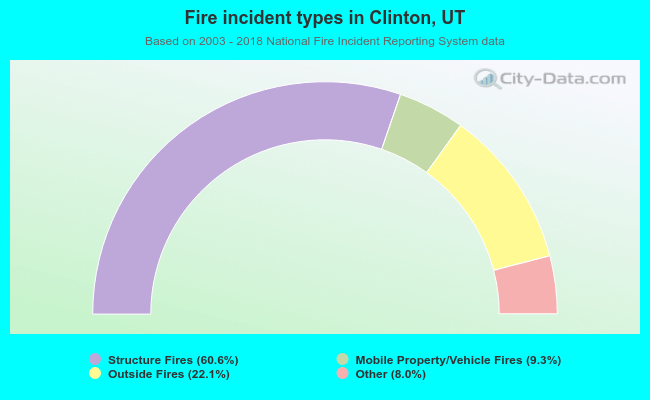 When looking into fire subcategories, the most reports belonged to: Structure Fires (60.6%), and Outside Fires (22.1%).