Roy: Fire Incidents, Utah (UT)
Where are fire incidents reported in Roy, UT
Something went wrong! Please refresh the page.
| Fire incidents reported | |
|---|---|
| Sreet name | Count |
| 1900 | 216 |
| 4800 | 96 |
| 5600 | 76 |
| MIDLAND DR | 54 |
| I-15 FWY | 52 |
| 2675 | 44 |
| 1900 W | 42 |
| 2700 | 42 |
| 4300 | 42 |
| 5200 | 42 |
| 6000 | 42 |
| 3100 | 38 |
| 4000 | 38 |
| 3500 | 36 |
| 4650 | 34 |
| 5700 | 34 |
| 2200 | 26 |
| RIVERDALE RD | 26 |
| 1800 | 24 |
| 2025 | 24 |
| 2050 | 24 |
| 2550 | 24 |
| 2900 | 24 |
| 4900 | 24 |
| 1900 W | 22 |
| 2275 | 22 |
| 2350 | 22 |
| 2500 | 22 |
| 3375 | 22 |
| 5500 | 22 |
| Other | 497 |
2002 - 2018 National Fire Incident Reporting System (NFIRS) incidents
- Incident types reported to NFIRS in Roy, UT
- 15,37271.5%Rescue & EMS
- 2,19010.2%Good Intent Call
- 1,7538.2%Fire
- 1,1735.5%Hazardous Condition
- 6643.1%False Alarm
- 3051.4%Service Call
- 250.1%Overpressure Rupture
- 220.1%Special Incident
- Fire incident types reported to NFIRS in Roy, UT
- 76943.9%Structure Fires
- 50829.0%Outside Fires
- 26915.3%Other
- 20711.8%Mobile Property/Vehicle Fires
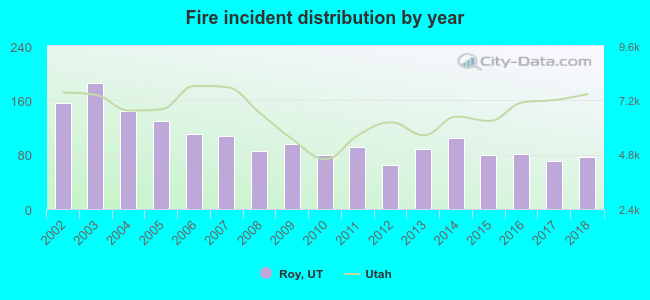 According to the data from the years 2002 - 2018 the average number of fires per year is 103. The highest number of fire incidents - 186 took place in 2003, and the least - 65 in 2012. The data has a declining trend.
The average number of yearly fire incidents per 10k residents in Roy, UT compared to nearest cities:
(Note: Based on data for the last 3 years, including only cities with population 5,000 and above)
| Roy: | 20.1 |
| Clinton: | 20.5 |
| West Haven: | 40.6 |
| Sunset: | 30.4 |
| Riverdale: | 33.0 |
| Hooper: | 23.0 |
| Washington Terrace: | 1.1 |
| West Point: | 23.8 |
| Clearfield: | 29.2 |
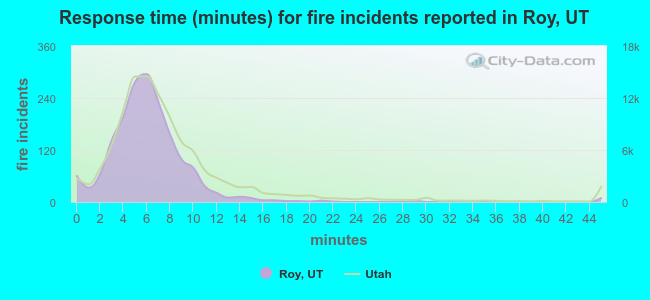 The median response time based on all reported fire incidents is 6 minutes. This is about the same as the Utah median value.
The median response time in Roy, UT compared to nearest cities:
(Note: Based on data for all years, including only cities with at least 500 fire incidents)
| Roy: | 6 minutes |
| West Haven: | 7 minutes |
| Riverdale: | 6 minutes |
| Clearfield: | 6 minutes |
| Ogden: | 6 minutes |
| Syracuse: | 6 minutes |
| Layton: | 6 minutes |
| Kaysville: | 6 minutes |
| Farmington: | 7 minutes |
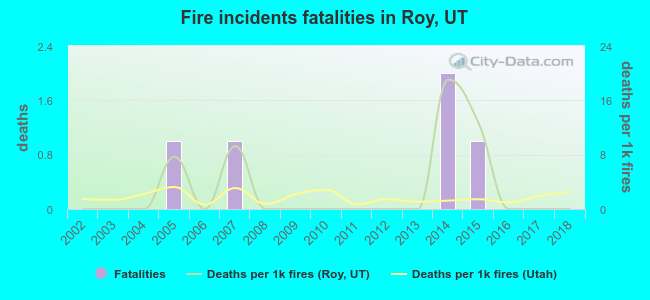 Based on the data from the years 2002 - 2018 the average number of fire-related fatalities per year is 0. The highest number of deaths - 2 took place in 2014, and the lowest - 0 in 2002. The data has a constant trend.
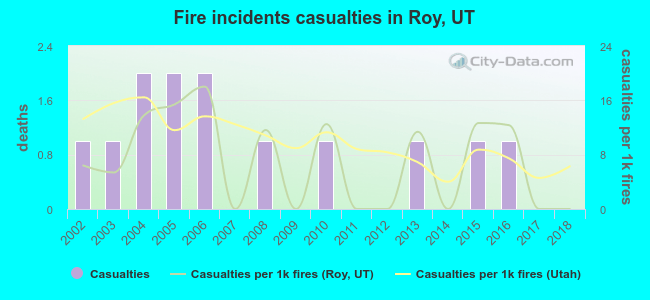 Based on the reports from the years 2002 - 2018 the average number of fire-related yearly casualties is 1. The highest number of injuries - 2 took place in 2004, and the lowest - 0 in 2007. The data has a declining trend.
The average number of casualties per 1,000 fire incidents is 7. This indicator was the highest - 18 in 2006, and the lowest 0 in 2007. The trend for casualties per 1,000 incidents is dropping. Compared to the state value the number of injuries per 1,000 incidents is lower.
Based on the reports from the years 2002 - 2018 the average number of fire-related yearly casualties is 1. The highest number of injuries - 2 took place in 2004, and the lowest - 0 in 2007. The data has a declining trend.
The average number of casualties per 1,000 fire incidents is 7. This indicator was the highest - 18 in 2006, and the lowest 0 in 2007. The trend for casualties per 1,000 incidents is dropping. Compared to the state value the number of injuries per 1,000 incidents is lower.Casualties per 1,000 incidents in Roy, UT compared to nearest cities:
(Note: Based on data for all years, including only cities with at least 500 fire incidents)
| Roy: | 7.4 |
| West Haven: | 6.0 |
| Riverdale: | 0.0 |
| Clearfield: | 23.0 |
| Ogden: | 16.9 |
| Syracuse: | 1.5 |
| Layton: | 30.2 |
| Kaysville: | 21.2 |
| Farmington: | 1.7 |
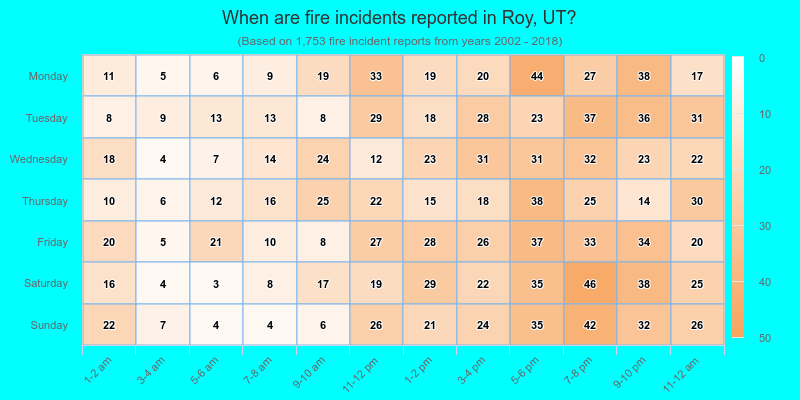
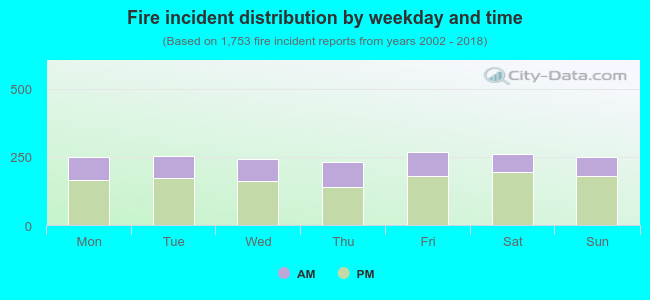 31.9% incidents where reported in the morning and 68.1% in the evening. The most fires (15.3%) took place on Friday, and the least (13.2%) on Thursday.
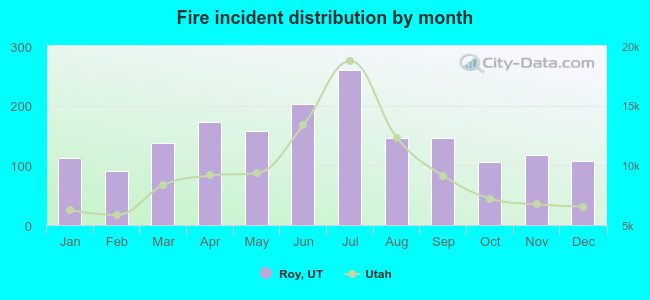 According to the 1,753 fire incident reports from years 2002 - 2018 most fires (14.8%) took place during July, and the least (5.2%) in February.
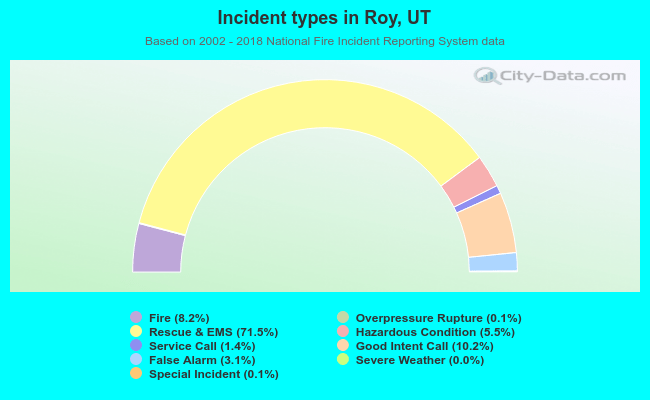 Out of all 21,509 cases reported during the years 2002 - 2018, the most belonged to the categories: Rescue & EMS (71.5%), Good Intent Call (10.2%), and Fire (8.2%).
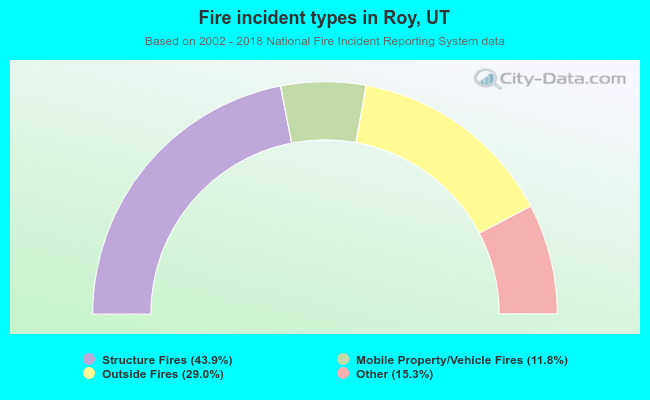 When looking into fire subcategories, the most reports belonged to: Structure Fires (43.9%), and Outside Fires (29.0%).