South Beloit: Fire Incidents, Illinois (IL)
Where are fire incidents reported in South Beloit, IL
Something went wrong! Please refresh the page.
|
| |||||||||||||||||||||||||||||||||||||||||||||||||||||||||||||||||||||||||||||||||||||||||||||||||||||||||||||
2002 - 2018 National Fire Incident Reporting System (NFIRS) incidents
- Incident types reported to NFIRS in South Beloit, IL
- 3,16764.9%Rescue & EMS
- 48710.0%Fire
- 4599.4%Service Call
- 3356.9%Hazardous Condition
- 2144.4%False Alarm
- 1693.5%Good Intent Call
- 350.7%Special Incident
- 110.2%Overpressure Rupture
- Fire incident types reported to NFIRS in South Beloit, IL
- 23548.3%Structure Fires
- 17034.9%Outside Fires
- 4910.1%Mobile Property/Vehicle Fires
- 336.8%Other
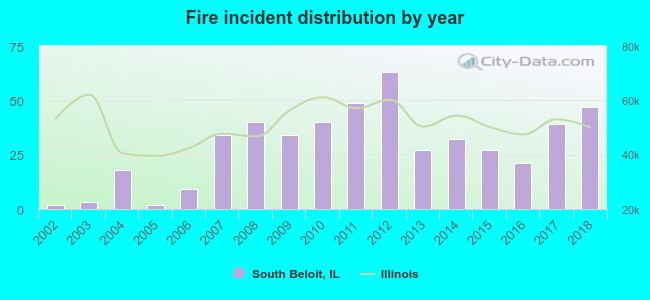 According to the data from the years 2002 - 2018 the average number of fires per year is 29. The highest number of fires - 63 took place in 2012, and the least - 2 in 2002. The data has a rising trend.
The average number of yearly fire incidents per 10k residents in South Beloit, IL compared to nearest cities:
(Note: Based on data for the last 3 years, including only cities with population 5,000 and above)
| South Beloit: | 46.2 |
| Rockton: | 74.1 |
| Roscoe: | 46.8 |
| Machesney Park: | 32.0 |
| Loves Park: | 28.6 |
| Poplar Grove: | 31.0 |
| Rockford: | 49.6 |
| Belvidere: | 48.8 |
| Harvard: | 53.8 |

 37.4% incidents where reported in the morning and 62.6% in the evening. The most fires (17.2%) took place on Friday, and the least (12.3%) on Monday.
 Based on the 487 reports from years 2002 - 2018 most fires (13.6%) took place during April, and the least (5.5%) in February.
 Out of all 4,881 cases reported during the years 2002 - 2018, the most belonged to the categories: Rescue & EMS (64.9%), Fire (10.0%), and Service Call (9.4%).
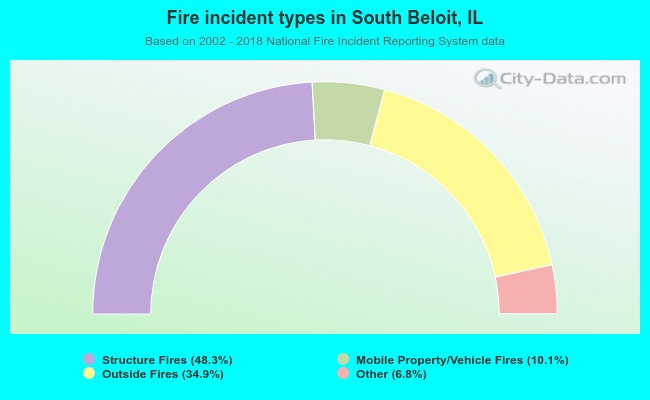 When looking into fire subcategories, the most incidents belonged to: Structure Fires (48.3%), and Outside Fires (34.9%).