Poplar Grove: Fire Incidents, Illinois (IL)
Where are fire incidents reported in Poplar Grove, IL
Something went wrong! Please refresh the page.
|
| |||||||||||||||||||||||||||||||||||||||||||||||||||||||||||||||||||||||||||||||||||||||||||||||||||||||||||||
2003 - 2018 National Fire Incident Reporting System (NFIRS) incidents
- Incident types reported to NFIRS in Poplar Grove, IL
- 28235.3%Rescue & EMS
- 19924.9%Fire
- 14017.5%Hazardous Condition
- 8811.0%False Alarm
- 516.4%Good Intent Call
- 334.1%Service Call
- 30.4%Overpressure Rupture
- 30.4%Severe Weather
- 10.1%Special Incident
- Fire incident types reported to NFIRS in Poplar Grove, IL
- 7336.7%Outside Fires
- 6934.7%Structure Fires
- 4824.1%Mobile Property/Vehicle Fires
- 94.5%Other
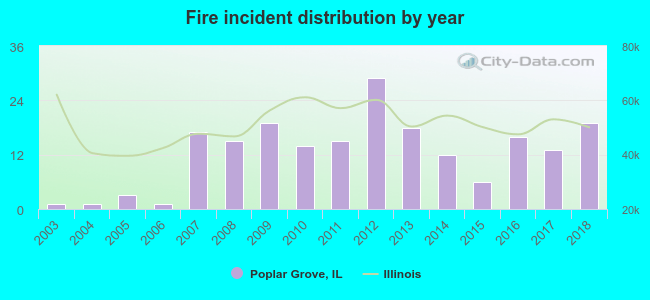 According to the data from the years 2003 - 2018 the average number of fires per year is 12. The highest number of reported fire incidents - 29 took place in 2012, and the least - 1 in 2003. The data has a growing trend.
The average number of yearly fire incidents per 10k residents in Poplar Grove, IL compared to nearest cities:
(Note: Based on data for the last 3 years, including only cities with population 5,000 and above)
| Poplar Grove: | 31.0 |
| Belvidere: | 48.8 |
| Roscoe: | 46.8 |
| Loves Park: | 28.6 |
| Machesney Park: | 32.0 |
| Harvard: | 53.8 |
| Rockton: | 74.1 |
| Rockford: | 49.6 |
| Marengo: | 57.3 |

 29.1% incidents where reported in the morning and 70.9% in the evening. The most fires (17.1%) took place on Sunday, and the least (10.6%) on Wednesday.
 According to the 199 incident reports from years 2003 - 2018 most fires (14.6%) took place during April, and the least (2.0%) in January.
 Out of all 800 cases reported during the years 2003 - 2018, the most belonged to the categories: Rescue & EMS (35.3%), Fire (24.9%), and Hazardous Condition (17.5%).
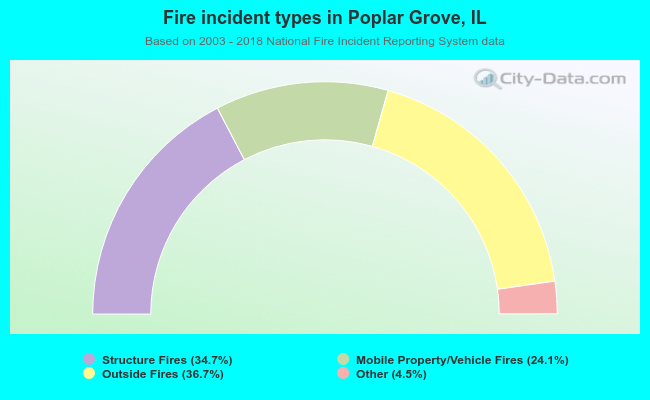 When looking into fire subcategories, the most reports belonged to: Outside Fires (36.7%), and Structure Fires (34.7%).