Rockton: Fire Incidents, Illinois (IL)
Where are fire incidents reported in Rockton, IL
Something went wrong! Please refresh the page.
| Fire incidents reported | |
|---|---|
| Sreet name | Count |
| ROCKTON RD | 104 |
| BLACKHAWK BLVD | 68 |
| MAIN ST | 52 |
| YALE BRIDGE RD | 52 |
| FREEPORT RD | 48 |
| MAIN | 42 |
| MOFFETT RD | 36 |
| OLD RIVER RD | 34 |
| YALE BRIDGE ROAD | 32 |
| UNION ST | 26 |
| HAWICK ST | 24 |
| SHIRLAND RD | 24 |
| BOSWELL ROAD | 20 |
| CHAPEL ST | 20 |
| ROSCOE RD | 20 |
| HAULEY ROAD | 18 |
| HONONEGAH RD | 18 |
| RIVER ST | 18 |
| FOREST PRESERVE RD | 16 |
| ROCKTON AVE | 16 |
| SALEM ST | 16 |
| WAGON WHEEL RD | 16 |
| BLACKHAWK | 14 |
| CENTER ST | 14 |
| GLEASMAN RD | 14 |
| HAWICK | 14 |
| OWEN CENTER RD | 14 |
| POMEROY ROAD | 14 |
| WEST ST | 14 |
| CANNELL ROAD | 12 |
| Other | 102 |
2002 - 2018 National Fire Incident Reporting System (NFIRS) incidents
- Incident types reported to NFIRS in Rockton, IL
- 3,07253.7%Rescue & EMS
- 93216.3%Fire
- 62911.0%Service Call
- 4858.5%Hazardous Condition
- 3105.4%False Alarm
- 2734.8%Good Intent Call
- 110.2%Severe Weather
- Fire incident types reported to NFIRS in Rockton, IL
- 41144.1%Structure Fires
- 38140.9%Outside Fires
- 859.1%Mobile Property/Vehicle Fires
- 555.9%Other
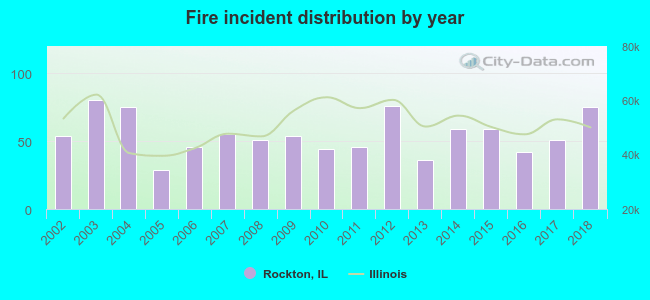 Based on the data from the years 2002 - 2018 the average number of fires per year is 55. The highest number of fires - 80 took place in 2003, and the least - 29 in 2005. The data has a growing trend.
The average number of yearly fire incidents per 10k residents in Rockton, IL compared to nearest cities:
(Note: Based on data for the last 3 years, including only cities with population 5,000 and above)
| Rockton: | 74.1 |
| South Beloit: | 46.2 |
| Roscoe: | 46.8 |
| Machesney Park: | 32.0 |
| Loves Park: | 28.6 |
| Rockford: | 49.6 |
| Poplar Grove: | 31.0 |
| Belvidere: | 48.8 |
| Harvard: | 53.8 |
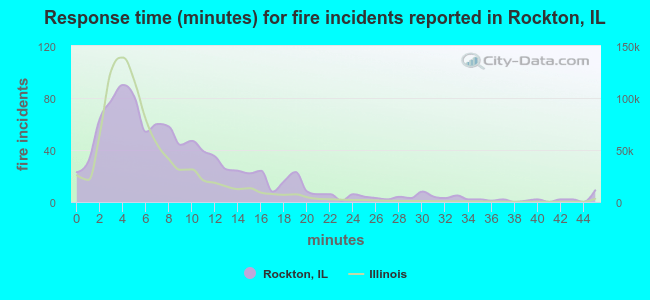 The median response time based on all reported fire incidents is 7 minutes. This is higher compared to the state median value.
The median response time in Rockton, IL compared to nearest cities:
(Note: Based on data for all years, including only cities with at least 500 fire incidents)
| Rockton: | 7 minutes |
| Roscoe: | 6 minutes |
| Machesney Park: | 7 minutes |
| Loves Park: | 9 minutes |
| Rockford: | 5 minutes |
| Winnebago: | 12 minutes |
| Belvidere: | 5 minutes |
| Harvard: | 9 minutes |
| Byron: | 7 minutes |
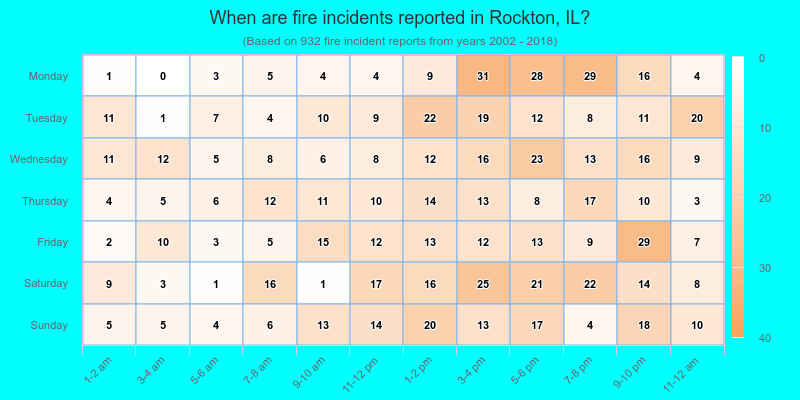
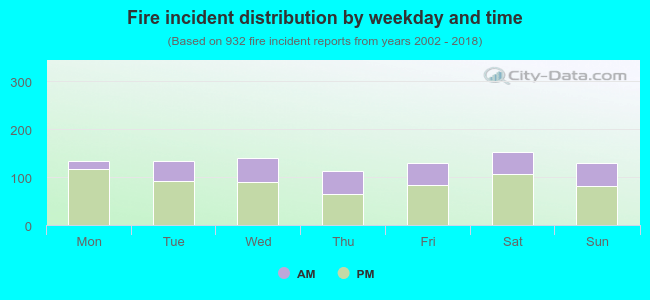 32.0% incidents where reported in the morning and 68.0% in the evening. The most fires (16.4%) took place on Saturday, and the least (12.1%) on Thursday.
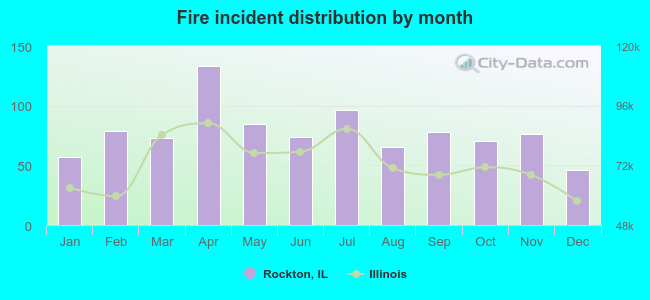 Based on the 932 fire incident reports from years 2002 - 2018 most fires (14.3%) took place during April, and the least (4.9%) in December.
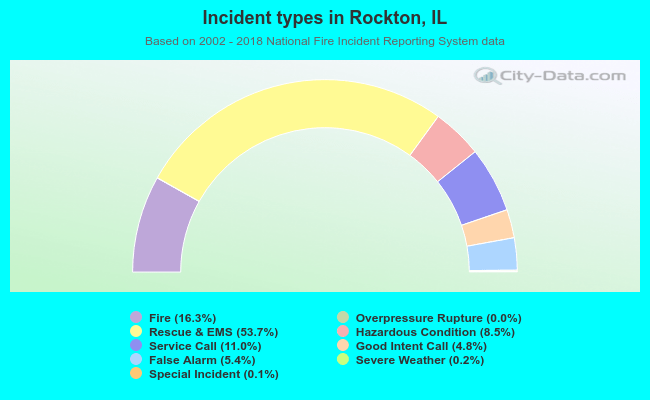 Out of all 5,718 cases reported during the years 2002 - 2018, the most belonged to the categories: Rescue & EMS (53.7%), Fire (16.3%), and Service Call (11.0%).
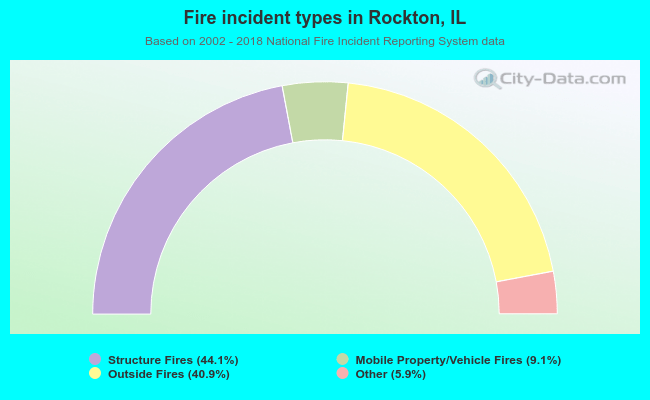 When looking into fire subcategories, the most reports belonged to: Structure Fires (44.1%), and Outside Fires (40.9%).