San Luis Obispo: Fire Incidents, California (CA)
Where are fire incidents reported in San Luis Obispo, CA
Something went wrong! Please refresh the page.
|
| |||||||||||||||||||||||||||||||||||||||||||||||||||||||||||||||||||||||||||||||||||||||||||||||||||||||||||||
2004 - 2018 National Fire Incident Reporting System (NFIRS) incidents
- Incident types reported to NFIRS in San Luis Obispo, CA
- 4,32259.4%Rescue & EMS
- 91312.5%Good Intent Call
- 79210.9%Service Call
- 7039.7%Fire
- 4165.7%False Alarm
- 1161.6%Hazardous Condition
- 80.1%Special Incident
- Fire incident types reported to NFIRS in San Luis Obispo, CA
- 30042.7%Structure Fires
- 26037.0%Outside Fires
- 10114.4%Mobile Property/Vehicle Fires
- 426.0%Other
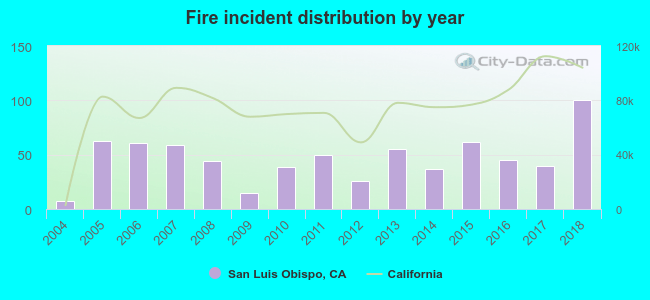 Based on the data from the years 2004 - 2018 the average number of fires per year is 47. The highest number of reported fire incidents - 100 took place in 2018, and the least - 7 in 2004. The data has an increasing trend.
The average number of yearly fire incidents per 10k residents in San Luis Obispo, CA compared to nearest cities:
(Note: Based on data for the last 3 years, including only cities with population 5,000 and above)
| San Luis Obispo: | 13.2 |
| Pismo Beach: | 9.2 |
| Los Osos: | 0.7 |
| Grover Beach: | 0.7 |
| Arroyo Grande: | 3.5 |
| Oceano: | 3.7 |
| Morro Bay: | 3.8 |
| Atascadero: | 15.8 |
| Templeton: | 44.7 |
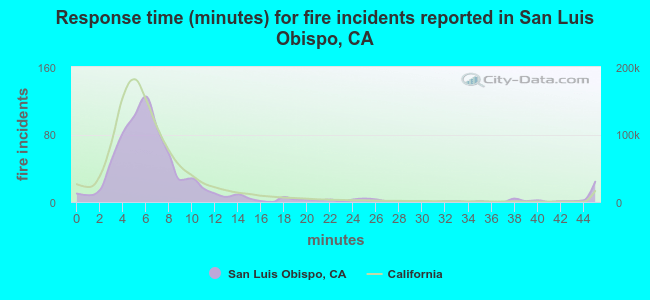 The median response time based on all reported fire incidents is 6 minutes. This is comparable to the state median value.
The median response time in San Luis Obispo, CA compared to nearest cities:
(Note: Based on data for all years, including only cities with at least 500 fire incidents)
| San Luis Obispo: | 6 minutes |
| Santa Maria: | 6 minutes |
| Paso Robles: | 6 minutes |
| Mission Hills: | 5 minutes |
| Lompoc: | 5 minutes |
| Avenal: | 6 minutes |
| Coalinga: | 13 minutes |
| Taft: | 6 minutes |
| Huron: | 9 minutes |
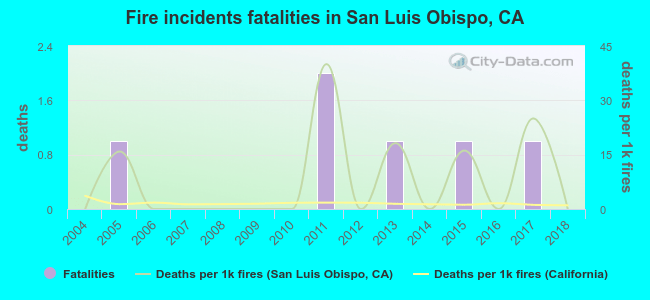 Based on the data from the years 2004 - 2018 the average number of fire-related yearly deaths is 0. The highest number of deaths - 2 took place in 2011, and the lowest - 0 in 2004. The data has a constant trend.
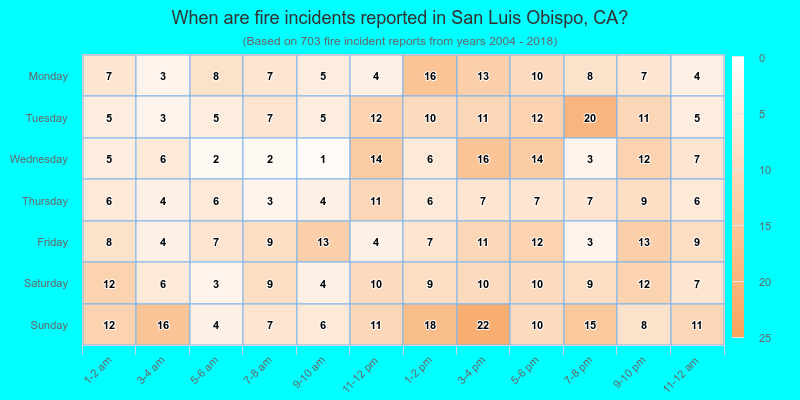
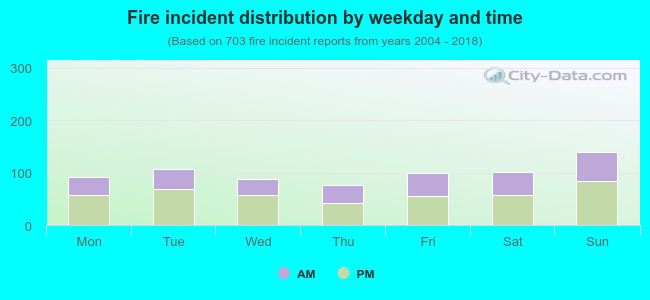 39.8% incidents where reported in the morning and 60.2% in the evening. The most fires (19.9%) took place on Sunday, and the least (10.8%) on Thursday.
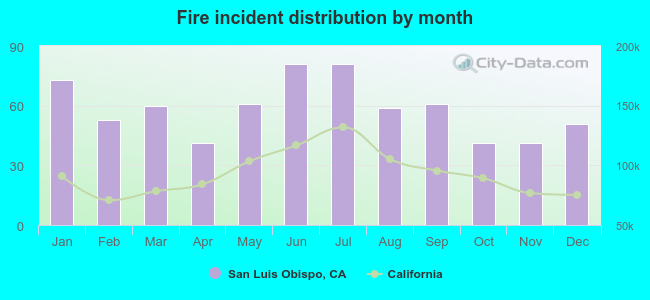 Based on the 703 fire incident reports from years 2004 - 2018 most fires (11.5%) took place during June, and the least (5.8%) in April.
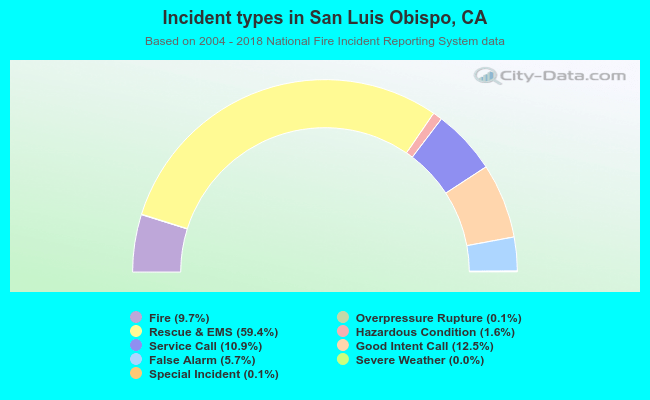 Out of all 7,277 cases reported during the years 2004 - 2018, the most belonged to the categories: Rescue & EMS (59.4%), Good Intent Call (12.5%), and Service Call (10.9%).
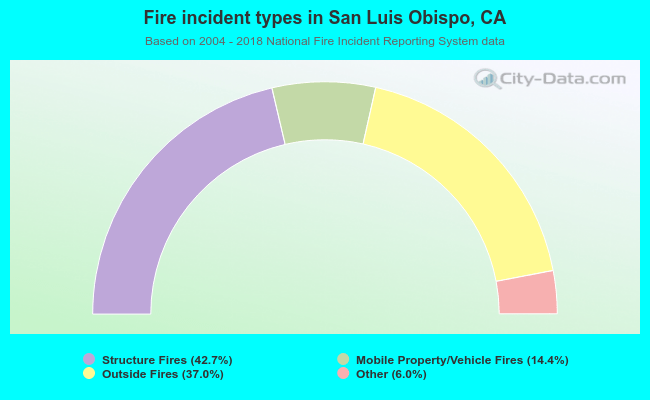 When looking into fire subcategories, the most incidents belonged to: Structure Fires (42.7%), and Outside Fires (37.0%).