Atascadero: Fire Incidents, California (CA)
Where are fire incidents reported in Atascadero, CA
Something went wrong! Please refresh the page.
|
| |||||||||||||||||||||||||||||||||||||||||||||||||||||||||||||||||||||||||||||||||||||||||||||||||||||||||||||
2004 - 2018 National Fire Incident Reporting System (NFIRS) incidents
- Incident types reported to NFIRS in Atascadero, CA
- 3,96762.1%Rescue & EMS
- 78212.2%Good Intent Call
- 69310.8%Service Call
- 4847.6%Fire
- 2614.1%Hazardous Condition
- 1762.8%False Alarm
- 100.2%Special Incident
- 90.1%Overpressure Rupture
- Fire incident types reported to NFIRS in Atascadero, CA
- 21143.6%Outside Fires
- 16534.1%Structure Fires
- 7816.1%Mobile Property/Vehicle Fires
- 306.2%Other
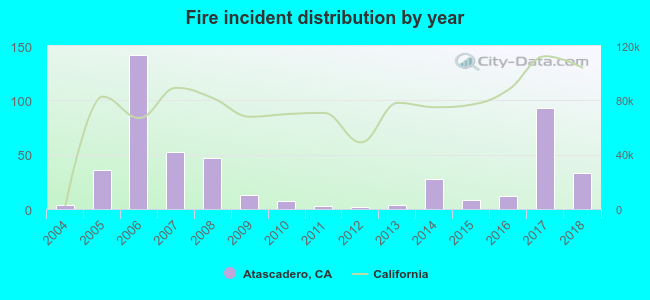 According to the data from the years 2004 - 2018 the average number of fire incidents per year is 32. The highest number of fire incidents - 142 took place in 2006, and the least - 2 in 2012. The data has a rising trend.
The average number of yearly fire incidents per 10k residents in Atascadero, CA compared to nearest cities:
(Note: Based on data for the last 3 years, including only cities with population 5,000 and above)
| Atascadero: | 15.8 |
| Templeton: | 44.7 |
| Paso Robles: | 29.8 |
| Morro Bay: | 3.8 |
| San Luis Obispo: | 13.2 |
| Los Osos: | 0.7 |
| Pismo Beach: | 9.2 |
| Cambria: | 33.2 |
| Grover Beach: | 0.7 |
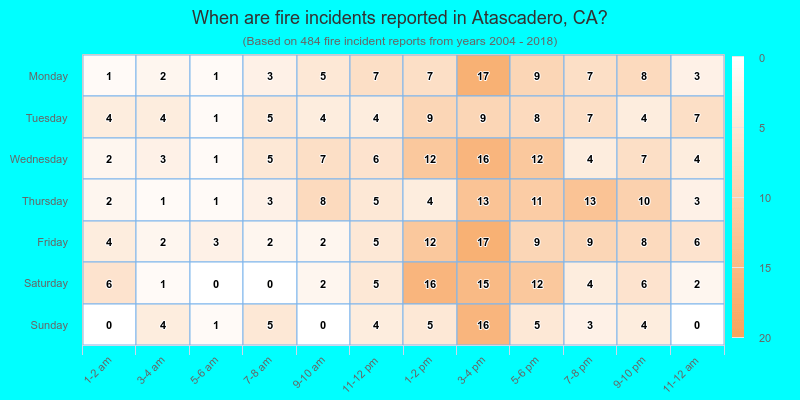
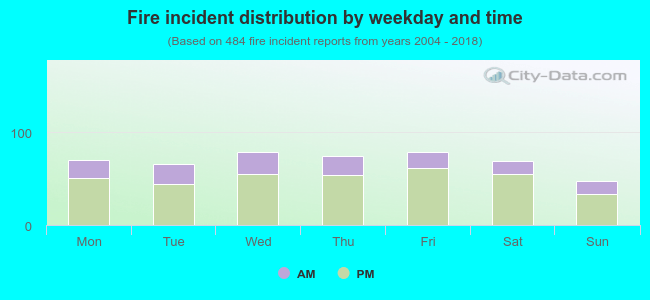 27.1% incidents where reported in the morning and 72.9% in the evening. The most fires (16.3%) took place on Wednesday, and the least (9.7%) on Sunday.
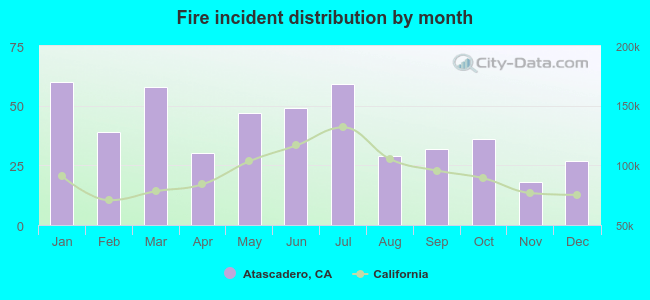 According to the 484 fire incidents from years 2004 - 2018 most fires (12.4%) took place during January, and the least (3.7%) in November.
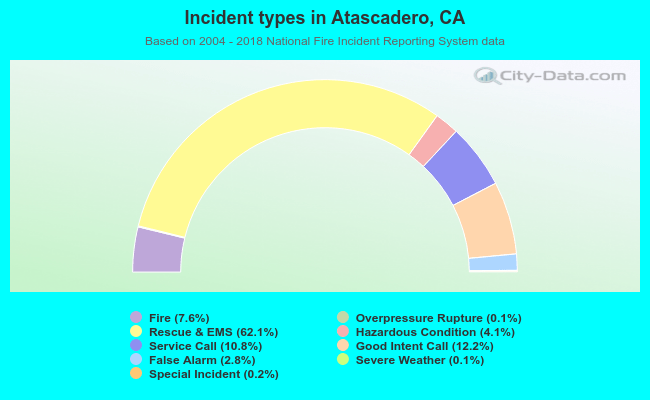 Out of all 6,388 cases reported during the years 2004 - 2018, the most belonged to the categories: Rescue & EMS (62.1%), Good Intent Call (12.2%), and Service Call (10.8%).
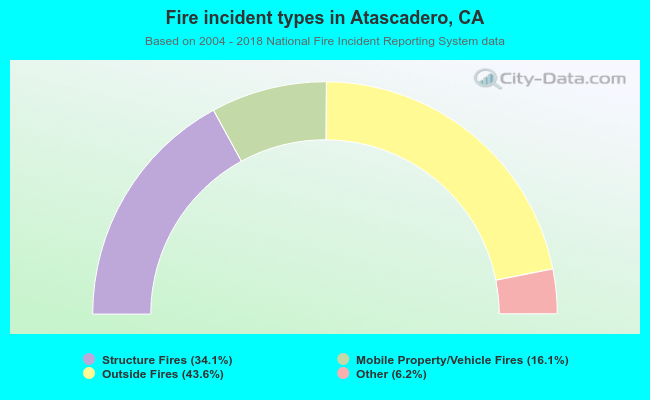 When looking into fire subcategories, the most reports belonged to: Outside Fires (43.6%), and Structure Fires (34.1%).