Avenal: Fire Incidents, California (CA)
Where are fire incidents reported in Avenal, CA
Something went wrong! Please refresh the page.
|
| |||||||||||||||||||||||||||||||||||||||||||||||||||||||||||||||||||||||||||||||||||||||||||||||||||||||||||||
2005 - 2018 National Fire Incident Reporting System (NFIRS) incidents
- Incident types reported to NFIRS in Avenal, CA
- 1,77053.8%Rescue & EMS
- 69321.1%Fire
- 34110.4%Good Intent Call
- 1945.9%Hazardous Condition
- 1765.3%Service Call
- 1133.4%False Alarm
- Fire incident types reported to NFIRS in Avenal, CA
- 43863.2%Outside Fires
- 13819.9%Structure Fires
- 9914.3%Mobile Property/Vehicle Fires
- 182.6%Other
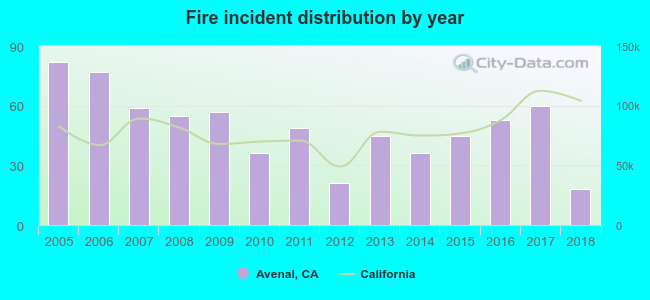 According to the data from the years 2005 - 2018 the average number of fires per year is 50. The highest number of reported fire incidents - 82 took place in 2005, and the least - 18 in 2018. The data has a declining trend.
The average number of yearly fire incidents per 10k residents in Avenal, CA compared to nearest cities:
(Note: Based on data for the last 3 years, including only cities with population 5,000 and above)
| Avenal: | 32.8 |
| Huron: | 110.2 |
| Coalinga: | 82.7 |
| Lemoore: | 32.6 |
| Corcoran: | 23.5 |
| Hanford: | 53.5 |
| Paso Robles: | 29.8 |
| Tulare: | 50.4 |
| Templeton: | 44.7 |
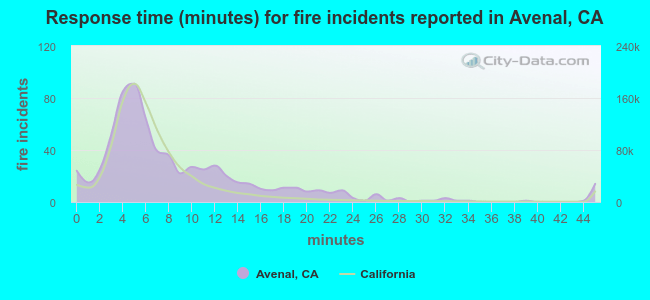 The median response time based on all reported fire incidents is 6 minutes. This is about the same as the state median value.
The median response time in Avenal, CA compared to nearest cities:
(Note: Based on data for all years, including only cities with at least 500 fire incidents)
| Avenal: | 6 minutes |
| Huron: | 9 minutes |
| Coalinga: | 13 minutes |
| Lemoore: | 7 minutes |
| Corcoran: | 6 minutes |
| Riverdale: | 14 minutes |
| Hanford: | 7 minutes |
| Caruthers: | 10 minutes |
| Paso Robles: | 6 minutes |
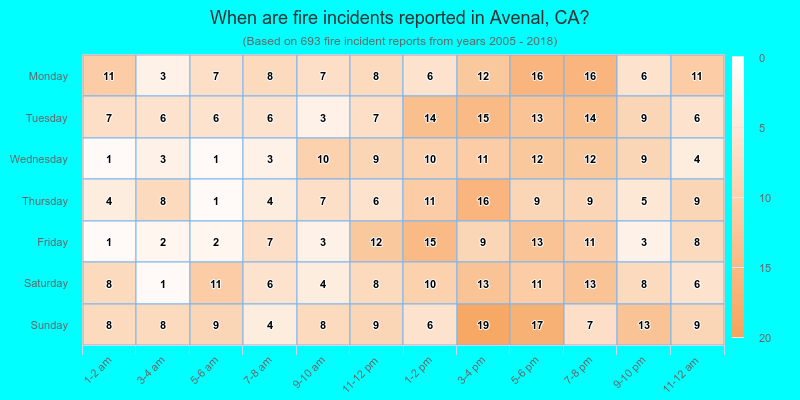
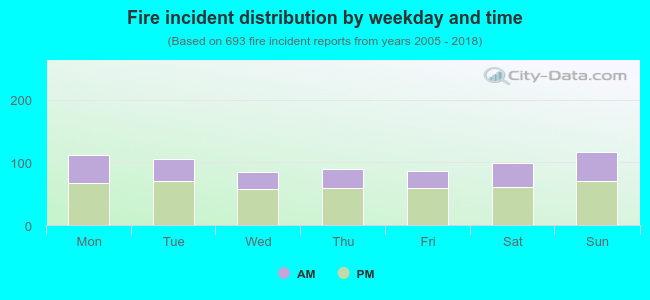 35.6% incidents where reported in the morning and 64.4% in the evening. The most fires (16.9%) took place on Sunday, and the least (12.3%) on Wednesday.
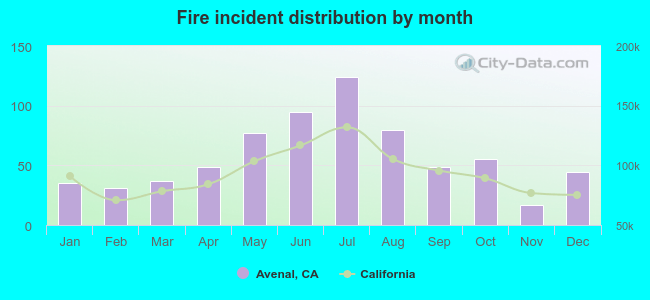 According to the 693 fire incidents from years 2005 - 2018 most fires (17.9%) took place during July, and the least (2.5%) in November.
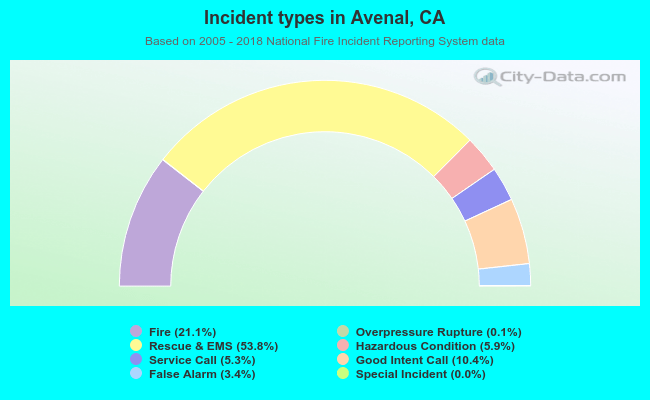 Out of all 3,290 cases reported during the years 2005 - 2018, the most belonged to the categories: Rescue & EMS (53.8%), Fire (21.1%), and Good Intent Call (10.4%).
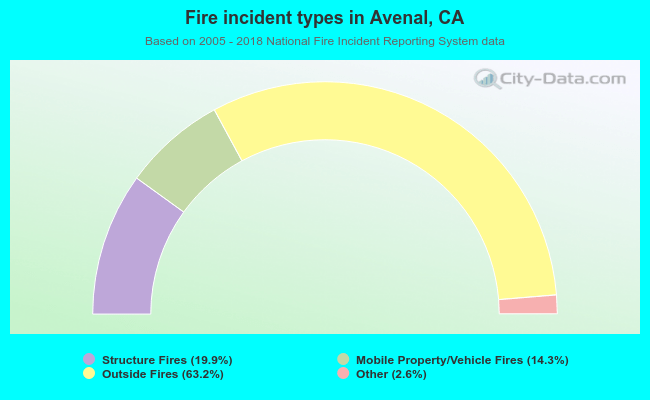 When looking into fire subcategories, the most incidents belonged to: Outside Fires (63.2%), and Structure Fires (19.9%).