Salinas: Fire Incidents, California (CA)
Where are fire incidents reported in Salinas, CA
Something went wrong! Please refresh the page.
| Fire incidents reported | |
|---|---|
| Sreet name | Count |
| MAIN ST | 124 |
| OLD STAGE RD | 100 |
| HWY 101 | 78 |
| LAUREL DR | 64 |
| CONSTITUTION BLVD | 62 |
| MARKET ST | 62 |
| N MAIN ST | 54 |
| HIGHWAY 68 | 52 |
| WORK ST | 50 |
| SANBORN RD | 48 |
| SAN JUAN GRADE RD | 44 |
| SOLEDAD ST | 40 |
| 101 HWY | 38 |
| ALISAL ST | 38 |
| MTY SNS HWY | 30 |
| CORRAL DE TIERRA RD | 28 |
| ENCINAL RD | 28 |
| RIVER RD | 28 |
| BORONDA RD | 26 |
| DAVIS RD | 26 |
| SAN JUAN GRADE RD | 26 |
| SPENCE RD | 26 |
| ALISAL RD | 24 |
| MADEIRA AVE | 24 |
| NOGAL DR | 22 |
| S MAIN ST | 22 |
| SOLEDAD ST | 22 |
| WILLIAMS RD | 22 |
| BEACON HILL DR | 20 |
| BLANCO RD | 20 |
| Other | 969 |
2005 - 2018 National Fire Incident Reporting System (NFIRS) incidents
- Incident types reported to NFIRS in Salinas, CA
- 19,65160.6%Rescue & EMS
- 4,43513.7%Good Intent Call
- 2,4547.6%Service Call
- 2,2176.8%Fire
- 2,0896.4%Hazardous Condition
- 1,4544.5%False Alarm
- 730.2%Severe Weather
- 330.1%Special Incident
- Fire incident types reported to NFIRS in Salinas, CA
- 1,09449.3%Outside Fires
- 59326.7%Structure Fires
- 45820.7%Mobile Property/Vehicle Fires
- 723.2%Other
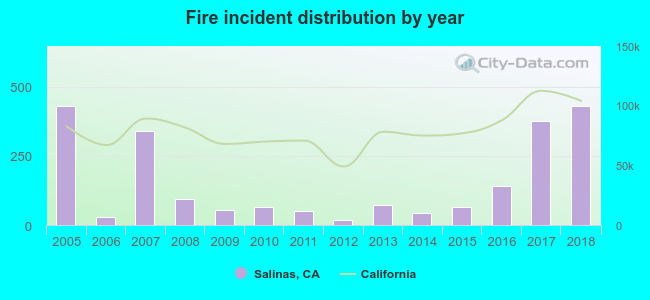 According to the data from the years 2005 - 2018 the average number of fires per year is 158. The highest number of fires - 432 took place in 2005, and the least - 19 in 2012. The data has a decreasing trend.
The average number of yearly fire incidents per 10k residents in Salinas, CA compared to nearest cities:
(Note: Based on data for the last 3 years, including only cities with population 5,000 and above)
| Salinas: | 20.1 |
| Prunedale: | 20.7 |
| Castroville: | 43.2 |
| Marina: | 29.8 |
| Seaside: | 14.8 |
| Monterey: | 30.9 |
| Pacific Grove: | 14.5 |
| Carmel Valley: | 19.7 |
| Gonzales: | 3.6 |
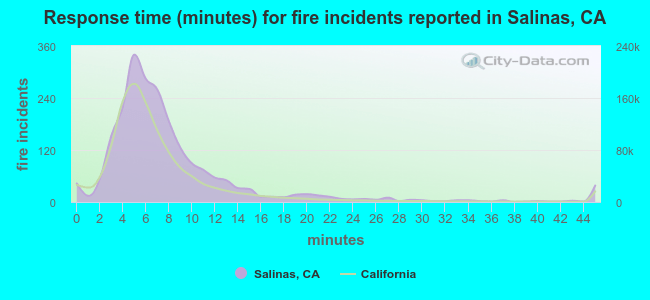 The median response time based on all reported fire incidents is 7 minutes. This is similar to the state median value.
The median response time in Salinas, CA compared to nearest cities:
(Note: Based on data for all years, including only cities with at least 500 fire incidents)
| Salinas: | 7 minutes |
| Prunedale: | 8 minutes |
| Marina: | 6 minutes |
| Seaside: | 4 minutes |
| Monterey: | 4 minutes |
| Watsonville: | 11 minutes |
| Hollister: | 7 minutes |
| Gilroy: | 7 minutes |
| Soledad: | 7 minutes |
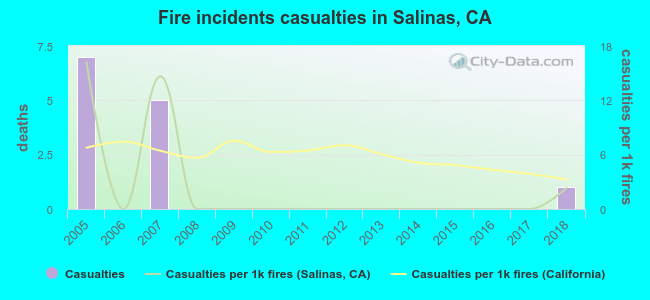 Based on the reports from the years 2005 - 2018 the average number of fire-related yearly casualties is 1. The highest number of reported casualties - 7 took place in 2005, and the lowest - 0 in 2006. The data has a dropping trend.
The average number of casualties per 1,000 fires is 2. This indicator was the highest - 16 in 2005, and the lowest 0 in 2006. The trend for injuries per 1,000 fire incidents is declining. Compared to the California value the number of casualties per 1,000 incidents is similar.
Based on the reports from the years 2005 - 2018 the average number of fire-related yearly casualties is 1. The highest number of reported casualties - 7 took place in 2005, and the lowest - 0 in 2006. The data has a dropping trend.
The average number of casualties per 1,000 fires is 2. This indicator was the highest - 16 in 2005, and the lowest 0 in 2006. The trend for injuries per 1,000 fire incidents is declining. Compared to the California value the number of casualties per 1,000 incidents is similar.
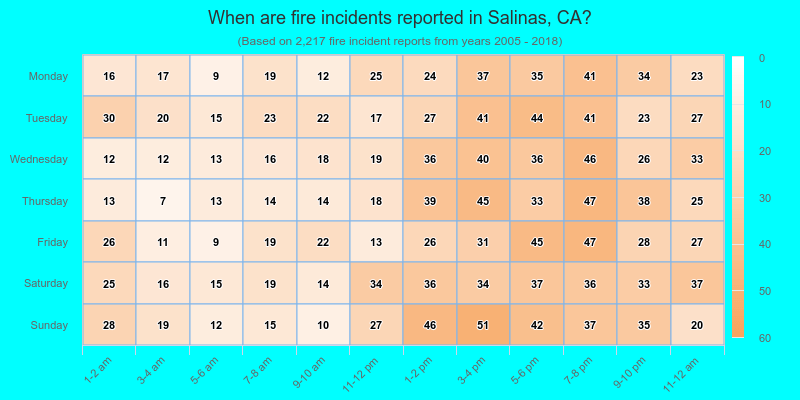
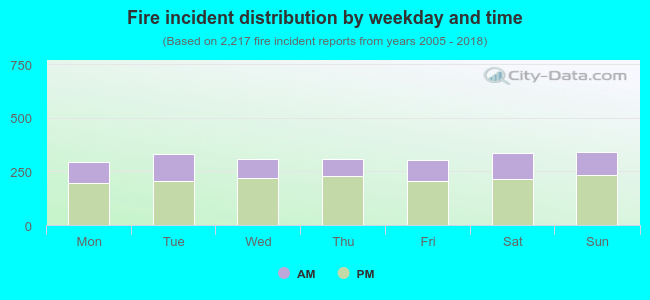 32.8% incidents where reported in the morning and 67.2% in the evening. The most fires (15.4%) took place on Sunday, and the least (13.2%) on Monday.
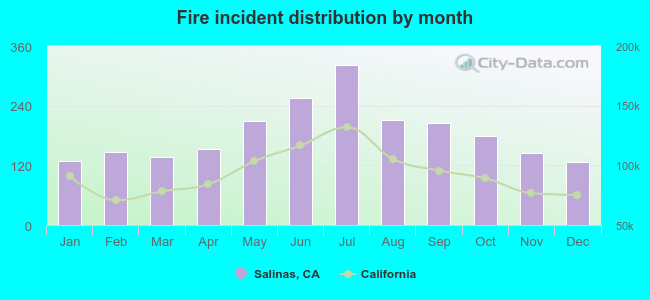 Based on the 2,217 fires from years 2005 - 2018 most fires (14.5%) took place during July, and the least (5.7%) in December.
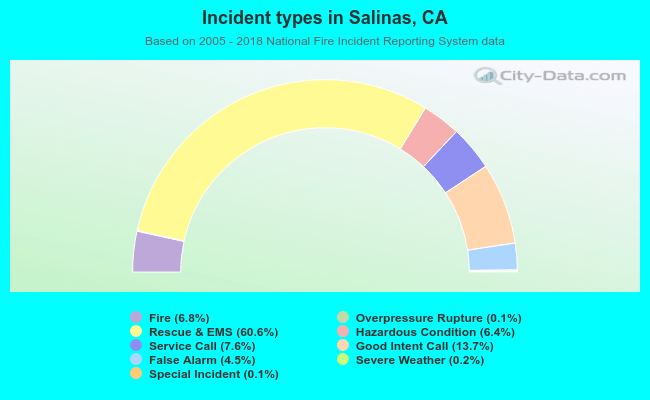 Out of all 32,433 cases reported during the years 2005 - 2018, the most belonged to the categories: Rescue & EMS (60.6%), Good Intent Call (13.7%), and Service Call (7.6%).
 When looking into fire subcategories, the most reports belonged to: Outside Fires (49.3%), and Structure Fires (26.7%).