Pacific Grove: Fire Incidents, California (CA)
Where are fire incidents reported in Pacific Grove, CA
Something went wrong! Please refresh the page.
|
| |||||||||||||||||||||||||||||||||||||||||||||||||||||||||||||||||||||||||||||||||||||||||||||||||||||||||||||
2002 - 2018 National Fire Incident Reporting System (NFIRS) incidents
- Incident types reported to NFIRS in Pacific Grove, CA
- 3,89653.7%Rescue & EMS
- 1,08815.0%Service Call
- 92512.7%Hazardous Condition
- 5898.1%Good Intent Call
- 4906.8%False Alarm
- 2443.4%Fire
- 160.2%Severe Weather
- Fire incident types reported to NFIRS in Pacific Grove, CA
- 12450.8%Structure Fires
- 8836.1%Outside Fires
- 218.6%Mobile Property/Vehicle Fires
- 114.5%Other
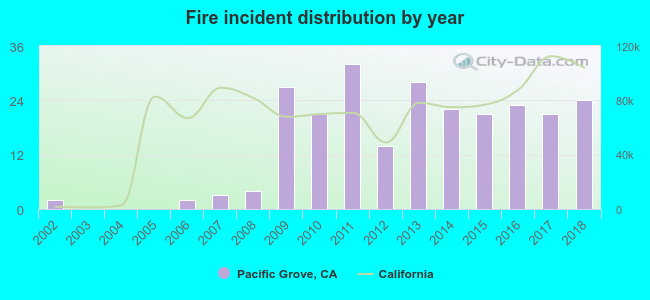 Based on the data from the years 2002 - 2018 the average number of fire incidents per year is 14. The highest number of reported fires - 32 took place in 2011, and the least - 0 in 2003. The data has an increasing trend.
The average number of yearly fire incidents per 10k residents in Pacific Grove, CA compared to nearest cities:
(Note: Based on data for the last 3 years, including only cities with population 5,000 and above)
| Pacific Grove: | 14.5 |
| Monterey: | 30.9 |
| Seaside: | 14.8 |
| Carmel: | 11.7 |
| Marina: | 29.8 |
| Castroville: | 43.2 |
| Salinas: | 20.1 |
| Carmel Valley: | 19.7 |
| Prunedale: | 20.7 |
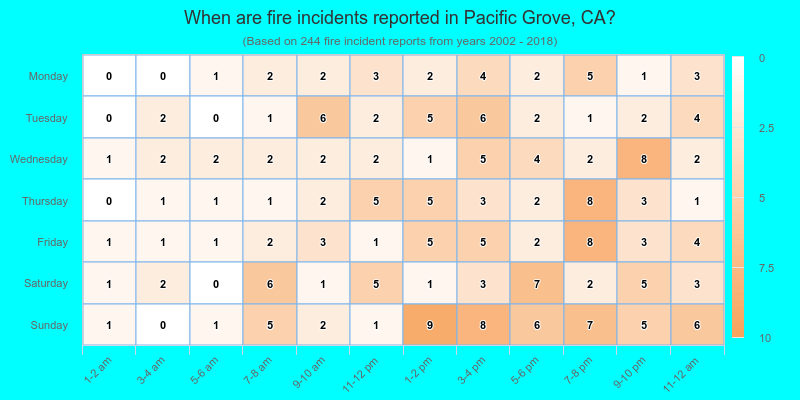
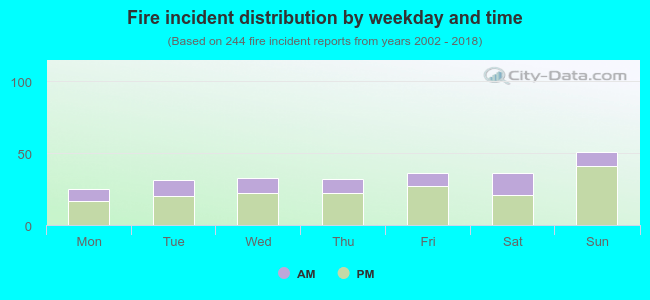 30.3% incidents where reported in the morning and 69.7% in the evening. The most fires (20.9%) took place on Sunday, and the least (10.2%) on Monday.
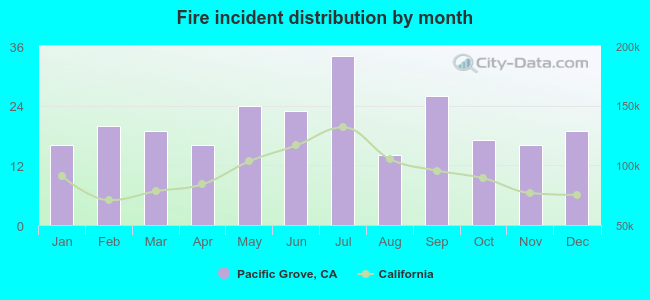 Based on the 244 fire incident reports from years 2002 - 2018 most fires (13.9%) took place during July, and the least (5.7%) in August.
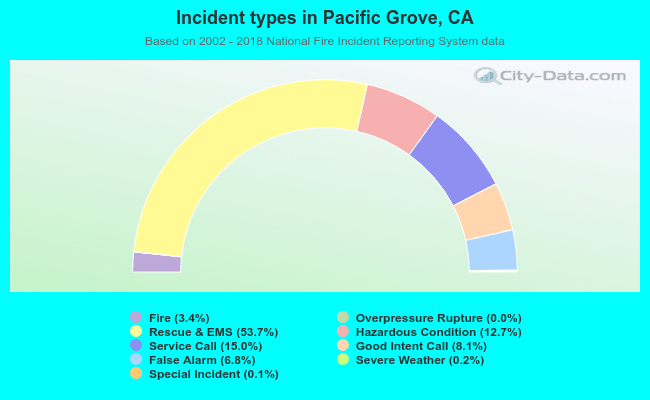 Out of all 7,255 cases reported during the years 2002 - 2018, the most belonged to the categories: Rescue & EMS (53.7%), Service Call (15.0%), and Hazardous Condition (12.7%).
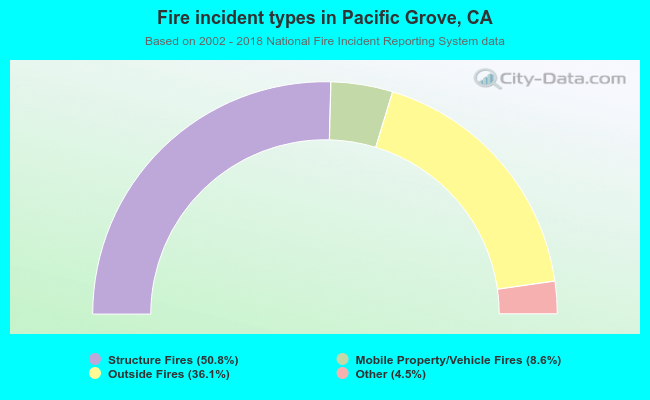 When looking into fire subcategories, the most reports belonged to: Structure Fires (50.8%), and Outside Fires (36.1%).