Castroville: Fire Incidents, California (CA)
Where are fire incidents reported in Castroville, CA
Something went wrong! Please refresh the page.
|
| |||||||||||||||||||||||||||||||||||||||||||||||||||||||||||||||||||||||||||||||||||||||||||||||||||||||||||||
2002 - 2018 National Fire Incident Reporting System (NFIRS) incidents
- Incident types reported to NFIRS in Castroville, CA
- 1,82856.5%Rescue & EMS
- 45514.1%Hazardous Condition
- 39512.2%Fire
- 2186.7%Service Call
- 1635.0%Good Intent Call
- 1625.0%False Alarm
- 120.4%Special Incident
- Fire incident types reported to NFIRS in Castroville, CA
- 13834.9%Structure Fires
- 13233.4%Outside Fires
- 10426.3%Mobile Property/Vehicle Fires
- 215.3%Other
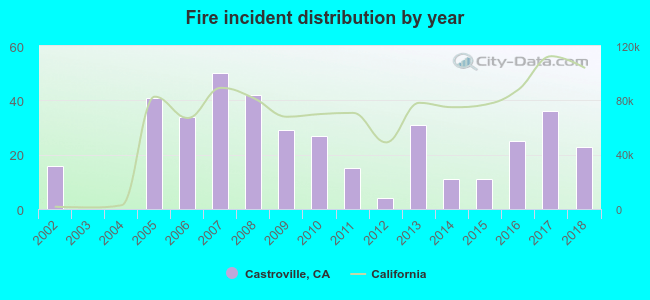 According to the data from the years 2002 - 2018 the average number of fire incidents per year is 23. The highest number of fire incidents - 50 took place in 2007, and the least - 0 in 2003. The data has a growing trend.
The average number of yearly fire incidents per 10k residents in Castroville, CA compared to nearest cities:
(Note: Based on data for the last 3 years, including only cities with population 5,000 and above)
| Castroville: | 43.2 |
| Prunedale: | 20.7 |
| Marina: | 29.8 |
| Salinas: | 20.1 |
| Watsonville: | 9.2 |
| Seaside: | 14.8 |
| Monterey: | 30.9 |
| Pacific Grove: | 14.5 |
| Aptos: | 38.0 |
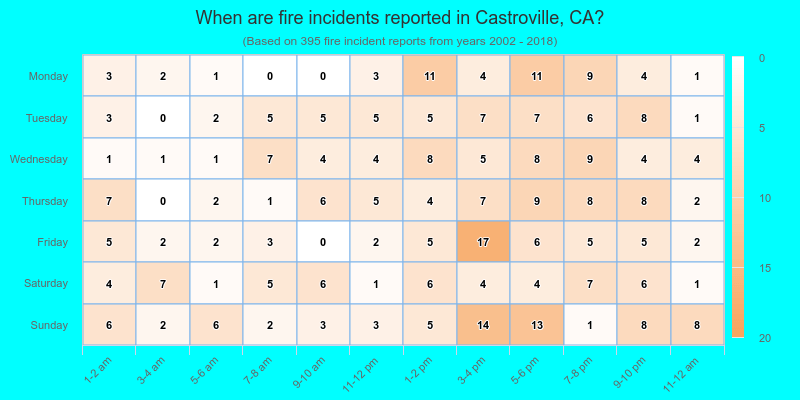
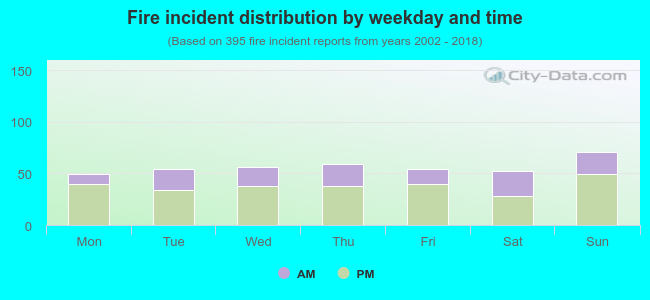 32.4% incidents where reported in the morning and 67.6% in the evening. The most fires (18.0%) took place on Sunday, and the least (12.4%) on Monday.
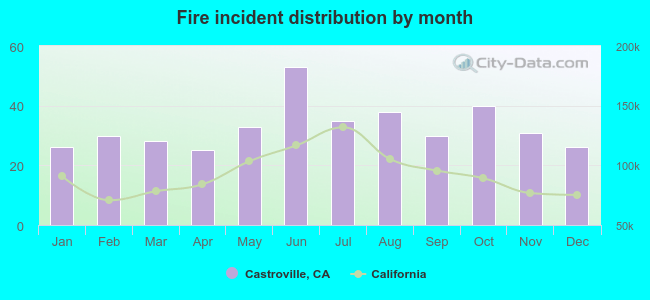 Based on the 395 fire incidents from years 2002 - 2018 most fires (13.4%) took place during June, and the least (6.3%) in April.
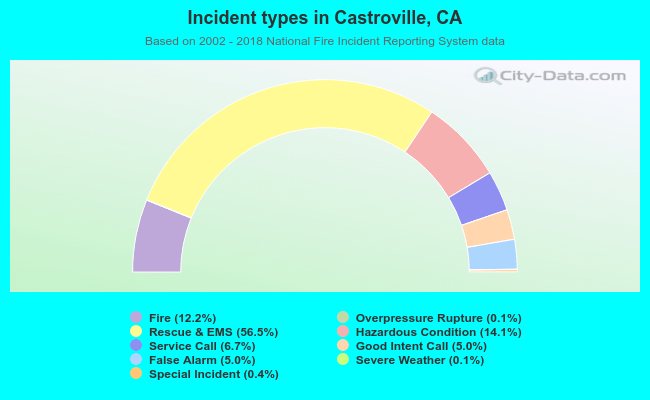 Out of all 3,237 cases reported during the years 2002 - 2018, the most belonged to the categories: Rescue & EMS (56.5%), Hazardous Condition (14.1%), and Fire (12.2%).
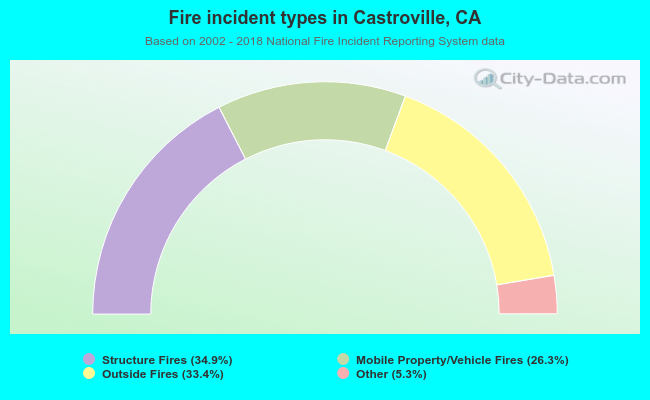 When looking into fire subcategories, the most reports belonged to: Structure Fires (34.9%), and Outside Fires (33.4%).