Prescott Valley: Fire Incidents, Arizona (AZ)
Where are fire incidents reported in Prescott Valley, AZ
Something went wrong! Please refresh the page.
|
| |||||||||||||||||||||||||||||||||||||||||||||||||||||||||||||||||||||||||||||||||||||||||||||||||||||||||||||
| Other | 453 | |||||||||||||||||||||||||||||||||||||||||||||||||||||||||||||||||||||||||||||||||||||||||||||||||||||||||||||
2005 - 2018 National Fire Incident Reporting System (NFIRS) incidents
- Incident types reported to NFIRS in Prescott Valley, AZ
- 23,33363.6%Rescue & EMS
- 6,00316.4%Service Call
- 4,00110.9%Good Intent Call
- 1,1333.1%Fire
- 1,1033.0%Hazardous Condition
- 1,0642.9%False Alarm
- Fire incident types reported to NFIRS in Prescott Valley, AZ
- 48042.4%Outside Fires
- 42737.7%Structure Fires
- 19317.0%Mobile Property/Vehicle Fires
- 332.9%Other
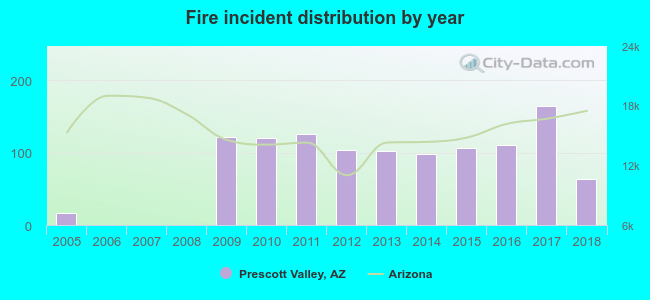 Based on the data from the years 2005 - 2018 the average number of fire incidents per year is 81. The highest number of reported fire incidents - 165 took place in 2017, and the least - 0 in 2006. The data has an increasing trend.
The average number of yearly fire incidents per 10k residents in Prescott Valley, AZ compared to nearest cities:
(Note: Based on data for the last 3 years, including only cities with population 5,000 and above)
| Prescott Valley: | 27.4 |
| Prescott: | 20.8 |
| Chino Valley: | 15.4 |
| Cottonwood: | 65.0 |
| Paulden: | 3.8 |
| Camp Verde: | 21.0 |
| Sedona: | 64.8 |
| Wickenburg: | 41.4 |
| Anthem: | 5.5 |
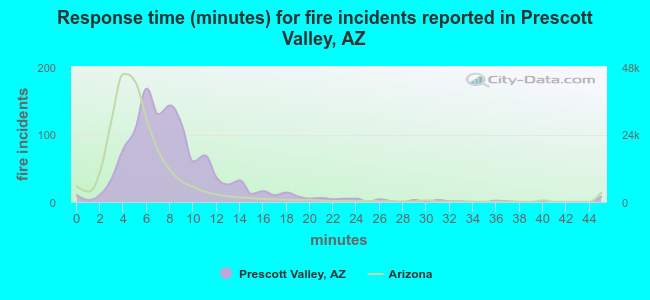 The median response time based on all reported fire incidents is 8 minutes. This is higher compared to the Arizona median value.
The median response time in Prescott Valley, AZ compared to nearest cities:
(Note: Based on data for all years, including only cities with at least 500 fire incidents)
| Prescott Valley: | 8 minutes |
| Prescott: | 6 minutes |
| Cottonwood: | 6 minutes |
| Sedona: | 6 minutes |
| Flagstaff: | 7 minutes |
| Payson: | 5 minutes |
| Surprise: | 5 minutes |
| Peoria: | 5 minutes |
| Sun City: | 4 minutes |
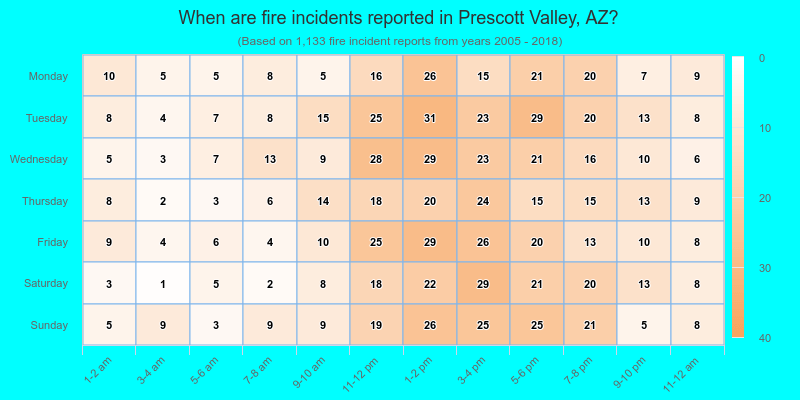
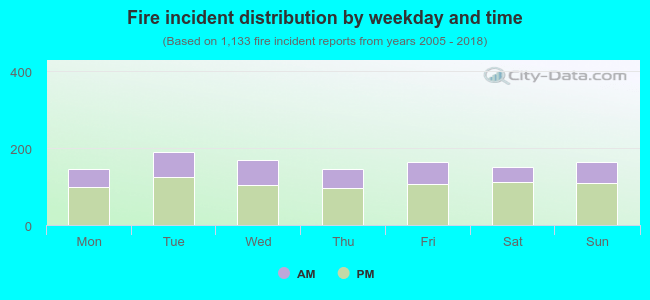 33.6% incidents where reported in the morning and 66.4% in the evening. The most fires (16.9%) took place on Tuesday, and the least (13.0%) on Monday.
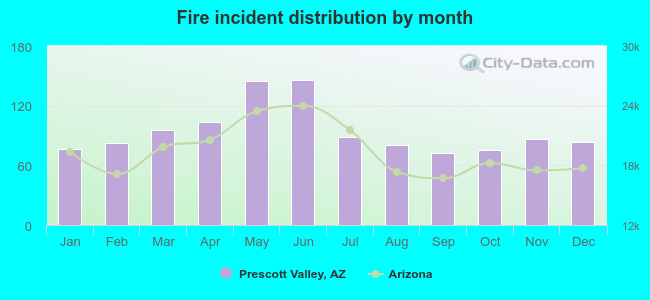 According to the 1,133 fire incident reports from years 2005 - 2018 most fires (12.9%) took place during June, and the least (6.4%) in September.
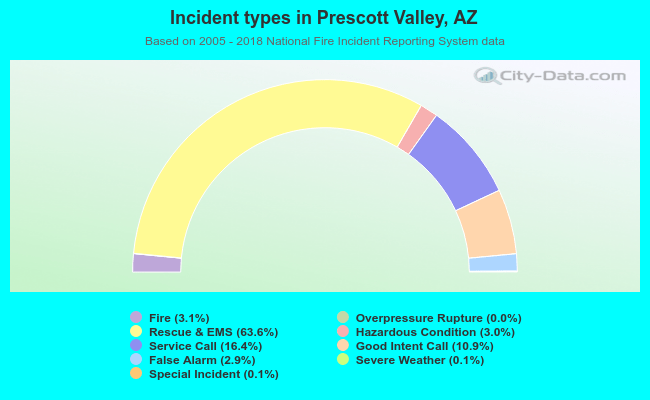 Out of all 36,699 cases reported during the years 2005 - 2018, the most belonged to the categories: Rescue & EMS (63.6%), Service Call (16.4%), and Good Intent Call (10.9%).
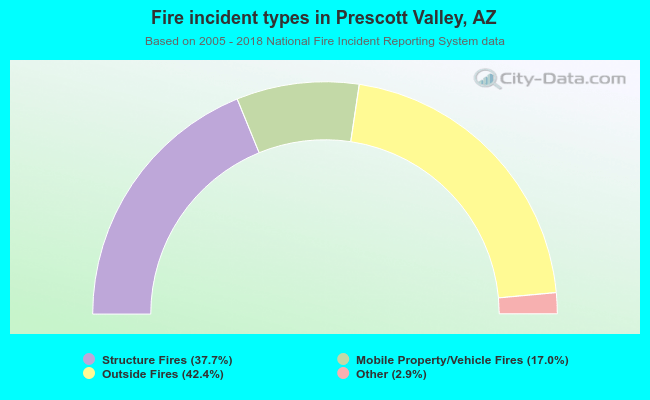 When looking into fire subcategories, the most reports belonged to: Outside Fires (42.4%), and Structure Fires (37.7%).