Sedona: Fire Incidents, Arizona (AZ)
Where are fire incidents reported in Sedona, AZ
Something went wrong! Please refresh the page.
|
| |||||||||||||||||||||||||||||||||||||||||||||||||||||||||||||||||||||||||||||||||||||||||||||||||||||||||||||
2003 - 2018 National Fire Incident Reporting System (NFIRS) incidents
- Incident types reported to NFIRS in Sedona, AZ
- 13,78968.8%Rescue & EMS
- 3,17115.8%Service Call
- 8464.2%Good Intent Call
- 8184.1%False Alarm
- 7793.9%Fire
- 5042.5%Hazardous Condition
- 930.5%Special Incident
- Fire incident types reported to NFIRS in Sedona, AZ
- 29938.4%Outside Fires
- 27234.9%Structure Fires
- 12516.0%Mobile Property/Vehicle Fires
- 8310.7%Other
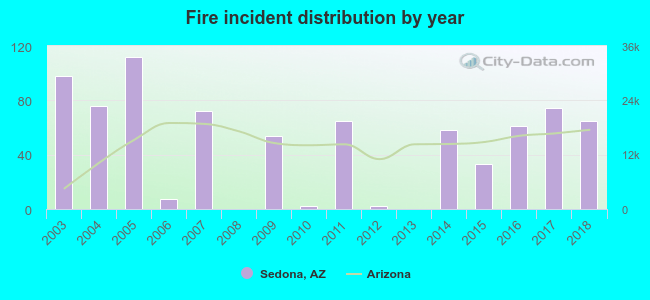 Based on the data from the years 2003 - 2018 the average number of fire incidents per year is 49. The highest number of fire incidents - 112 took place in 2005, and the least - 0 in 2008. The data has a dropping trend.
The average number of yearly fire incidents per 10k residents in Sedona, AZ compared to nearest cities:
(Note: Based on data for the last 3 years, including only cities with population 5,000 and above)
| Sedona: | 64.8 |
| Cottonwood: | 65.0 |
| Camp Verde: | 21.0 |
| Coconino: | 0.1 |
| Flagstaff: | 34.7 |
| Prescott Valley: | 27.4 |
| Chino Valley: | 15.4 |
| Paulden: | 3.8 |
| Prescott: | 20.8 |
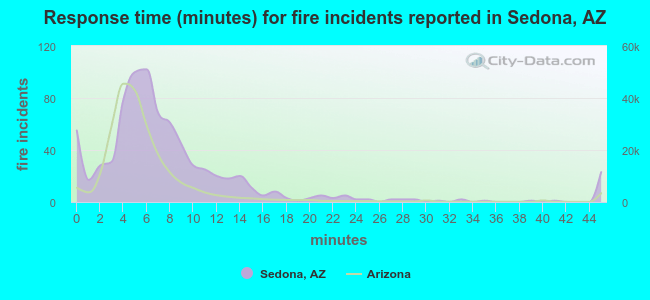 The median response time based on all reported fire incidents is 6 minutes. This is about the same as the state median value.
The median response time in Sedona, AZ compared to nearest cities:
(Note: Based on data for all years, including only cities with at least 500 fire incidents)
| Sedona: | 6 minutes |
| Cottonwood: | 6 minutes |
| Flagstaff: | 7 minutes |
| Prescott Valley: | 8 minutes |
| Prescott: | 6 minutes |
| Payson: | 5 minutes |
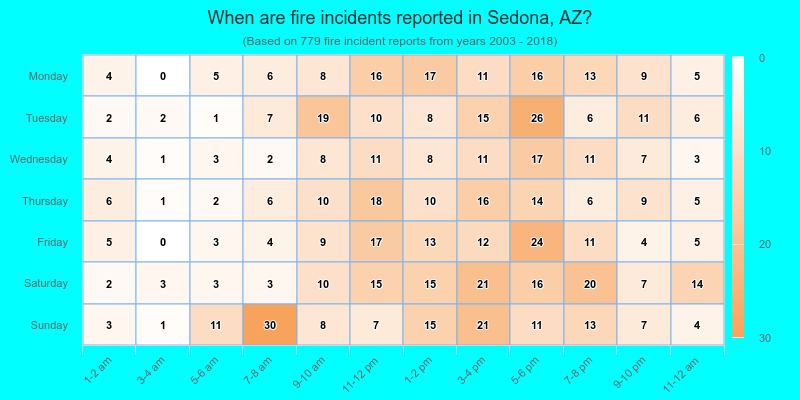
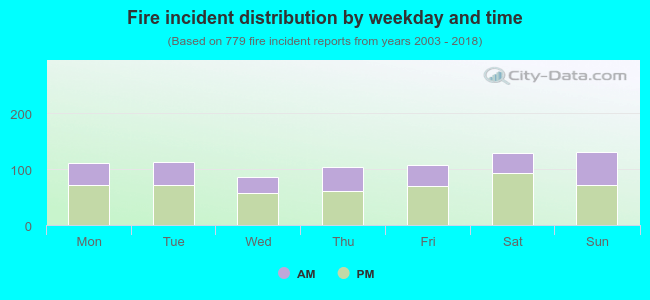 36.7% incidents where reported in the morning and 63.3% in the evening. The most fires (16.8%) took place on Sunday, and the least (11.0%) on Wednesday.
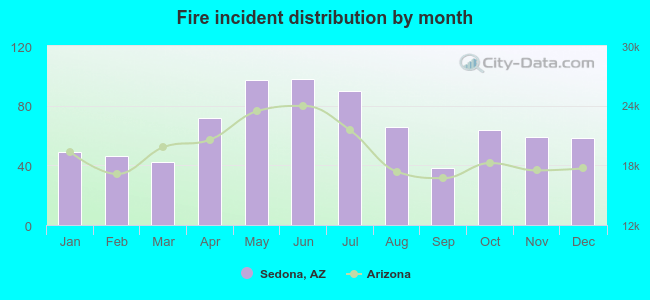 According to the 779 fire incidents from years 2003 - 2018 most fires (12.6%) took place during June, and the least (4.9%) in September.
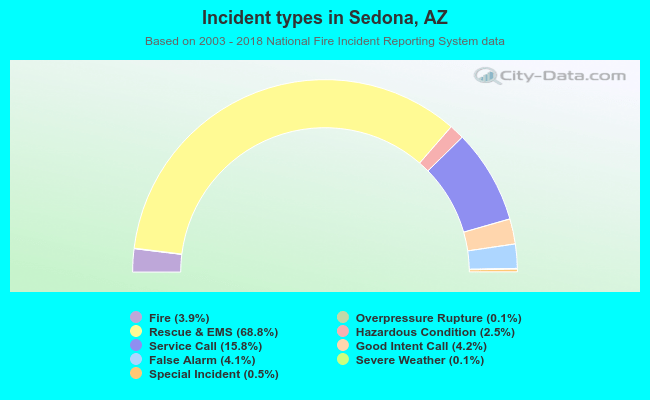 Out of all 20,037 cases reported during the years 2003 - 2018, the most belonged to the categories: Rescue & EMS (68.8%), Service Call (15.8%), and Good Intent Call (4.2%).
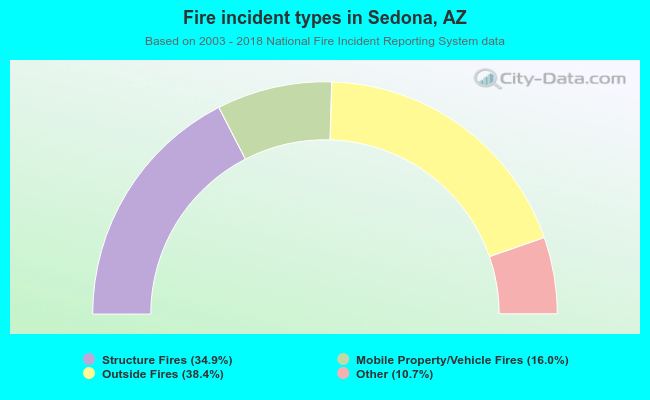 When looking into fire subcategories, the most incidents belonged to: Outside Fires (38.4%), and Structure Fires (34.9%).