Mount Vernon: Fire Incidents, Illinois (IL)
Where are fire incidents reported in Mount Vernon, IL
Something went wrong! Please refresh the page.
| Fire incidents reported | |
|---|---|
| Sreet name | Count |
| BROADWAY ST | 84 |
| 12TH ST | 76 |
| 22ND ST | 76 |
| 15TH ST | 64 |
| 10TH ST | 54 |
| 17TH ST | 52 |
| 18TH ST | 44 |
| 24TH ST | 44 |
| CASEY AVE | 44 |
| 19TH ST | 42 |
| 23RD ST | 42 |
| SHAWNEE ST | 42 |
| 13TH ST | 36 |
| 7TH ST | 36 |
| 20TH ST | 32 |
| 21ST ST | 32 |
| COLLEGE ST | 32 |
| HERBERT ST | 32 |
| MAIN ST | 32 |
| 16TH ST | 30 |
| 6TH ST | 30 |
| FOREST AVE | 30 |
| 42ND ST | 28 |
| CHERRY ST | 28 |
| LAMAR AVE | 28 |
| 8TH ST | 26 |
| CONGER AVE | 26 |
| FAIRFIELD RD | 26 |
| PERKINS AVE | 26 |
| VETERANS MEMORIAL DR | 26 |
2003 - 2018 National Fire Incident Reporting System (NFIRS) incidents
- Incident types reported to NFIRS in Mount Vernon, IL
- 2,28344.3%Rescue & EMS
- 1,18723.0%Fire
- 98519.1%Hazardous Condition
- 2995.8%False Alarm
- 2124.1%Service Call
- 1793.5%Good Intent Call
- 100.2%Overpressure Rupture
- Fire incident types reported to NFIRS in Mount Vernon, IL
- 51743.6%Outside Fires
- 41735.1%Structure Fires
- 22519.0%Mobile Property/Vehicle Fires
- 282.4%Other
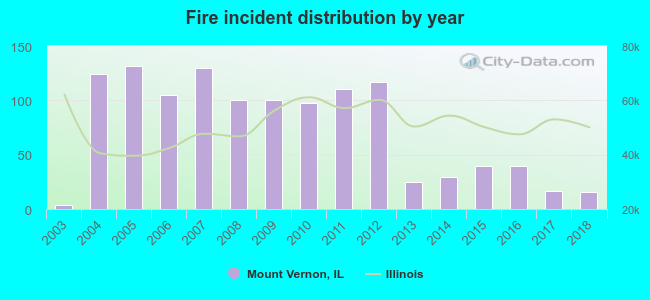 According to the data from the years 2003 - 2018 the average number of fire incidents per year is 74. The highest number of reported fire incidents - 132 took place in 2005, and the least - 4 in 2003. The data has a growing trend.
The average number of yearly fire incidents per 10k residents in Mount Vernon, IL compared to nearest cities:
(Note: Based on data for the last 3 years, including only cities with population 5,000 and above)
| Mount Vernon: | 16.0 |
| Centralia: | 68.8 |
| Benton: | 150.6 |
| Salem: | 98.6 |
| Du Quoin: | 63.8 |
| West Frankfort: | 153.5 |
| Fairfield: | 74.8 |
| Pinckneyville: | 36.7 |
 The median response time based on all reported fire incidents is 4 minutes. This is lower compared to the state median value.
The median response time in Mount Vernon, IL compared to nearest cities:
(Note: Based on data for all years, including only cities with at least 500 fire incidents)
| Mount Vernon: | 4 minutes |
| Centralia: | 4 minutes |
| Benton: | 4 minutes |
| Salem: | 7 minutes |
| Sandoval: | 5 minutes |
| Nashville: | 10 minutes |
| Mitchell: | 5 minutes |
| West Frankfort: | 5 minutes |
| Fairfield: | 6 minutes |
 According to the data from the years 2003 - 2018 the average number of fire-related fatalities per year is 0. The highest number of reported deaths - 2 took place in 2008, and the lowest - 0 in 2003. The data has a constant trend.
 According to the data from the years 2003 - 2018 the average number of fire-related yearly casualties is 2. The highest number of reported injuries - 11 took place in 2005, and the lowest - 0 in 2003. The data has a growing trend.
The average number of injuries per 1,000 fire incidents is 21. This indicator was the highest - 83 in 2005, and the lowest 0 in 2003. The trend for casualties per 1,000 fire incidents is growing. Compared to the state value the number of casualties per 1,000 incidents is much higher.
According to the data from the years 2003 - 2018 the average number of fire-related yearly casualties is 2. The highest number of reported injuries - 11 took place in 2005, and the lowest - 0 in 2003. The data has a growing trend.
The average number of injuries per 1,000 fire incidents is 21. This indicator was the highest - 83 in 2005, and the lowest 0 in 2003. The trend for casualties per 1,000 fire incidents is growing. Compared to the state value the number of casualties per 1,000 incidents is much higher.
 32.1% incidents where reported in the morning and 67.9% in the evening. The most fires (16.8%) took place on Saturday, and the least (12.9%) on Thursday.
 Based on the 1,187 incident reports from years 2003 - 2018 most fires (9.9%) took place during October, and the least (6.1%) in January.
 Out of all 5,159 cases reported during the years 2003 - 2018, the most belonged to the categories: Rescue & EMS (44.3%), Fire (23.0%), and Hazardous Condition (19.1%).
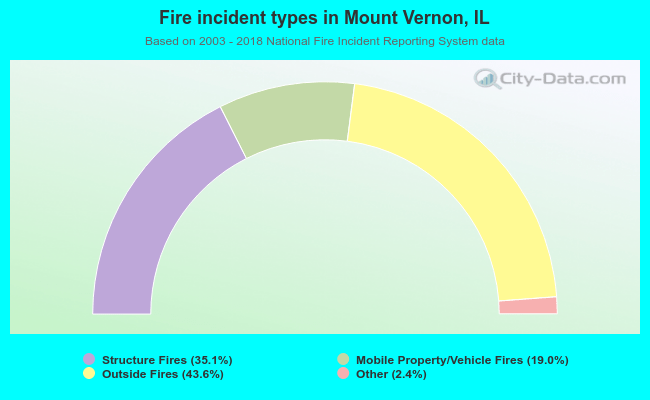 When looking into fire subcategories, the most reports belonged to: Outside Fires (43.6%), and Structure Fires (35.1%).